By InvestMacro
The latest update for the weekly Commitment of Traders (COT) report was released by the Commodity Futures Trading Commission (CFTC) on Friday for data ending on February 24th.
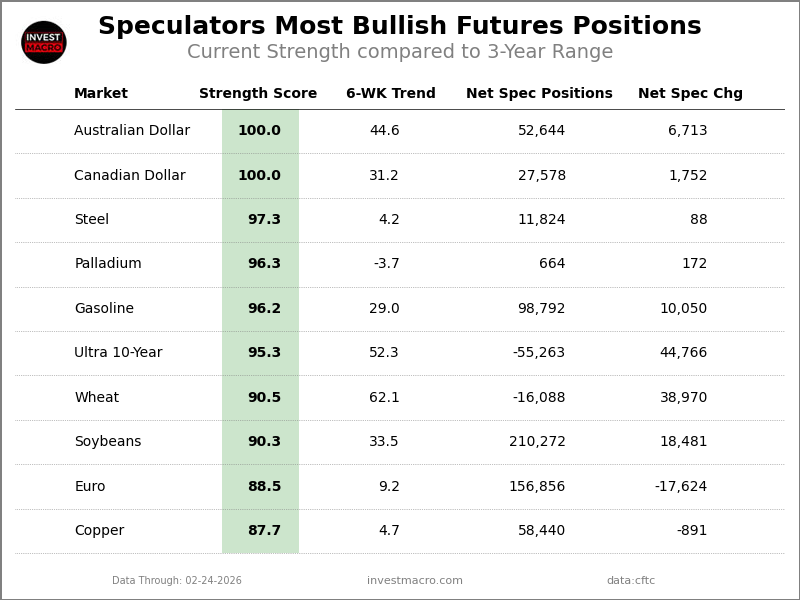
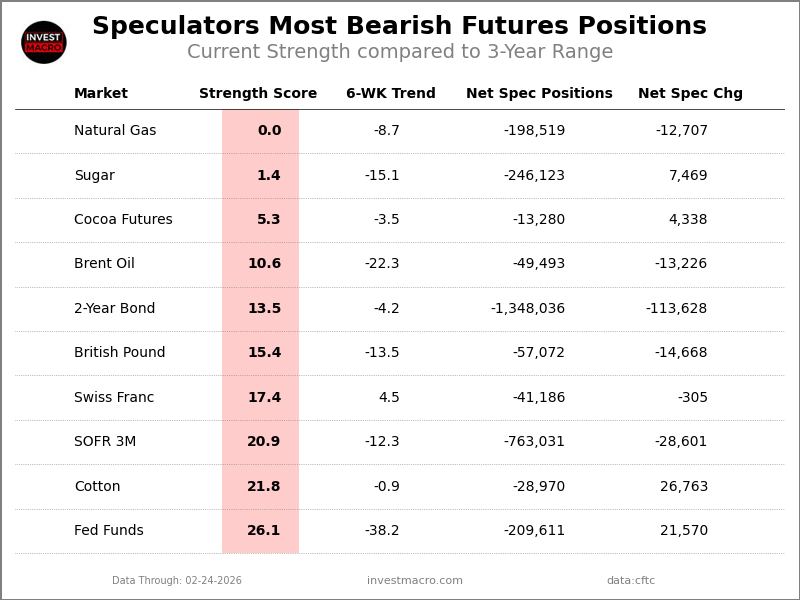
This weekly Extreme Positions report highlights the Most Bullish and Most Bearish Positions for the speculator category. Extreme positioning in these markets can foreshadow strong moves in the underlying market.
To signify an extreme position, we use the Strength Index (also known as the COT Index) of each instrument, a common method of measuring COT data. The Strength Index is simply a comparison of current trader positions against the range of positions over the previous 3 years. We use over 80 percent as extremely bullish and under 20 percent as extremely bearish. (Compare Strength Index scores across all markets in the data table or cot leaders table)
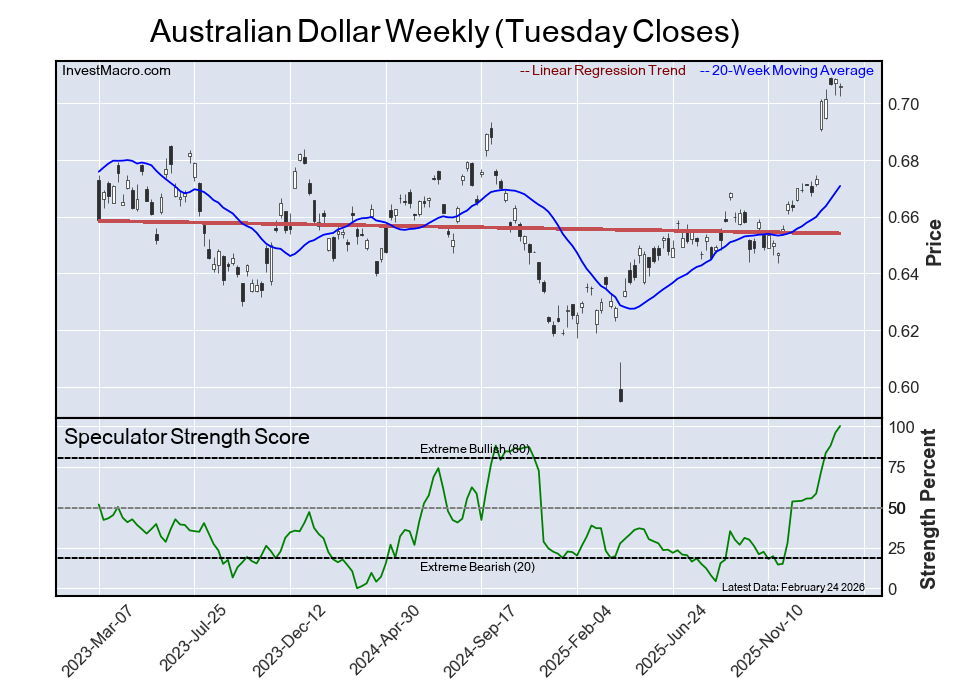
The Australian Dollar speculator position comes in tied as the most bullish extreme standing for a second straight this week as the AUD speculator level is currently at a maximum 100 percent score of its 3-year range.
Free Reports:
The six-week trend for the percent strength score totaled a strong gain by 45 percentage points this week. The overall net speculator position was a total of 52,644 net contracts this week with an advance by 6,713 contract in the weekly speculator bets.
Speculators or Non-Commercials Notes:
Speculators, classified as non-commercial traders by the CFTC, are made up of large commodity funds, hedge funds and other significant for-profit participants. The Specs are generally regarded as trend-followers in their behavior towards price action – net speculator bets and prices tend to go in the same directions. These traders often look to buy when prices are rising and sell when prices are falling. To illustrate this point, many times speculator contracts can be found at their most extremes (bullish or bearish) when prices are also close to their highest or lowest levels.
These extreme levels can be dangerous for the large speculators as the trade is most crowded, there is less trading ammunition still sitting on the sidelines to push the trend further and prices have moved a significant distance. When the trend becomes exhausted, some speculators take profits while others look to also exit positions when prices fail to continue in the same direction. This process usually plays out over many months to years and can ultimately create a reverse effect where prices start to fall and speculators start a process of selling when prices are falling.
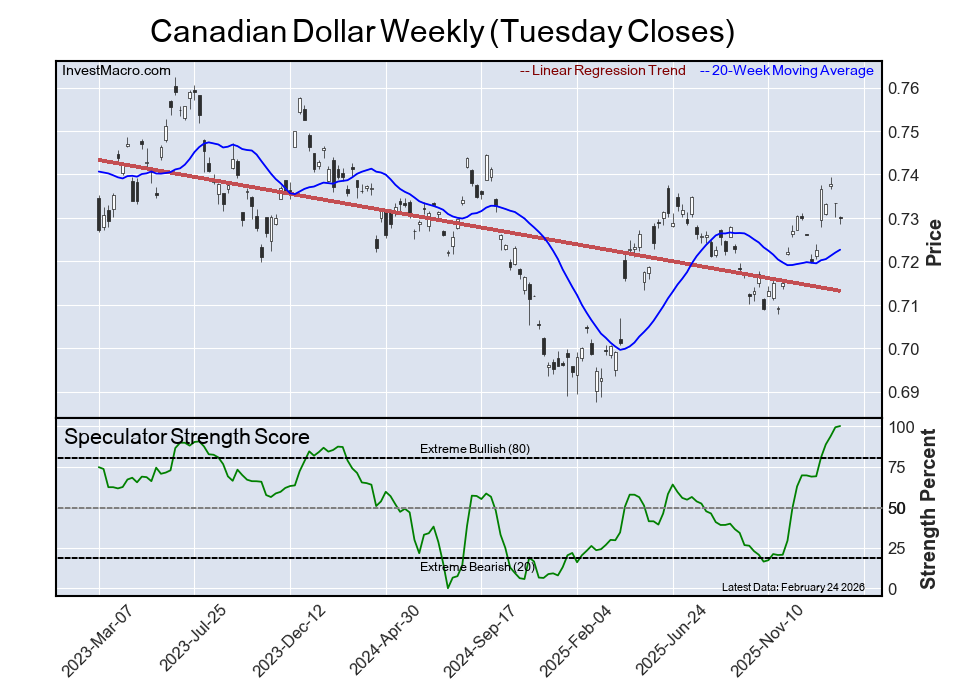
The Canadian Dollar speculator position also comes in tied as the most bullish extreme standing once again this week as well. The CAD speculator level is also at a maximum 100 percent score of its 3-year range.
The six-week trend for the percent strength score was a jump by 31 percentage points this week while the speculator position registered 27,578 net contracts this week with a modest increase by 1,752 contracts in speculator bets.
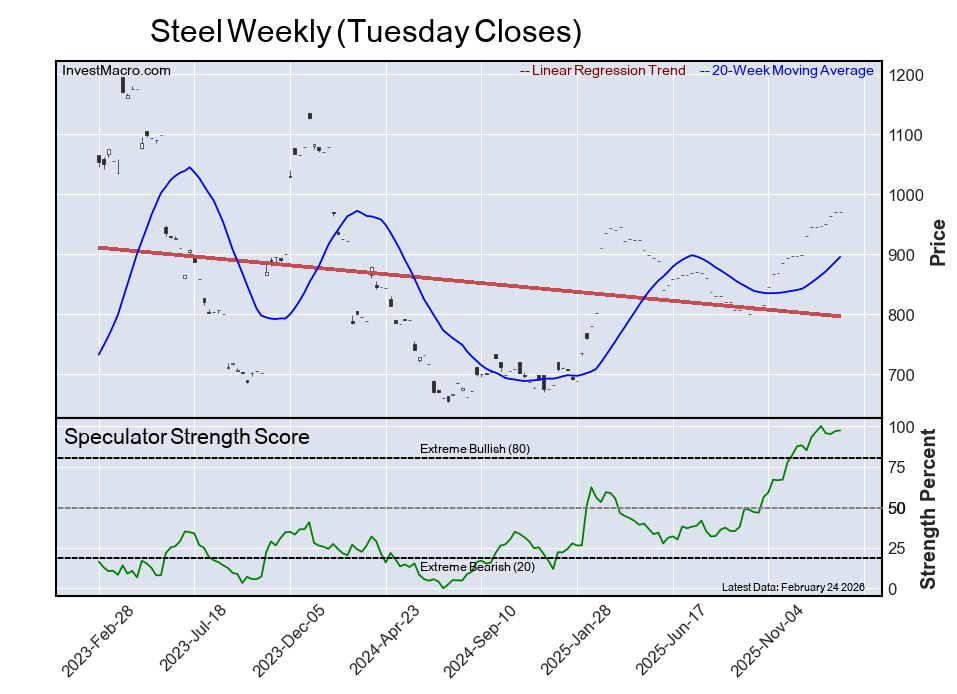
The Steel speculator position comes in third this week in the extreme standings with the Steel speculator level residing at a 97 percent score of its 3-year range.
The six-week trend for the speculator strength score came in at a rise by 4 percentage points this week. The overall speculator position was 11,824 net contracts this week with a slight uptick by 88 contracts in the weekly speculator bets.
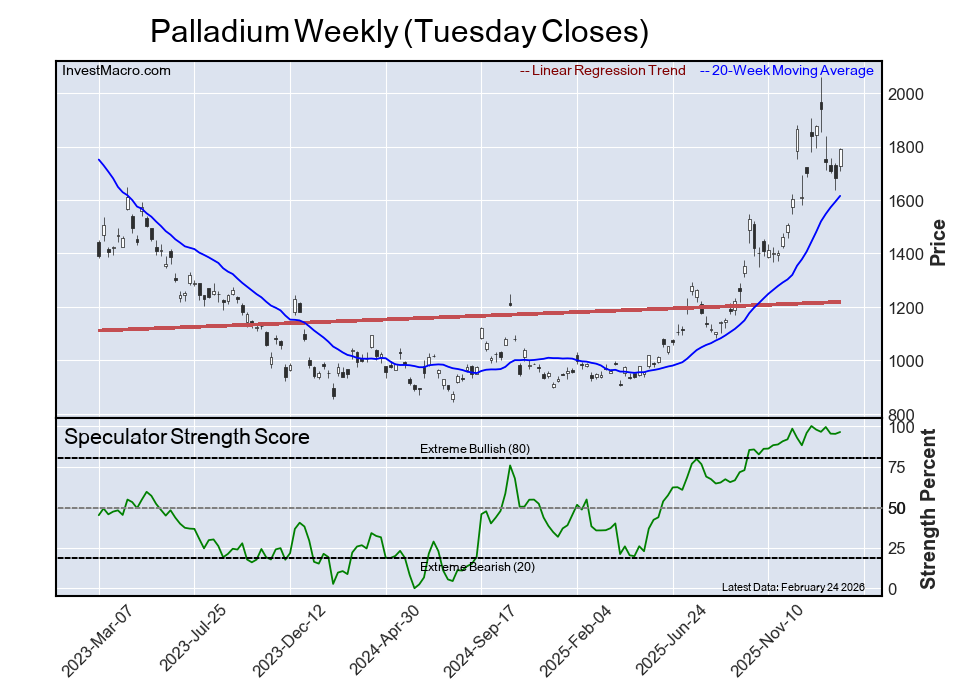
The Palladium speculator position comes up number four in the extreme standings this week. The Palladium speculator level is at a 96 percent score of its 3-year range and the six-week trend for the speculator strength score totaled a decline of -4 percentage points this week.
The overall net speculator position was 664 net contracts this week with a small gain of 172 contracts in the speculator bets.
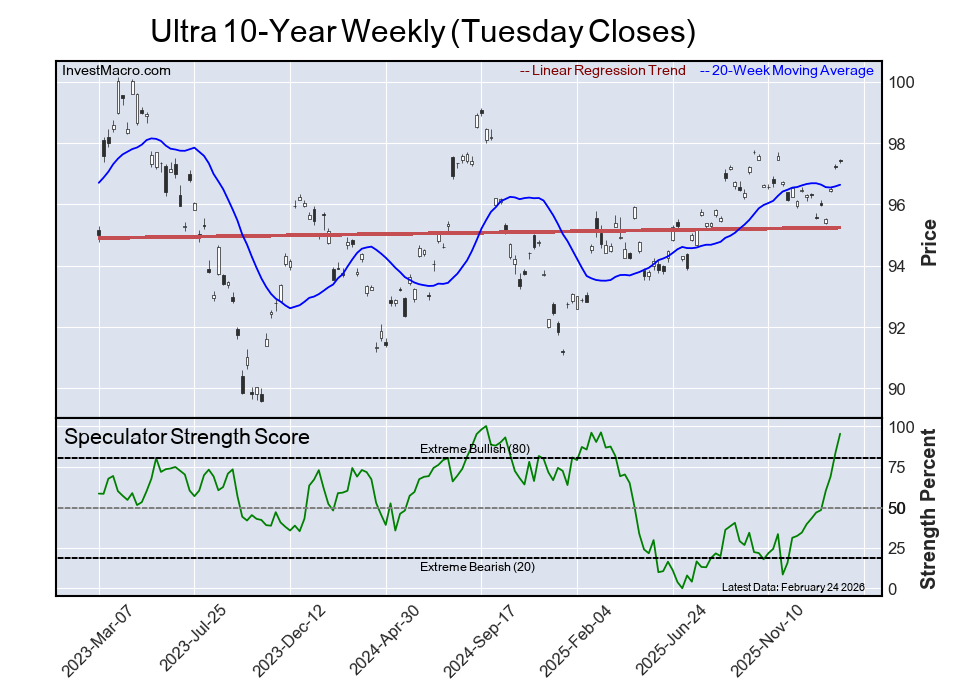
The Ultra 10-Year speculator position rounds out the top five in this week’s bullish extreme standings with the Ultra 10-Year speculator level sitting at a 95 percent score of its 3-year range.
The six-week trend for the speculator strength score was a huge jump by 52 percentage points this week. The speculator position was -55,263 net contracts this week with a gain of 44,766 contracts in the weekly speculator bets.
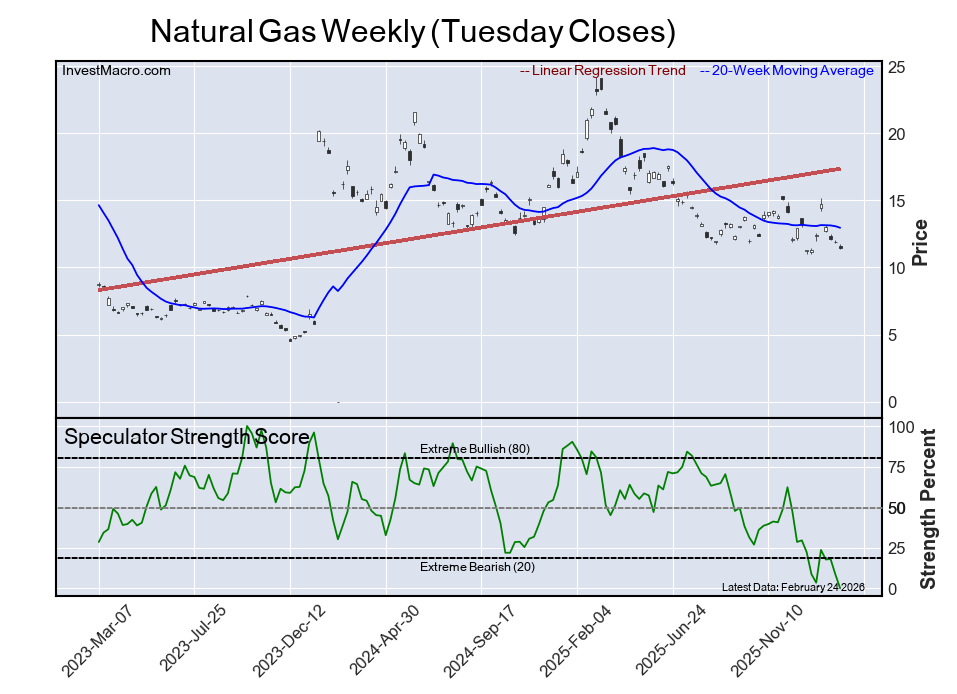
The Natural Gas speculator position comes in as the most bearish extreme standing this week as the Natural Gas speculator level is at a minimum 0 percent score of its 3-year range.
The six-week trend for the strength score was a decrease by -9 percentage points this week while the overall speculator position was -198,519 net contracts this week with a fall of -12,707 contracts in the speculator bets.
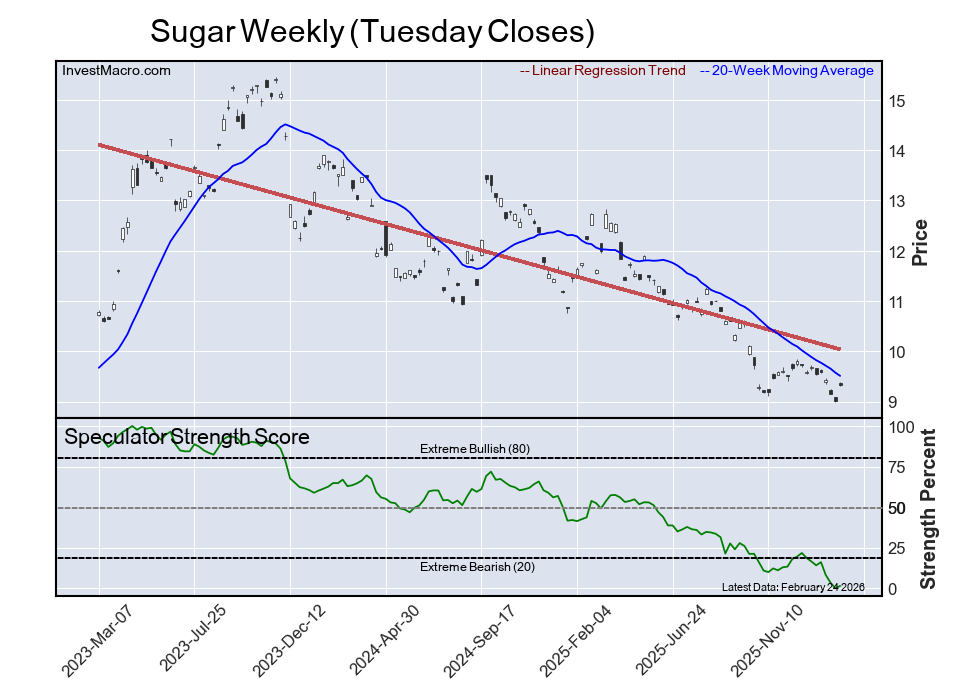
The Sugar speculator position comes in a close second for the most bearish extreme standing on the week with the Sugar speculator level sitting at a 1 percent score of its 3-year range.
The six-week trend for the strength score was a decrease by -15 percentage points this week while the speculator position was -246,123 net contracts this week with a gain of 7,469 contracts in the weekly speculator bets.
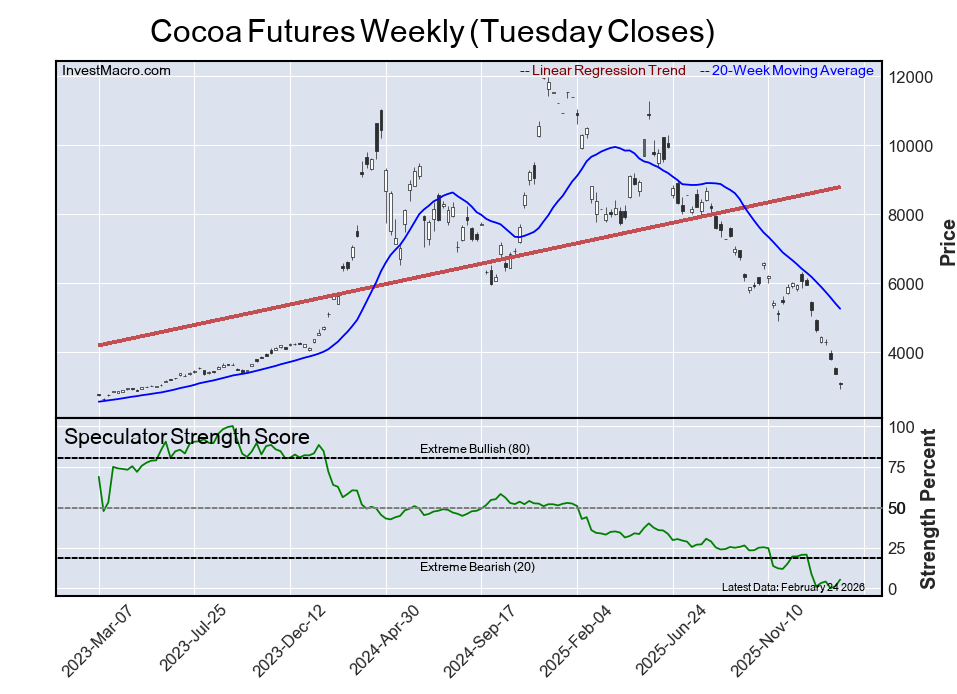
The Cocoa Futures speculator position comes in as third most bearish extreme standing of the week as the Cocoa speculator level resides at just a 5 percent score of its 3-year range.
The six-week trend for the strength score was a dip by -4 percentage points this week and the overall speculator position was -13,280 net contracts this week with a rise of 4,338 contracts in the speculator bets.
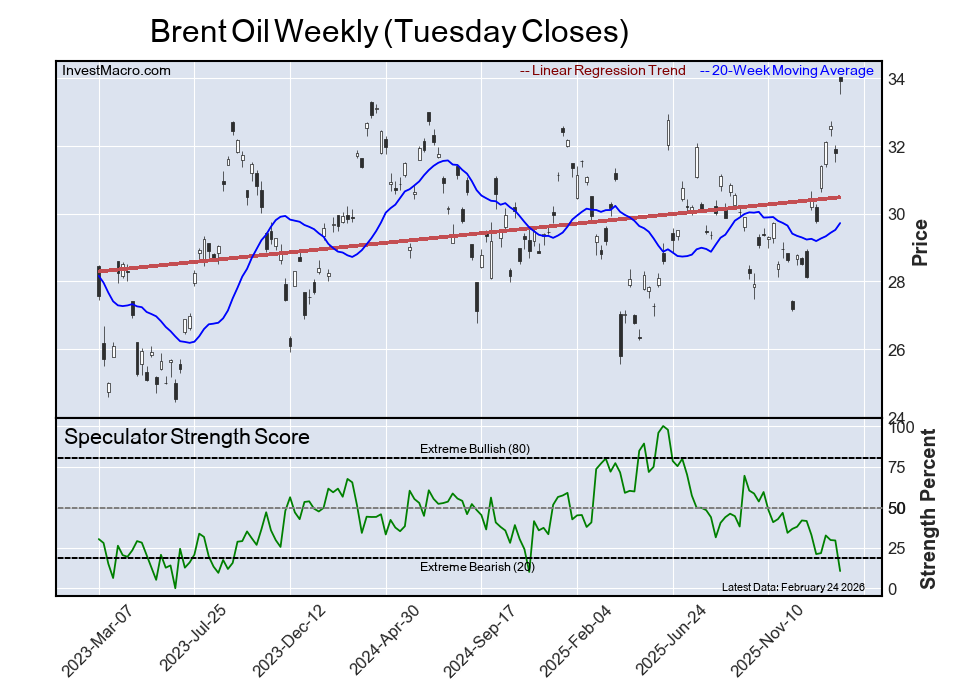
The Brent Oil speculator position comes in as this week’s fourth most bearish extreme standing with the Brent speculator level at an 11 percent score of its 3-year range.
The six-week trend for the speculator strength score was a decline by -22 percentage points this week. The speculator position was -49,493 net contracts this week and had a decline of -13,226 contracts in the weekly speculator bets.
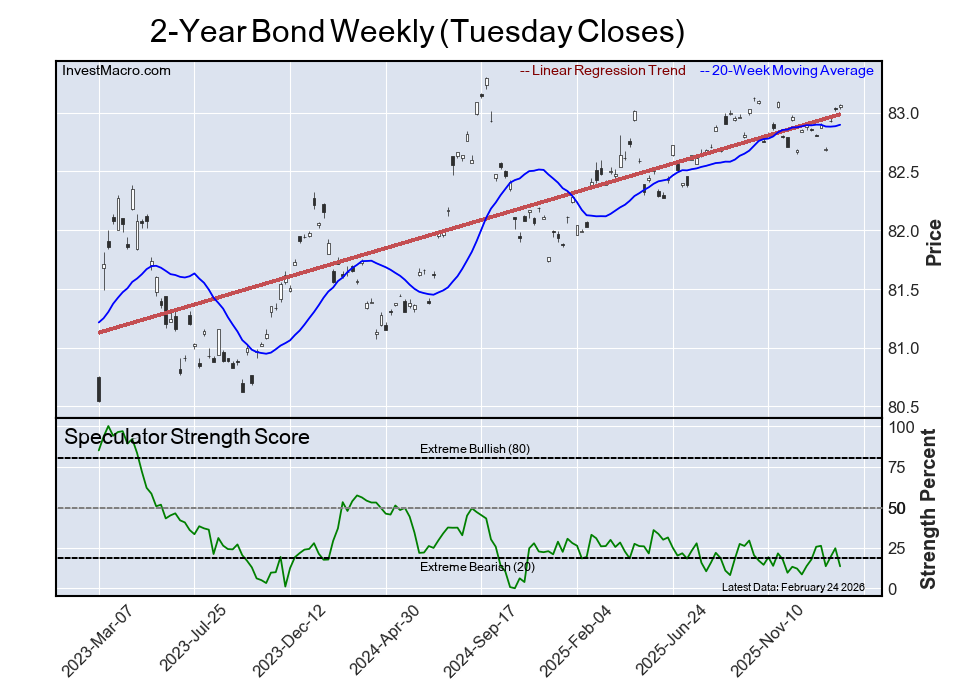
Next, the 2-Year Bond speculator position comes in as the fifth most bearish extreme standing for this week. The 2-Year speculator level is at just a 14 percent score of its 3-year range.
The six-week trend for the speculator strength score was a dip by -4 percentage points this week and the speculator position was -1,348,036 net contracts this week with a drop of -113,628 contracts in the weekly speculator bets.
Article By InvestMacro – Receive our weekly COT Newsletter
*COT Report: The COT data, released weekly to the public each Friday, is updated through the most recent Tuesday (data is 3 days old) and shows a quick view of how large speculators or non-commercials (for-profit traders) were positioned in the futures markets.
The CFTC categorizes trader positions according to commercial hedgers (traders who use futures contracts for hedging as part of the business), non-commercials (large traders who speculate to realize trading profits) and nonreportable traders (usually small traders/speculators) as well as their open interest (contracts open in the market at time of reporting). See CFTC criteria here.
By JustMarkets The US stock market rose on Wednesday. By the end of the day,…
By Daniele D'Alvia, Queen Mary University of London When a conflict escalates, financial markets respond…
By Analytical Department RoboForex GBP/USD contracted to 1.3350 on Thursday, with the pound remaining under…
Opinion -- Source: Michael Ballanger (3/2/26) Michael Ballanger of GGM Advisory Inc. shares his view…
By ForexTime Oil benchmarks surge over 15% since Monday on supply fears Spiking energy prices…
By JustMarkets The US stock market declined sharply on Tuesday. By the end of the…
This website uses cookies.