
By Analytical Department RoboForex
Gold rose to 5,350 USD per ounce on Tuesday, marking its fifth consecutive session of gains. Demand for safe-haven assets continues to grow amid the escalating conflict in the Middle East.
President Donald Trump stated that the United States will continue its strikes on Iran until the country loses its ability to pose a threat. According to him, the conflict could last a month or “much longer.” In response, Iran has announced the closure of the Strait of Hormuz and threatened attacks on ships passing through this strategically vital energy corridor.
The worsening conflict has triggered a sharp rise in oil prices and intensified fears of accelerating US inflation. This has led to selling in US government bonds and a reassessment of expectations for further Federal Reserve rate cuts.
The market is now shifting its forecast for the next Fed rate cut to September, later than previously anticipated.
Technical Analysis
Free Reports:
 Get our Weekly Commitment of Traders Reports - See where the biggest traders (Hedge Funds and Commercial Hedgers) are positioned in the futures markets on a weekly basis.
 Download Our Metatrader 4 Indicators – Put Our Free MetaTrader 4 Custom Indicators on your charts when you join our Weekly Newsletter
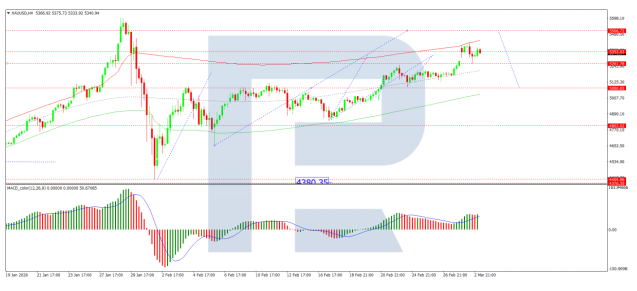
On the H4 XAU/USD chart, the market is forming a consolidation range around the 5,353 USD level. A downside breakout would open the way for a continuation of the correction towards 5,130 USD. Conversely, an upside breakout would open up potential for a wave towards the 5,599 USD level. The MACD indicator confirms the current momentum, with its signal line at highs and pointing strictly upwards.
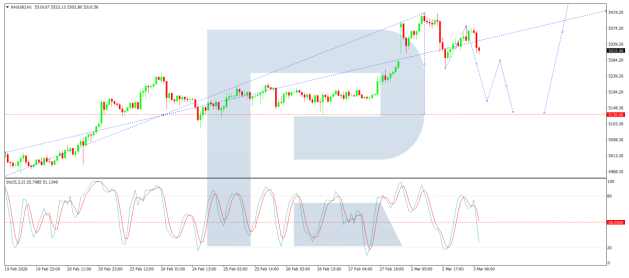
On the H1 chart, the market has broken below the 5,333 USD level, suggesting a continuation of the trend towards 5,166 USD, with the potential for the wave to extend further to 5,130 USD. The stochastic oscillator supports this scenario, with its signal line remaining above the 80 level and under pressure to turn lower towards the 20 level.
Conclusion
Gold’s rally to record highs reflects escalating demand for safe-haven assets amid intensifying geopolitical risks in the Middle East. The conflict has not only boosted bullion but also lifted oil prices and stoked concerns about inflation, prompting markets to push back expectations for Fed rate cuts. While the short-term technical outlook remains bullish, traders are watching for potential corrections following such a strong upward move.
Disclaimer
Any forecasts contained herein are based on the author’s particular opinion. This analysis may not be treated as trading advice. RoboForex bears no responsibility for trading results based on trading recommendations and reviews contained herein.

- COT Metals Charts: Weekly Speculator Changes led by Copper Jul 26, 2026
- COT Bonds Charts: Speculator Bets led by SOFR 3-Months & 5-Year Bonds Jul 26, 2026
- COT Energy Charts: Weekly Speculator Bets led by WTI Crude & Natural Gas Jul 26, 2026
- COT Soft Commodities Charts: Weekly Speculator Bets led by Corn & Soybeans Jul 26, 2026
- The US introduces new import tariffs for 60 countries. Brent crude surpasses $100 per barrel Jul 24, 2026
- USD/JPY Breaks Records: Nothing Slows the Yen’s Decline Jul 24, 2026
- Oil prices reached a 6‑week high. The AUD strengthened on the back of a strong labor‑market report Jul 23, 2026
- EUR/USD Recovers as Dollar Weakens Jul 23, 2026
- Bitcoin rose to $66,000. The New Zealand dollar continues to strengthen Jul 22, 2026
- Inflationary pressure is easing in Canada. In New Zealand, on the contrary, inflation is rising Jul 21, 2026
