By InvestMacro
Here are the latest charts and statistics for the Commitment of Traders (COT) data published by the Commodities Futures Trading Commission (CFTC).
The latest COT data is updated through Tuesday February 17th and shows a quick view of how large traders (for-profit speculators and commercial entities) were positioned in the futures markets.
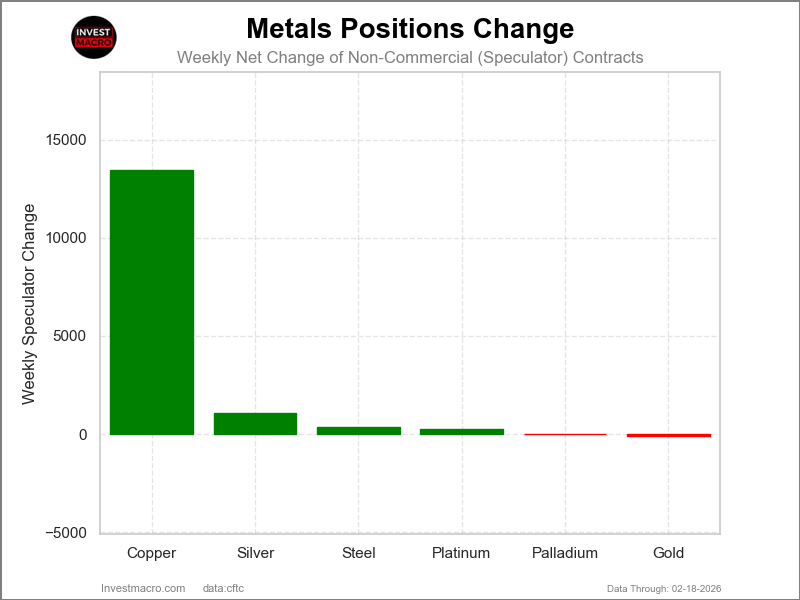
The COT metals markets speculator bets were overall higher this week as four out of the six metals markets we cover had higher positioning while the other two markets had lower speculator contracts.
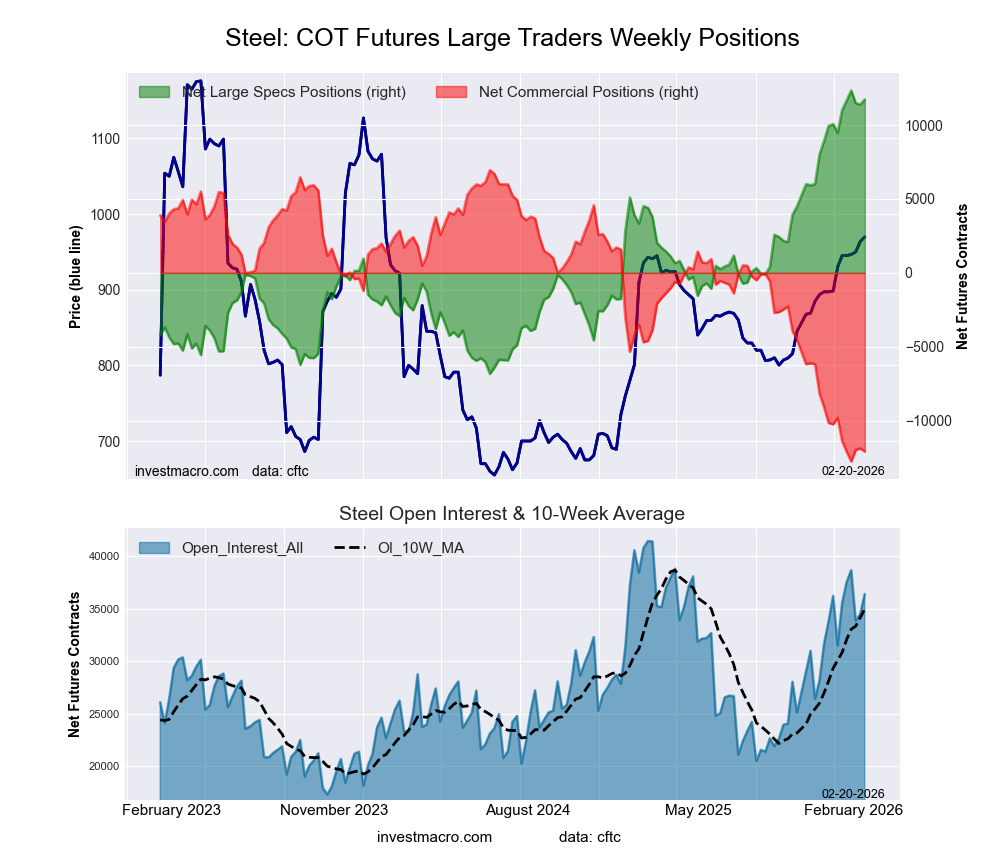
Leading the gains for the metals was Copper (13,458 contracts) with Silver (1,048 contracts), Steel (344 contracts) and Platinum (263 contracts) also recording positive weeks.
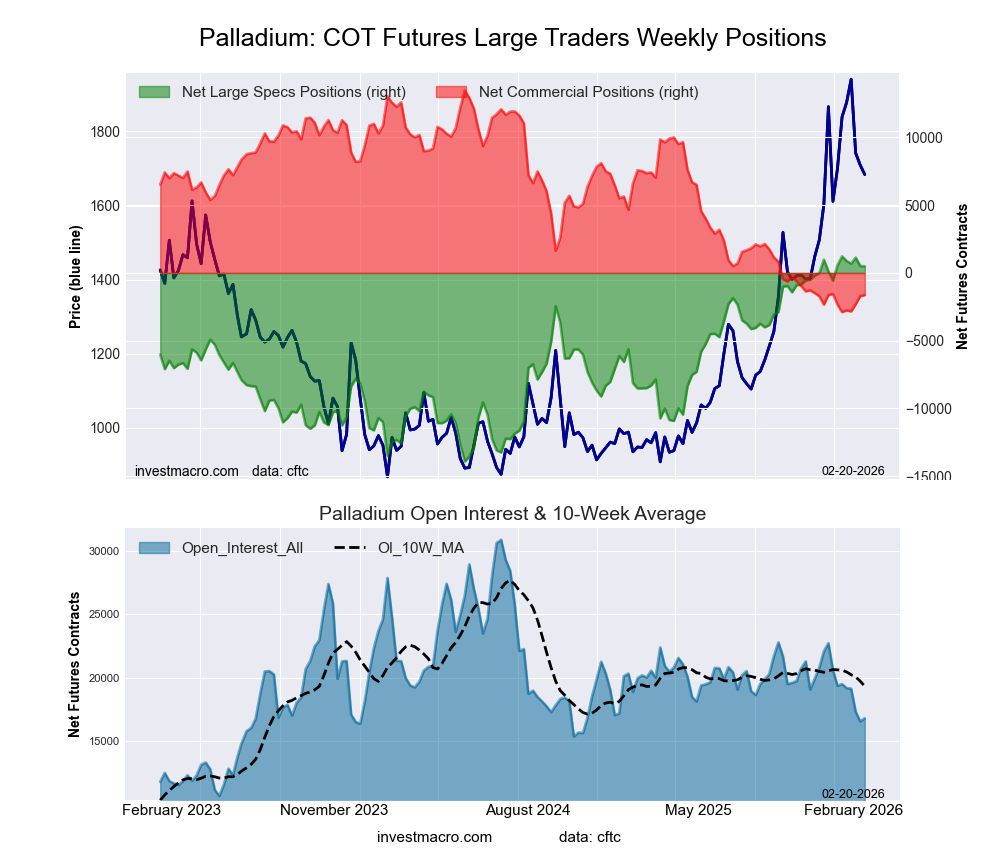
The markets with declines in speculator bets for the week were Gold (-97 contracts) and with Palladium (-21 contracts) also seeing lower bets on the week.
Free Reports:
Highlighting the speculator bets this week was copper, which rebounded with a weekly gain of +13,458 net contracts. Copper had seen lower speculator bets in the preceding seven consecutive weeks, which had dropped the Copper speculator position to the lowest level since October.
This week’s positive rebound shoots the overall net speculator position back up over +59,000 contracts, the most bullish level since December 30th. Overall, Copper speculator positions have been consistently in a bullish standing, dating back to March 5th of 2024, a span of 102 consecutive bullish weeks.
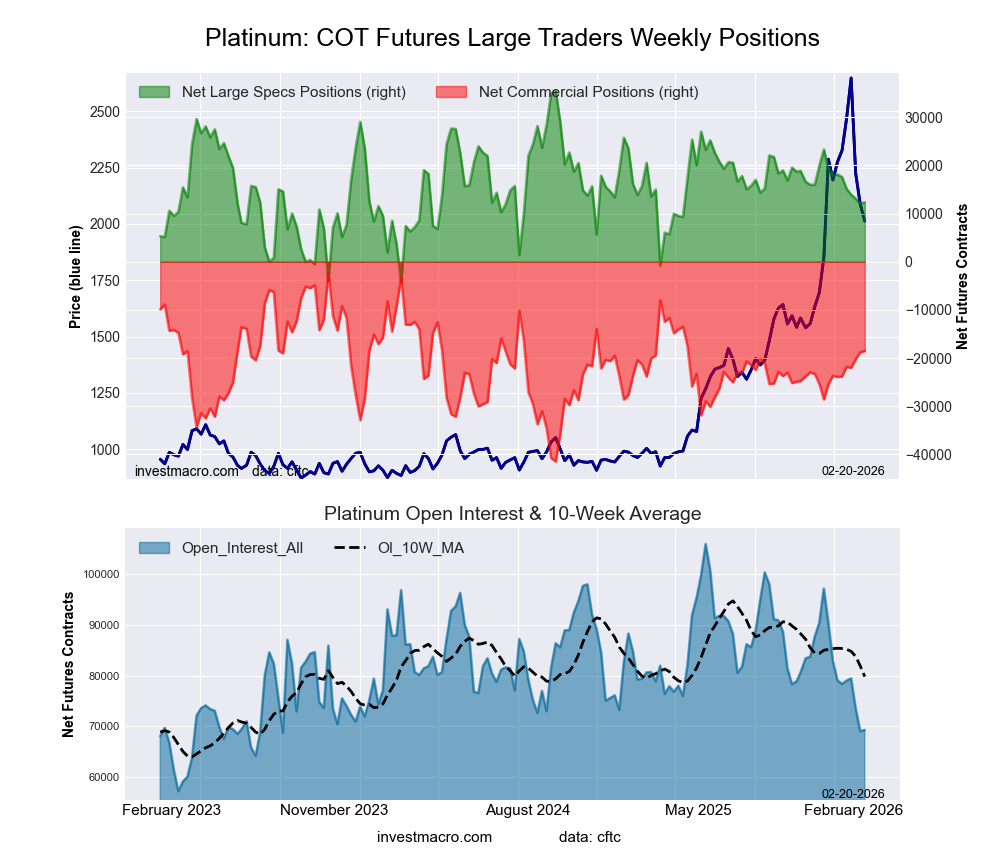
Silver bounced back this week with a 5.62% gain over the past five days. This was followed by Platinum which rose by 4.94% over that same period.
Gold was higher by 3.82% while Palladium showed a rise of 3.67%, and rounding out the gainers was Copper with a 1.86% increase.
Steel was virtually unchanged on the week with a -0.03% dip.
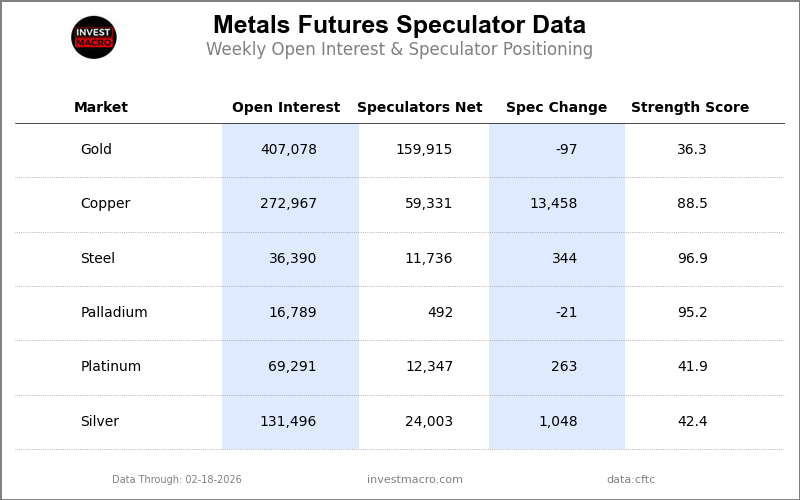
Legend: Weekly Speculators Change | Speculators Current Net Position | Speculators Strength Score compared to last 3-Years (0-100 range)
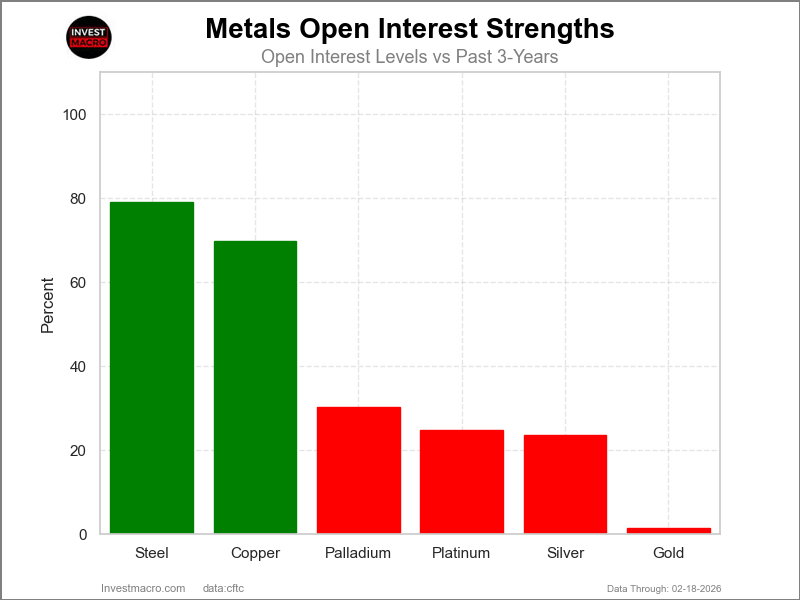
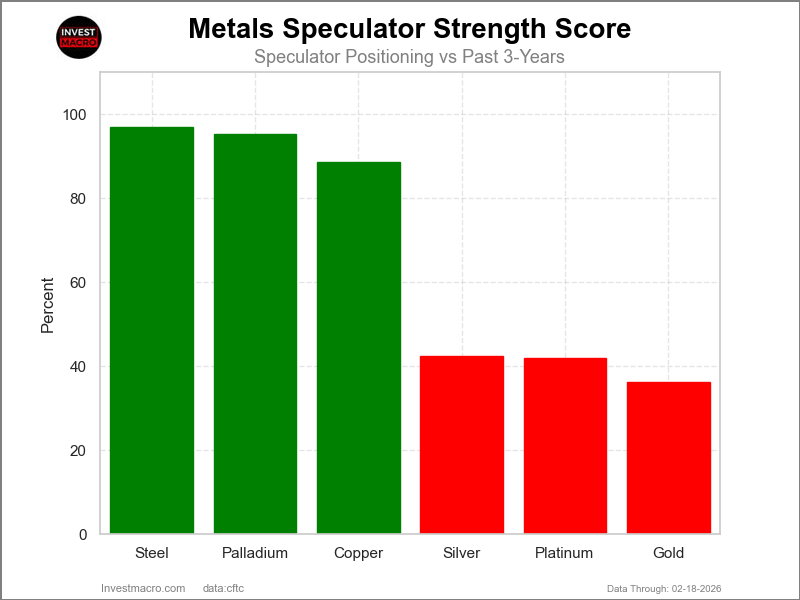
COT Strength Scores (a normalized measure of Speculator positions over a 3-Year range, from 0 to 100 where above 80 is Extreme-Bullish and below 20 is Extreme-Bearish) showed that Steel (97 percent) and Palladium (95 percent) lead the metals markets this week.
On the downside, Gold (36 percent), Platinum (42 percent) and Silver (42 percent) come in at the lowest strength level currently.
Strength Statistics:
Gold (36.3 percent) vs Gold previous week (36.3 percent)
Silver (42.4 percent) vs Silver previous week (41.0 percent)
Copper (88.5 percent) vs Copper previous week (76.0 percent)
Platinum (41.9 percent) vs Platinum previous week (41.2 percent)
Palladium (95.2 percent) vs Palladium previous week (95.3 percent)
Steel (96.9 percent) vs Steel previous week (95.1 percent)
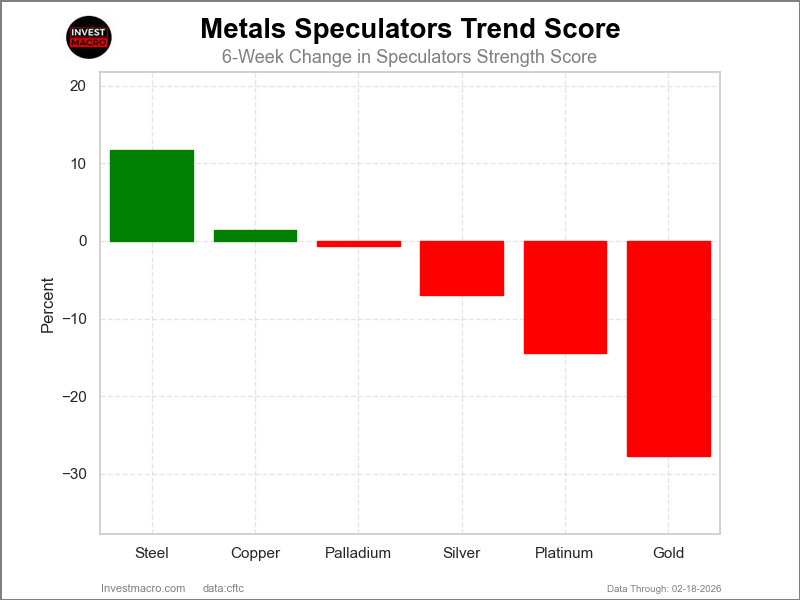
COT Strength Score Trends (or move index, calculates the 6-week changes in strength scores) showed that Steel (12 percent) and Copper (1 percent) lead the past six weeks trends for metals.
Gold (-28 percent), Platinum (-14 percent) and Silver (-7 percent) are the leaders of the downside trend scores currently.
Move Statistics:
Gold (-27.8 percent) vs Gold previous week (-29.2 percent)
Silver (-7.0 percent) vs Silver previous week (-9.5 percent)
Copper (1.4 percent) vs Copper previous week (-13.0 percent)
Platinum (-14.4 percent) vs Platinum previous week (-14.9 percent)
Palladium (-0.6 percent) vs Palladium previous week (7.2 percent)
Steel (11.8 percent) vs Steel previous week (6.9 percent)
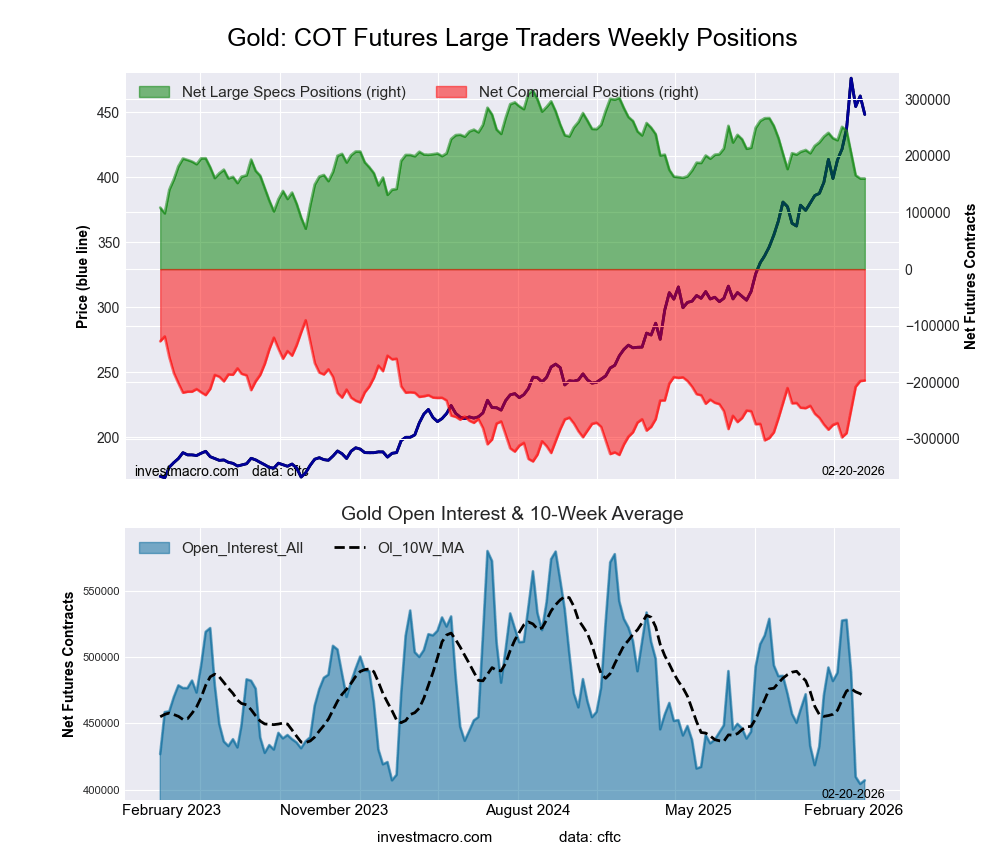
This week’s current strength score (the trader positioning range over the past three years, measured from 0 to 100) shows the speculators are currently Bearish with a score of 36.3 percent. The commercials are Bullish with a score of 57.3 percent and the small traders (not shown in chart) are Bullish with a score of 73.7 percent.
Our weekly trend-following model classifies the current market price position as: Strong Uptrend.
| Gold Futures Statistics | SPECULATORS | COMMERCIALS | SMALL TRADERS |
| – Percent of Open Interest Longs: | 52.4 | 21.7 | 12.7 |
| – Percent of Open Interest Shorts: | 13.1 | 70.0 | 3.7 |
| – Net Position: | 159,915 | -196,782 | 36,867 |
| – Gross Longs: | 213,432 | 88,237 | 51,821 |
| – Gross Shorts: | 53,517 | 285,019 | 14,954 |
| – Long to Short Ratio: | 4.0 to 1 | 0.3 to 1 | 3.5 to 1 |
| NET POSITION TREND: | |||
| – Strength Index Score (3 Year Range Pct): | 36.3 | 57.3 | 73.7 |
| – Strength Index Reading (3 Year Range): | Bearish | Bullish | Bullish |
| NET POSITION MOVEMENT INDEX: | |||
| – 6-Week Change in Strength Index: | -27.8 | 30.2 | -22.0 |
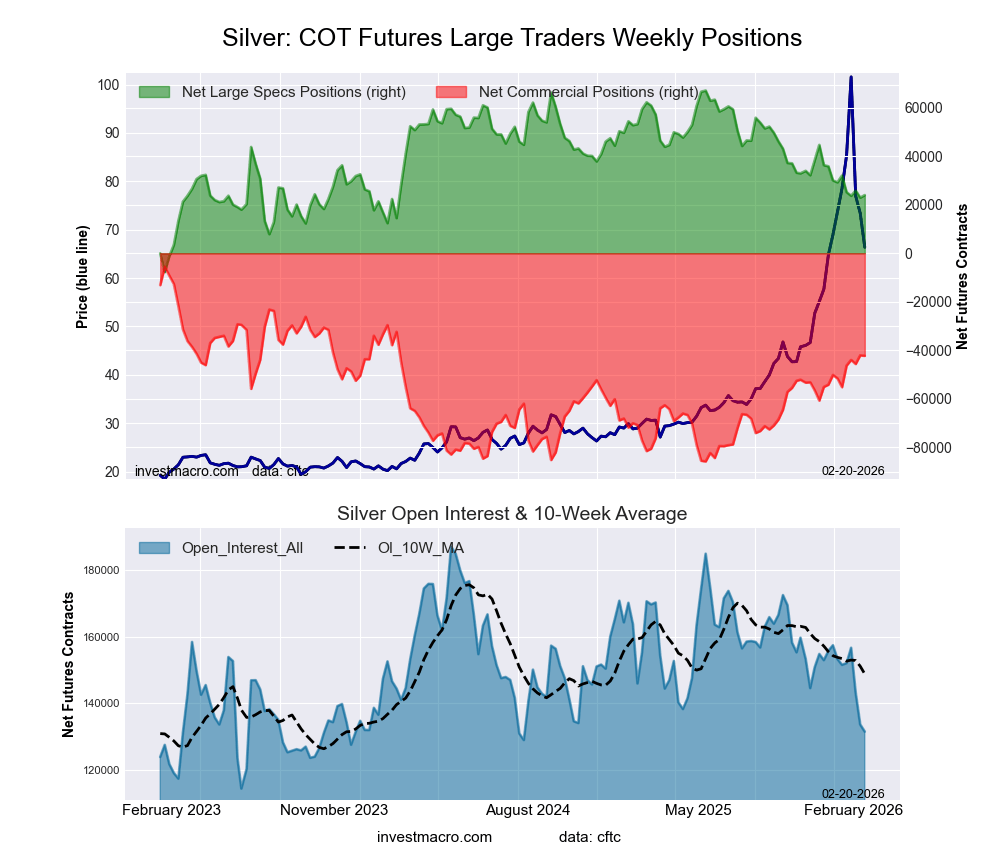
This week’s current strength score (the trader positioning range over the past three years, measured from 0 to 100) shows the speculators are currently Bearish with a score of 42.4 percent. The commercials are Bullish with a score of 54.3 percent and the small traders (not shown in chart) are Bullish with a score of 54.0 percent.
Our weekly trend-following model classifies the current market price position as: Uptrend.
| Silver Futures Statistics | SPECULATORS | COMMERCIALS | SMALL TRADERS |
| – Percent of Open Interest Longs: | 27.9 | 27.9 | 21.7 |
| – Percent of Open Interest Shorts: | 9.6 | 60.1 | 7.7 |
| – Net Position: | 24,003 | -42,347 | 18,344 |
| – Gross Longs: | 36,626 | 36,729 | 28,514 |
| – Gross Shorts: | 12,623 | 79,076 | 10,170 |
| – Long to Short Ratio: | 2.9 to 1 | 0.5 to 1 | 2.8 to 1 |
| NET POSITION TREND: | |||
| – Strength Index Score (3 Year Range Pct): | 42.4 | 54.3 | 54.0 |
| – Strength Index Reading (3 Year Range): | Bearish | Bullish | Bullish |
| NET POSITION MOVEMENT INDEX: | |||
| – 6-Week Change in Strength Index: | -7.0 | 11.6 | -22.4 |
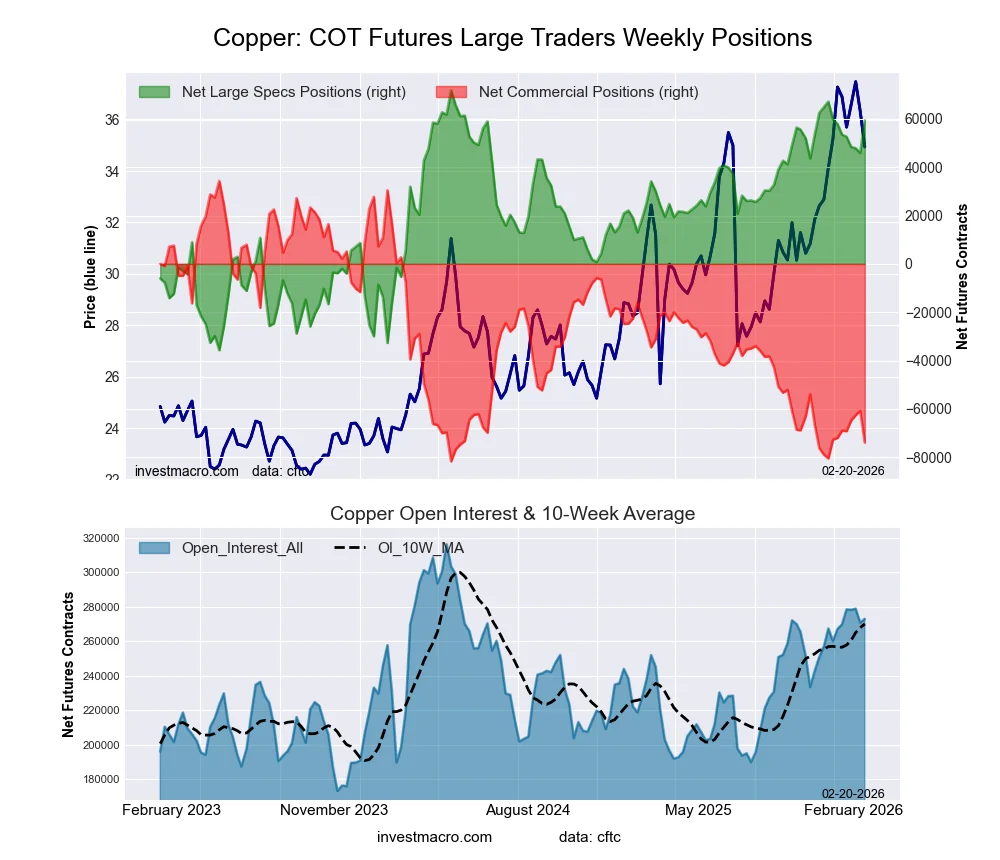
This week’s current strength score (the trader positioning range over the past three years, measured from 0 to 100) shows the speculators are currently Bullish-Extreme with a score of 88.5 percent. The commercials are Bearish-Extreme with a score of 6.8 percent and the small traders (not shown in chart) are Bullish-Extreme with a score of 89.4 percent.
Our weekly trend-following model classifies the current market price position as: Uptrend.
| Copper Futures Statistics | SPECULATORS | COMMERCIALS | SMALL TRADERS |
| – Percent of Open Interest Longs: | 32.9 | 33.5 | 8.9 |
| – Percent of Open Interest Shorts: | 11.1 | 60.6 | 3.6 |
| – Net Position: | 59,331 | -73,886 | 14,555 |
| – Gross Longs: | 89,699 | 91,573 | 24,327 |
| – Gross Shorts: | 30,368 | 165,459 | 9,772 |
| – Long to Short Ratio: | 3.0 to 1 | 0.6 to 1 | 2.5 to 1 |
| NET POSITION TREND: | |||
| – Strength Index Score (3 Year Range Pct): | 88.5 | 6.8 | 89.4 |
| – Strength Index Reading (3 Year Range): | Bullish-Extreme | Bearish-Extreme | Bullish-Extreme |
| NET POSITION MOVEMENT INDEX: | |||
| – 6-Week Change in Strength Index: | 1.4 | -1.6 | 2.1 |
This week’s current strength score (the trader positioning range over the past three years, measured from 0 to 100) shows the speculators are currently Bearish with a score of 41.9 percent. The commercials are Bullish with a score of 58.6 percent and the small traders (not shown in chart) are Bullish with a score of 69.9 percent.
Our weekly trend-following model classifies the current market price position as: Uptrend.
| Platinum Futures Statistics | SPECULATORS | COMMERCIALS | SMALL TRADERS |
| – Percent of Open Interest Longs: | 41.6 | 28.7 | 13.2 |
| – Percent of Open Interest Shorts: | 23.8 | 55.5 | 4.3 |
| – Net Position: | 12,347 | -18,536 | 6,189 |
| – Gross Longs: | 28,826 | 19,913 | 9,175 |
| – Gross Shorts: | 16,479 | 38,449 | 2,986 |
| – Long to Short Ratio: | 1.7 to 1 | 0.5 to 1 | 3.1 to 1 |
| NET POSITION TREND: | |||
| – Strength Index Score (3 Year Range Pct): | 41.9 | 58.6 | 69.9 |
| – Strength Index Reading (3 Year Range): | Bearish | Bullish | Bullish |
| NET POSITION MOVEMENT INDEX: | |||
| – 6-Week Change in Strength Index: | -14.4 | 13.8 | 4.4 |
This week’s current strength score (the trader positioning range over the past three years, measured from 0 to 100) shows the speculators are currently Bullish-Extreme with a score of 95.2 percent. The commercials are Bearish-Extreme with a score of 7.7 percent and the small traders (not shown in chart) are Bullish with a score of 59.6 percent.
Our weekly trend-following model classifies the current market price position as: Uptrend.
| Palladium Futures Statistics | SPECULATORS | COMMERCIALS | SMALL TRADERS |
| – Percent of Open Interest Longs: | 45.1 | 36.1 | 14.6 |
| – Percent of Open Interest Shorts: | 42.2 | 45.9 | 7.8 |
| – Net Position: | 492 | -1,634 | 1,142 |
| – Gross Longs: | 7,577 | 6,066 | 2,447 |
| – Gross Shorts: | 7,085 | 7,700 | 1,305 |
| – Long to Short Ratio: | 1.1 to 1 | 0.8 to 1 | 1.9 to 1 |
| NET POSITION TREND: | |||
| – Strength Index Score (3 Year Range Pct): | 95.2 | 7.7 | 59.6 |
| – Strength Index Reading (3 Year Range): | Bullish-Extreme | Bearish-Extreme | Bullish |
| NET POSITION MOVEMENT INDEX: | |||
| – 6-Week Change in Strength Index: | -0.6 | 4.3 | -21.3 |
This week’s current strength score (the trader positioning range over the past three years, measured from 0 to 100) shows the speculators are currently Bullish-Extreme with a score of 96.9 percent. The commercials are Bearish-Extreme with a score of 3.4 percent and the small traders (not shown in chart) are Bullish-Extreme with a score of 80.0 percent.
Our weekly trend-following model classifies the current market price position as: Uptrend.
| Steel Futures Statistics | SPECULATORS | COMMERCIALS | SMALL TRADERS |
| – Percent of Open Interest Longs: | 39.5 | 56.8 | 1.5 |
| – Percent of Open Interest Shorts: | 7.2 | 90.0 | 0.5 |
| – Net Position: | 11,736 | -12,085 | 349 |
| – Gross Longs: | 14,362 | 20,654 | 537 |
| – Gross Shorts: | 2,626 | 32,739 | 188 |
| – Long to Short Ratio: | 5.5 to 1 | 0.6 to 1 | 2.9 to 1 |
| NET POSITION TREND: | |||
| – Strength Index Score (3 Year Range Pct): | 96.9 | 3.4 | 80.0 |
| – Strength Index Reading (3 Year Range): | Bullish-Extreme | Bearish-Extreme | Bullish-Extreme |
| NET POSITION MOVEMENT INDEX: | |||
| – 6-Week Change in Strength Index: | 11.8 | -11.5 | 1.4 |
Article By InvestMacro – Receive our weekly COT Newsletter
*COT Report: The COT data, released weekly to the public each Friday, is updated through the most recent Tuesday (data is 3 days old) and shows a quick view of how large speculators or non-commercials (for-profit traders) were positioned in the futures markets.
The CFTC categorizes trader positions according to commercial hedgers (traders who use futures contracts for hedging as part of the business), non-commercials (large traders who speculate to realize trading profits) and nonreportable traders (usually small traders/speculators) as well as their open interest (contracts open in the market at time of reporting). See CFTC criteria here.
By JustMarkets The US stock market rose on Wednesday. By the end of the day,…
By Daniele D'Alvia, Queen Mary University of London When a conflict escalates, financial markets respond…
By Analytical Department RoboForex GBP/USD contracted to 1.3350 on Thursday, with the pound remaining under…
Opinion -- Source: Michael Ballanger (3/2/26) Michael Ballanger of GGM Advisory Inc. shares his view…
By ForexTime Oil benchmarks surge over 15% since Monday on supply fears Spiking energy prices…
By JustMarkets The US stock market declined sharply on Tuesday. By the end of the…
This website uses cookies.