By InvestMacro
Here are the latest charts and statistics for the Commitment of Traders (COT) data published by the Commodities Futures Trading Commission (CFTC).
The latest COT data is updated through Tuesday April 29th and shows a quick view of how large traders (for-profit speculators and commercial entities) were positioned in the futures markets.
The COT metals markets speculator bets were overall lower this week as just two out of the six metals markets we cover had higher positioning while the other four markets had lower speculator contracts.
Free Reports:
Leading the gains for the metals was Silver (5,217 contracts) with Platinum (4,285 contracts) also showing a positive week.
The markets with declines in speculator bets for the week were Gold (-12,060 contracts), Copper (-5,396 contracts), Steel (-460 contracts) and with Palladium (-75 contracts) also seeing lower bets on the week.
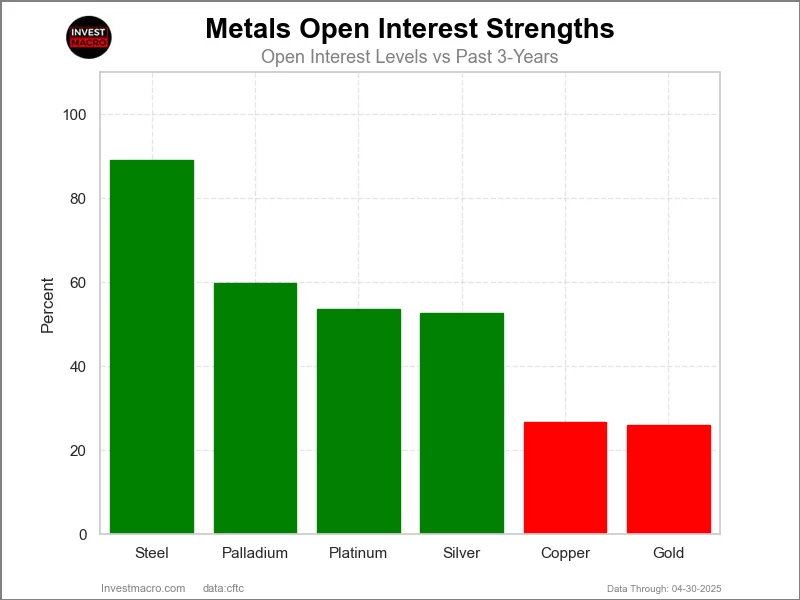
\Legend: Weekly Speculators Change | Speculators Current Net Position | Speculators Strength Score compared to last 3-Years (0-100 range)
COT Strength Scores (a normalized measure of Speculator positions over a 3-Year range, from 0 to 100 where above 80 is Extreme-Bullish and below 20 is Extreme-Bearish) showed that Steel (80 percent) and Silver (79 percent) lead the metals markets this week. Copper (51 percent) comes in as the next highest in the weekly strength scores.
On the downside, Palladium (22 percent) comes in at the lowest strength level currently.
Strength Statistics:
Gold (42.2 percent) vs Gold previous week (46.8 percent)
Silver (79.3 percent) vs Silver previous week (72.7 percent)
Copper (51.3 percent) vs Copper previous week (56.3 percent)
Platinum (39.5 percent) vs Platinum previous week (29.4 percent)
Palladium (22.5 percent) vs Palladium previous week (23.1 percent)
Steel (79.5 percent) vs Palladium previous week (81.6 percent)
COT Strength Score Trends (or move index, calculates the 6-week changes in strength scores) showed that all of the metals markets have negative trends currently. Copper (-5 percent) and Silver (-16 percent) have the lowest negative scores at the moment while Gold (-36 percent) and Platinum (-25 percent) have the most negative trends this week.
Move Statistics:
Gold (-35.9 percent) vs Gold previous week (-23.1 percent)
Silver (-15.6 percent) vs Silver previous week (-18.7 percent)
Copper (-5.4 percent) vs Copper previous week (5.7 percent)
Platinum (-24.9 percent) vs Platinum previous week (-23.8 percent)
Palladium (-18.2 percent) vs Palladium previous week (-17.5 percent)
Steel (-17.3 percent) vs Steel previous week (-15.7 percent)
This week’s current strength score (the trader positioning range over the past three years, measured from 0 to 100) shows the speculators are currently Bearish with a score of 42.2 percent. The commercials are Bullish with a score of 53.7 percent and the small traders (not shown in chart) are Bullish with a score of 73.5 percent.
Our weekly trend-following model classifies the current market price position as: Uptrend.
| Gold Futures Statistics | SPECULATORS | COMMERCIALS | SMALL TRADERS |
| – Percent of Open Interest Longs: | 53.2 | 20.5 | 11.2 |
| – Percent of Open Interest Shorts: | 17.1 | 62.8 | 5.1 |
| – Net Position: | 163,318 | -190,761 | 27,443 |
| – Gross Longs: | 240,377 | 92,787 | 50,675 |
| – Gross Shorts: | 77,059 | 283,548 | 23,232 |
| – Long to Short Ratio: | 3.1 to 1 | 0.3 to 1 | 2.2 to 1 |
| NET POSITION TREND: | |||
| – Strength Index Score (3 Year Range Pct): | 42.2 | 53.7 | 73.5 |
| – Strength Index Reading (3 Year Range): | Bearish | Bullish | Bullish |
| NET POSITION MOVEMENT INDEX: | |||
| – 6-Week Change in Strength Index: | -35.9 | 34.0 | 0.8 |
This week’s current strength score (the trader positioning range over the past three years, measured from 0 to 100) shows the speculators are currently Bullish with a score of 79.3 percent. The commercials are Bearish-Extreme with a score of 17.8 percent and the small traders (not shown in chart) are Bullish with a score of 64.2 percent.
Our weekly trend-following model classifies the current market price position as: Uptrend.
| Silver Futures Statistics | SPECULATORS | COMMERCIALS | SMALL TRADERS |
| – Percent of Open Interest Longs: | 46.0 | 27.0 | 18.7 |
| – Percent of Open Interest Shorts: | 13.3 | 72.4 | 6.0 |
| – Net Position: | 49,943 | -69,264 | 19,321 |
| – Gross Longs: | 70,299 | 41,240 | 28,535 |
| – Gross Shorts: | 20,356 | 110,504 | 9,214 |
| – Long to Short Ratio: | 3.5 to 1 | 0.4 to 1 | 3.1 to 1 |
| NET POSITION TREND: | |||
| – Strength Index Score (3 Year Range Pct): | 79.3 | 17.8 | 64.2 |
| – Strength Index Reading (3 Year Range): | Bullish | Bearish-Extreme | Bullish |
| NET POSITION MOVEMENT INDEX: | |||
| – 6-Week Change in Strength Index: | -15.6 | 13.7 | -0.2 |
This week’s current strength score (the trader positioning range over the past three years, measured from 0 to 100) shows the speculators are currently Bullish with a score of 51.3 percent. The commercials are Bullish with a score of 53.2 percent and the small traders (not shown in chart) are Bearish with a score of 21.9 percent.
Our weekly trend-following model classifies the current market price position as: Uptrend.
| Copper Futures Statistics | SPECULATORS | COMMERCIALS | SMALL TRADERS |
| – Percent of Open Interest Longs: | 37.3 | 33.0 | 7.1 |
| – Percent of Open Interest Shorts: | 27.2 | 43.5 | 6.8 |
| – Net Position: | 19,369 | -20,064 | 695 |
| – Gross Longs: | 71,612 | 63,420 | 13,700 |
| – Gross Shorts: | 52,243 | 83,484 | 13,005 |
| – Long to Short Ratio: | 1.4 to 1 | 0.8 to 1 | 1.1 to 1 |
| NET POSITION TREND: | |||
| – Strength Index Score (3 Year Range Pct): | 51.3 | 53.2 | 21.9 |
| – Strength Index Reading (3 Year Range): | Bullish | Bullish | Bearish |
| NET POSITION MOVEMENT INDEX: | |||
| – 6-Week Change in Strength Index: | -5.4 | 6.5 | -10.1 |
This week’s current strength score (the trader positioning range over the past three years, measured from 0 to 100) shows the speculators are currently Bearish with a score of 39.5 percent. The commercials are Bullish with a score of 59.7 percent and the small traders (not shown in chart) are Bearish with a score of 38.8 percent.
Our weekly trend-following model classifies the current market price position as: Uptrend.
| Platinum Futures Statistics | SPECULATORS | COMMERCIALS | SMALL TRADERS |
| – Percent of Open Interest Longs: | 59.6 | 24.1 | 11.5 |
| – Percent of Open Interest Shorts: | 46.6 | 43.4 | 5.2 |
| – Net Position: | 9,962 | -14,822 | 4,860 |
| – Gross Longs: | 45,794 | 18,493 | 8,844 |
| – Gross Shorts: | 35,832 | 33,315 | 3,984 |
| – Long to Short Ratio: | 1.3 to 1 | 0.6 to 1 | 2.2 to 1 |
| NET POSITION TREND: | |||
| – Strength Index Score (3 Year Range Pct): | 39.5 | 59.7 | 38.8 |
| – Strength Index Reading (3 Year Range): | Bearish | Bullish | Bearish |
| NET POSITION MOVEMENT INDEX: | |||
| – 6-Week Change in Strength Index: | -24.9 | 20.2 | 24.1 |
This week’s current strength score (the trader positioning range over the past three years, measured from 0 to 100) shows the speculators are currently Bearish with a score of 22.5 percent. The commercials are Bullish with a score of 73.6 percent and the small traders (not shown in chart) are Bullish with a score of 73.0 percent.
Our weekly trend-following model classifies the current market price position as: Weak Uptrend.
| Palladium Futures Statistics | SPECULATORS | COMMERCIALS | SMALL TRADERS |
| – Percent of Open Interest Longs: | 30.0 | 52.3 | 11.3 |
| – Percent of Open Interest Shorts: | 82.5 | 4.2 | 6.9 |
| – Net Position: | -10,918 | 10,001 | 917 |
| – Gross Longs: | 6,233 | 10,873 | 2,351 |
| – Gross Shorts: | 17,151 | 872 | 1,434 |
| – Long to Short Ratio: | 0.4 to 1 | 12.5 to 1 | 1.6 to 1 |
| NET POSITION TREND: | |||
| – Strength Index Score (3 Year Range Pct): | 22.5 | 73.6 | 73.0 |
| – Strength Index Reading (3 Year Range): | Bearish | Bullish | Bullish |
| NET POSITION MOVEMENT INDEX: | |||
| – 6-Week Change in Strength Index: | -18.2 | 20.1 | -9.8 |
This week’s current strength score (the trader positioning range over the past three years, measured from 0 to 100) shows the speculators are currently Bullish with a score of 79.5 percent. The commercials are Bearish with a score of 22.0 percent and the small traders (not shown in chart) are Bearish with a score of 27.1 percent.
Our weekly trend-following model classifies the current market price position as: Uptrend.
| Steel Futures Statistics | SPECULATORS | COMMERCIALS | SMALL TRADERS |
| – Percent of Open Interest Longs: | 29.1 | 64.5 | 0.5 |
| – Percent of Open Interest Shorts: | 27.4 | 66.1 | 0.6 |
| – Net Position: | 658 | -610 | -48 |
| – Gross Longs: | 11,276 | 25,030 | 186 |
| – Gross Shorts: | 10,618 | 25,640 | 234 |
| – Long to Short Ratio: | 1.1 to 1 | 1.0 to 1 | 0.8 to 1 |
| NET POSITION TREND: | |||
| – Strength Index Score (3 Year Range Pct): | 79.5 | 22.0 | 27.1 |
| – Strength Index Reading (3 Year Range): | Bullish | Bearish | Bearish |
| NET POSITION MOVEMENT INDEX: | |||
| – 6-Week Change in Strength Index: | -17.3 | 18.6 | -26.4 |
Article By InvestMacro – Receive our weekly COT Newsletter
*COT Report: The COT data, released weekly to the public each Friday, is updated through the most recent Tuesday (data is 3 days old) and shows a quick view of how large speculators or non-commercials (for-profit traders) were positioned in the futures markets.
The CFTC categorizes trader positions according to commercial hedgers (traders who use futures contracts for hedging as part of the business), non-commercials (large traders who speculate to realize trading profits) and nonreportable traders (usually small traders/speculators) as well as their open interest (contracts open in the market at time of reporting). See CFTC criteria here.
By Analytical Department RoboForex GBP/USD continued to consolidate at 1.3283 on Wednesday. The British pound…
By JustMarkets The US equity indices showed mixed performance on Tuesday. The Dow Jones (US30)…
By Pawan Jain, University of Michigan Flint Finding good financial advice can be stressful –…
Source: Stephen McBride (7/27/26) Stephen McBride of RiskHedge shares his thoughts on the potential for…
By JustMarkets The US equity indices showed mixed performance on Monday ahead of the Federal…
By Analytical Department RoboForex Gold fell to 4,047 USD per ounce on Tuesday, erasing gains…
This website uses cookies.