By InvestMacro
The latest update for the weekly Commitment of Traders (COT) report was released by the Commodity Futures Trading Commission (CFTC) on Friday for data ending on April 8th.
This weekly Extreme Positions report highlights the Most Bullish and Most Bearish Positions for the speculator category. Extreme positioning in these markets can foreshadow strong moves in the underlying market.
To signify an extreme position, we use the Strength Index (also known as the COT Index) of each instrument, a common method of measuring COT data. The Strength Index is simply a comparison of current trader positions against the range of positions over the previous 3 years. We use over 80 percent as extremely bullish and under 20 percent as extremely bearish. (Compare Strength Index scores across all markets in the data table or cot leaders table)
Free Reports:
The Japanese Yen speculator position comes in as the most bullish extreme standing this week as the Yen’s safe haven status has been in demand with the recent market turmoil. The Japanese Yen speculator level is currently at a maximum 100.0 percent score of its 3-year range.
The six-week trend change for the percent strength score totaled a gain of 15.4 this week. The overall net speculator position rose to a new all-time record high at a total of 147,067 net contracts this week with a boost of 25,293 contract in the weekly speculator bets.
Speculators or Non-Commercials Notes:
Speculators, classified as non-commercial traders by the CFTC, are made up of large commodity funds, hedge funds and other significant for-profit participants. The Specs are generally regarded as trend-followers in their behavior towards price action – net speculator bets and prices tend to go in the same directions. These traders often look to buy when prices are rising and sell when prices are falling. To illustrate this point, many times speculator contracts can be found at their most extremes (bullish or bearish) when prices are also close to their highest or lowest levels.
These extreme levels can be dangerous for the large speculators as the trade is most crowded, there is less trading ammunition still sitting on the sidelines to push the trend further and prices have moved a significant distance. When the trend becomes exhausted, some speculators take profits while others look to also exit positions when prices fail to continue in the same direction. This process usually plays out over many months to years and can ultimately create a reverse effect where prices start to fall and speculators start a process of selling when prices are falling.
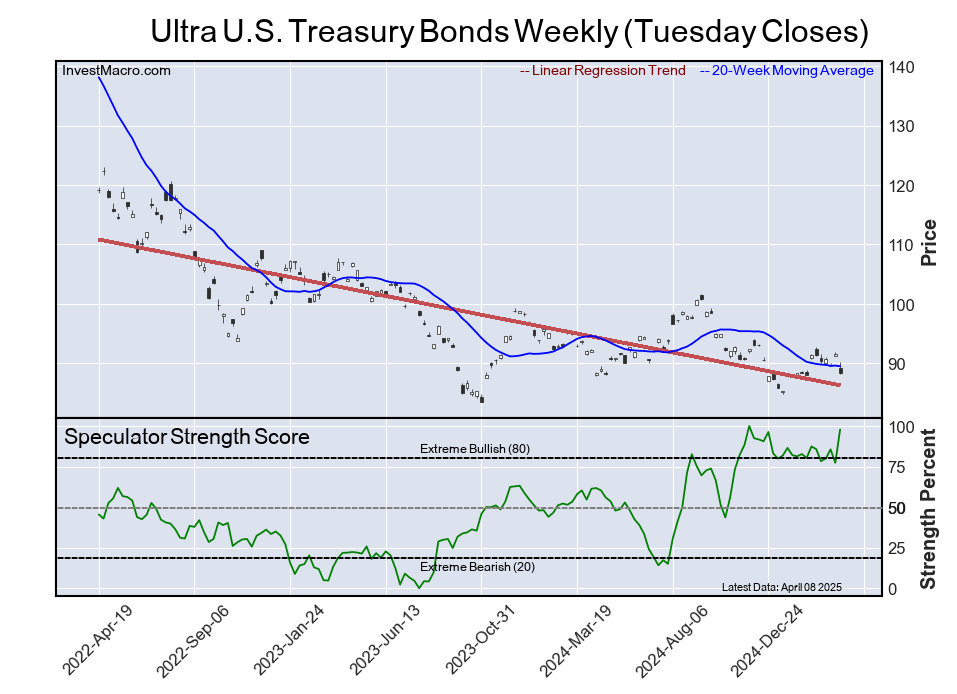
The Ultra U.S. Treasury Bonds speculator position comes next in the extreme standings this week a the Ultra U.S. Treasury Bonds speculator level is at a 97.9 percent score of its 3-year range.
The six-week trend for the percent strength score rose by 10.5 points this week. The speculator position registered -200,310 net contracts this week with a weekly gain of 53,719 contracts in speculator bets.
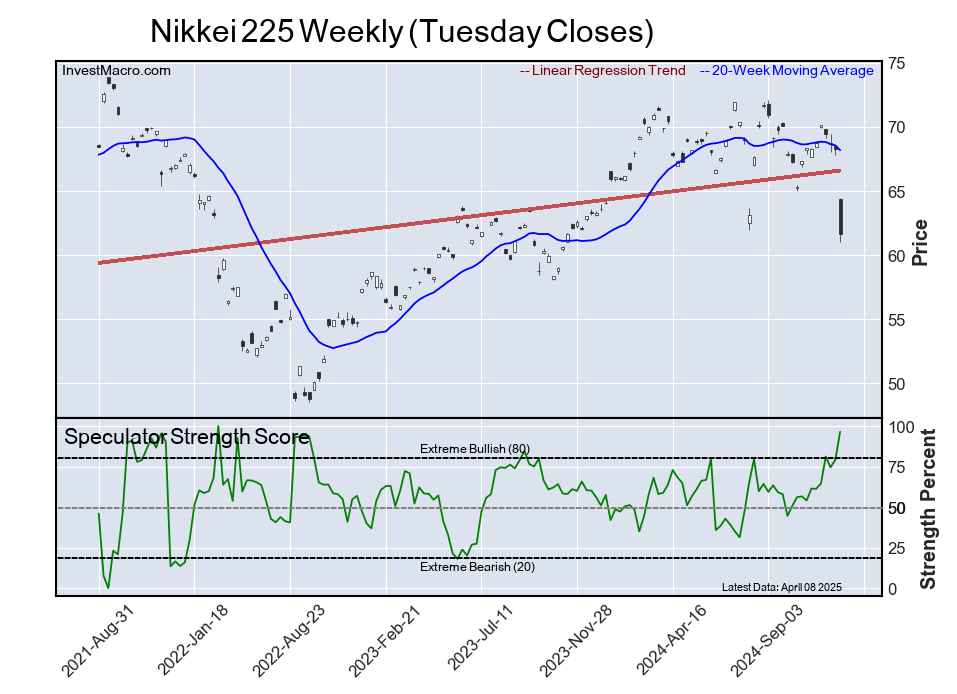
The Nikkei 225 speculator position comes in third this week in the extreme standings. The Nikkei 225 speculator level resides at a 96.4 percent score of its 3-year range.
The six-week trend for the speculator strength score increased by 35.0 this week. The overall speculator position was 1,904 net contracts this week with an increase by 2,025 contracts in the weekly speculator bets.
The Brazil Real speculator position comes up number four in the extreme standings this week as the Brazil Real speculator level is at a 95.1 percent score of its 3-year range.
The six-week trend for the speculator strength score jumped by 40.7 this week. The overall speculator position was 45,115 net contracts this week with an advance by 8,080 contracts in the speculator bets.
The Brent Oil speculator position rounds out the top five in this week’s bullish extreme standings. The Brent Oil speculator level sits at a 89.3 percent score of its 3-year range. The six-week trend for the speculator strength score was 38.5 this week.
The speculator position was -6,838 net contracts this week with a decline of -3,995 contracts in the weekly speculator bets.
The 5-Year Bond speculator position comes in as the most bearish extreme standing this week a the 5-Year Bond speculator level is at a 0.0 percent score or the lowest of its 3-year range.
The six-week trend for the speculator strength score was -20.6 this week. The overall speculator position was -2,021,575 net contracts this week with a tiny rise by 102 contracts in the speculator bets.
The WTI Crude Oil speculator position comes in next for the most bearish extreme standing on the week. The WTI Crude Oil speculator level is at just a 0.6 percent score of its 3-year range.
The six-week trend for the speculator strength score was -14.9 this week. The speculator position was 139,595 net contracts this week with a drop of -28,090 contracts in the weekly speculator bets.
The 10-Year Note speculator position comes in as third most bearish extreme standing of the week. The 10-Year Note speculator level resides at a 6.2 percent score of its 3-year range.
The six-week trend for the speculator strength score was -35.8 this week while the overall speculator position was -1,078,470 net contracts this week with a decrease by -215,207 contracts in the speculator bets.
The Wheat speculator position comes in as this week’s fourth most bearish extreme standing with the Wheat speculator level at 8.3 percent score of its 3-year range.
The six-week trend for the speculator strength score was -22.7 this week. The speculator position was -91,924 net contracts this week with a gain of 10,876 contracts in the weekly speculator bets.
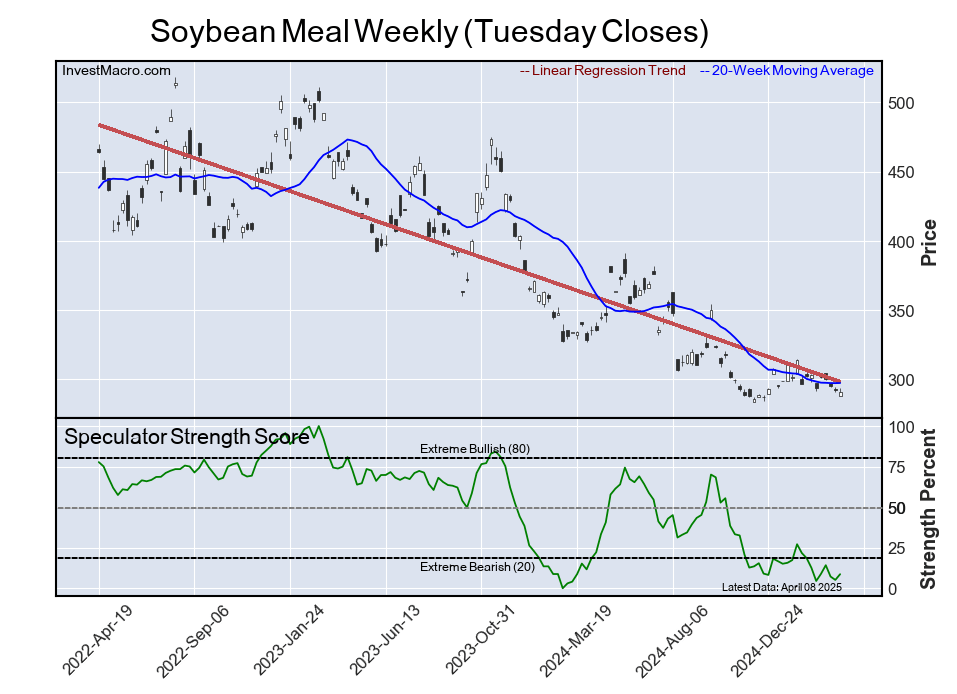
Finally, the Soybean Meal speculator position comes in as the fifth most bearish extreme standing for this week. The Soybean Meal speculator level is at a 8.7 percent score of its 3-year range.
The six-week trend for the speculator strength score was -3.9 this week. The speculator position was -45,715 net contracts this week with a rise by 8,585 contracts in the weekly speculator bets.
Article By InvestMacro – Receive our weekly COT Newsletter
*COT Report: The COT data, released weekly to the public each Friday, is updated through the most recent Tuesday (data is 3 days old) and shows a quick view of how large speculators or non-commercials (for-profit traders) were positioned in the futures markets.
The CFTC categorizes trader positions according to commercial hedgers (traders who use futures contracts for hedging as part of the business), non-commercials (large traders who speculate to realize trading profits) and nonreportable traders (usually small traders/speculators) as well as their open interest (contracts open in the market at time of reporting). See CFTC criteria here.
By ForexTime FXTM’s USDInd ↑ 2% MTD Dollar best performing G10 currency MTD Geopolitical risk…
By JustMarkets The US stock market concluded Thursday’s session in the red as the escalating…
By Analytical Department RoboForex EUR/USD is holding near 1.1620 on Friday, with the US dollar…
By JustMarkets The US stock market rose on Wednesday. By the end of the day,…
By Daniele D'Alvia, Queen Mary University of London When a conflict escalates, financial markets respond…
By Analytical Department RoboForex GBP/USD contracted to 1.3350 on Thursday, with the pound remaining under…
This website uses cookies.