By InvestMacro
Here are the latest charts and statistics for the Commitment of Traders (COT) data published by the Commodities Futures Trading Commission (CFTC).
The latest COT data is updated through Tuesday April 22nd and shows a quick view of how large traders (for-profit speculators and commercial entities) were positioned in the futures markets.
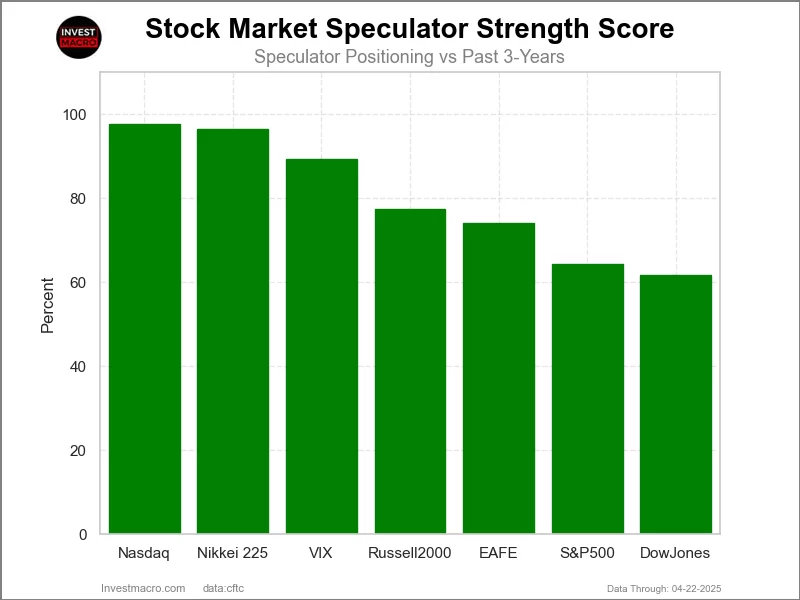
The COT stock markets speculator bets were higher this week as five out of the seven stock markets we cover had higher positioning while the other two markets had lower speculator contracts.
Free Reports:
Leading the gains for the stock markets was the MSCI EAFE-Mini (15,219 contracts) with the VIX (11,552 contracts), the Nasdaq-Mini (5,886 contracts), the Nikkei 225 (2,025 contracts) and the DowJones-Mini (646 contracts) also having positive weeks.
The markets with the declines in speculator bets this week were the S&P500-Mini (-12,838 contracts) and with the Russell-Mini (-7,398 contracts) also seeing lower bets on the week.
The lowest strength score this week was the DowJones-Mini (62 percent).
Strength Statistics:
VIX (89.4 percent) vs VIX previous week (79.1 percent)
S&P500-Mini (64.4 percent) vs S&P500-Mini previous week (66.7 percent)
DowJones-Mini (61.7 percent) vs DowJones-Mini previous week (60.7 percent)
Nasdaq-Mini (97.6 percent) vs Nasdaq-Mini previous week (88.4 percent)
Russell2000-Mini (77.4 percent) vs Russell2000-Mini previous week (82.5 percent)
Nikkei USD (96.4 percent) vs Nikkei USD previous week (79.1 percent)
EAFE-Mini (74.0 percent) vs EAFE-Mini previous week (52.8 percent)
The S&P500-Mini (-28 percent) leads the downside trend scores currently with the MSCI EAFE-Mini (-26 percent) coming in as the next market with lower trend scores.
Strength Trend Statistics:
VIX (10.8 percent) vs VIX previous week (20.4 percent)
S&P500-Mini (-28.2 percent) vs S&P500-Mini previous week (-17.1 percent)
DowJones-Mini (-1.9 percent) vs DowJones-Mini previous week (-1.4 percent)
Nasdaq-Mini (23.2 percent) vs Nasdaq-Mini previous week (15.5 percent)
Russell2000-Mini (-1.1 percent) vs Russell2000-Mini previous week (3.6 percent)
Nikkei USD (35.0 percent) vs Nikkei USD previous week (25.1 percent)
EAFE-Mini (-26.0 percent) vs EAFE-Mini previous week (-20.1 percent)
This week’s current strength score (the trader positioning range over the past three years, measured from 0 to 100) shows the speculators are currently Bullish-Extreme with a score of 89.4 percent. The commercials are Bearish-Extreme with a score of 10.5 percent and the small traders (not shown in chart) are Bullish-Extreme with a score of 81.5 percent.
Our weekly trend-following model classifies the current market price position as: Uptrend.
| VIX Volatility Futures Statistics | SPECULATORS | COMMERCIALS | SMALL TRADERS |
| – Percent of Open Interest Longs: | 28.7 | 43.9 | 10.3 |
| – Percent of Open Interest Shorts: | 30.9 | 42.8 | 9.3 |
| – Net Position: | -5,745 | 3,019 | 2,726 |
| – Gross Longs: | 78,508 | 119,924 | 28,192 |
| – Gross Shorts: | 84,253 | 116,905 | 25,466 |
| – Long to Short Ratio: | 0.9 to 1 | 1.0 to 1 | 1.1 to 1 |
| NET POSITION TREND: | |||
| – Strength Index Score (3 Year Range Pct): | 89.4 | 10.5 | 81.5 |
| – Strength Index Reading (3 Year Range): | Bullish-Extreme | Bearish-Extreme | Bullish-Extreme |
| NET POSITION MOVEMENT INDEX: | |||
| – 6-Week Change in Strength Index: | 10.8 | -14.0 | 23.4 |
This week’s current strength score (the trader positioning range over the past three years, measured from 0 to 100) shows the speculators are currently Bullish with a score of 64.4 percent. The commercials are Bearish with a score of 40.3 percent and the small traders (not shown in chart) are Bullish with a score of 53.0 percent.
Our weekly trend-following model classifies the current market price position as: Downtrend.
| S&P500 Mini Futures Statistics | SPECULATORS | COMMERCIALS | SMALL TRADERS |
| – Percent of Open Interest Longs: | 11.8 | 74.5 | 10.7 |
| – Percent of Open Interest Shorts: | 15.2 | 72.9 | 8.9 |
| – Net Position: | -75,935 | 36,396 | 39,539 |
| – Gross Longs: | 260,930 | 1,646,290 | 236,445 |
| – Gross Shorts: | 336,865 | 1,609,894 | 196,906 |
| – Long to Short Ratio: | 0.8 to 1 | 1.0 to 1 | 1.2 to 1 |
| NET POSITION TREND: | |||
| – Strength Index Score (3 Year Range Pct): | 64.4 | 40.3 | 53.0 |
| – Strength Index Reading (3 Year Range): | Bullish | Bearish | Bullish |
| NET POSITION MOVEMENT INDEX: | |||
| – 6-Week Change in Strength Index: | -28.2 | 38.0 | -38.7 |
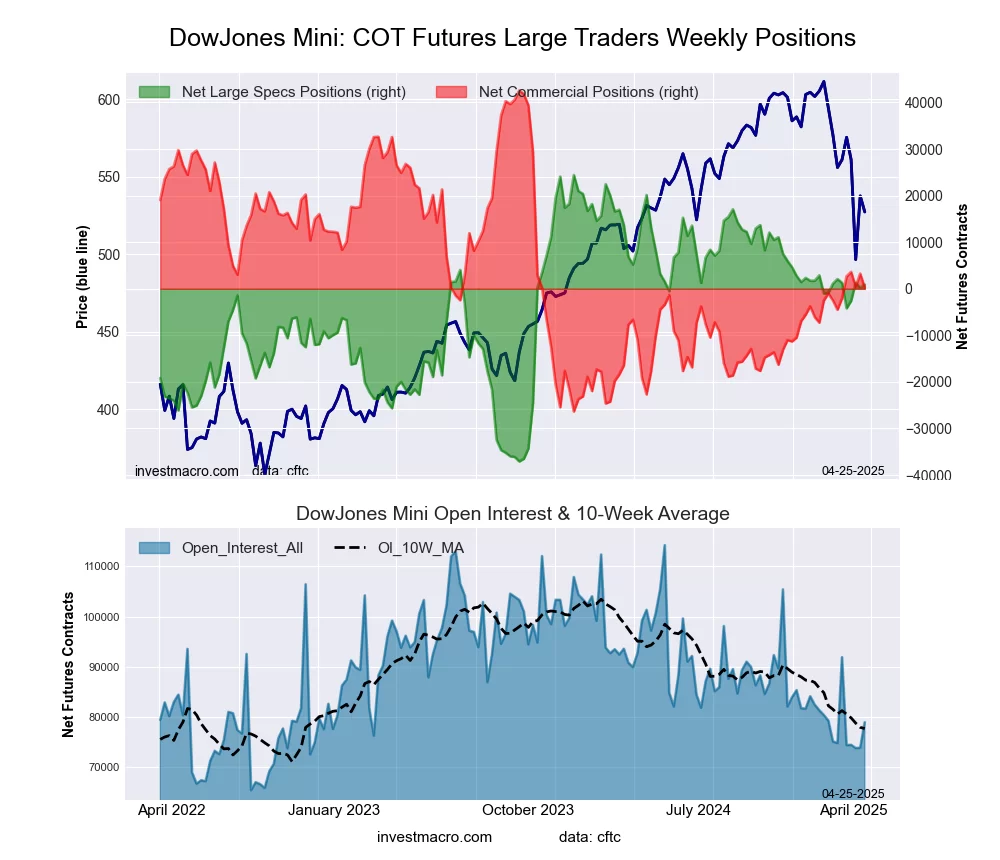
This week’s current strength score (the trader positioning range over the past three years, measured from 0 to 100) shows the speculators are currently Bullish with a score of 61.7 percent. The commercials are Bearish with a score of 38.6 percent and the small traders (not shown in chart) are Bearish with a score of 47.2 percent.
Our weekly trend-following model classifies the current market price position as: Downtrend.
| Dow Jones Mini Futures Statistics | SPECULATORS | COMMERCIALS | SMALL TRADERS |
| – Percent of Open Interest Longs: | 12.2 | 66.2 | 12.2 |
| – Percent of Open Interest Shorts: | 11.1 | 66.0 | 13.6 |
| – Net Position: | 887 | 217 | -1,104 |
| – Gross Longs: | 9,623 | 52,324 | 9,616 |
| – Gross Shorts: | 8,736 | 52,107 | 10,720 |
| – Long to Short Ratio: | 1.1 to 1 | 1.0 to 1 | 0.9 to 1 |
| NET POSITION TREND: | |||
| – Strength Index Score (3 Year Range Pct): | 61.7 | 38.6 | 47.2 |
| – Strength Index Reading (3 Year Range): | Bullish | Bearish | Bearish |
| NET POSITION MOVEMENT INDEX: | |||
| – 6-Week Change in Strength Index: | -1.9 | 6.8 | -21.0 |
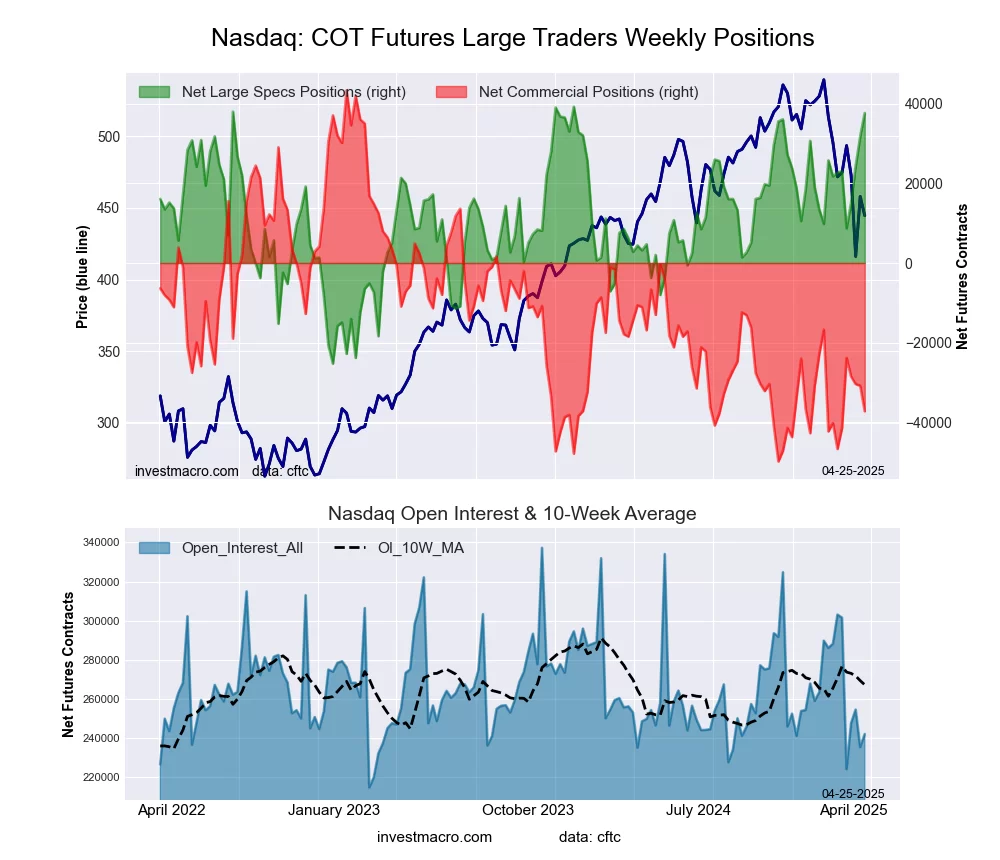
This week’s current strength score (the trader positioning range over the past three years, measured from 0 to 100) shows the speculators are currently Bullish-Extreme with a score of 97.6 percent. The commercials are Bearish-Extreme with a score of 13.5 percent and the small traders (not shown in chart) are Bullish with a score of 53.5 percent.
Our weekly trend-following model classifies the current market price position as: Downtrend.
| Nasdaq Mini Futures Statistics | SPECULATORS | COMMERCIALS | SMALL TRADERS |
| – Percent of Open Interest Longs: | 31.7 | 53.4 | 13.8 |
| – Percent of Open Interest Shorts: | 16.1 | 68.8 | 14.0 |
| – Net Position: | 37,680 | -37,245 | -435 |
| – Gross Longs: | 76,663 | 129,366 | 33,405 |
| – Gross Shorts: | 38,983 | 166,611 | 33,840 |
| – Long to Short Ratio: | 2.0 to 1 | 0.8 to 1 | 1.0 to 1 |
| NET POSITION TREND: | |||
| – Strength Index Score (3 Year Range Pct): | 97.6 | 13.5 | 53.5 |
| – Strength Index Reading (3 Year Range): | Bullish-Extreme | Bearish-Extreme | Bullish |
| NET POSITION MOVEMENT INDEX: | |||
| – 6-Week Change in Strength Index: | 23.2 | 10.2 | -46.5 |
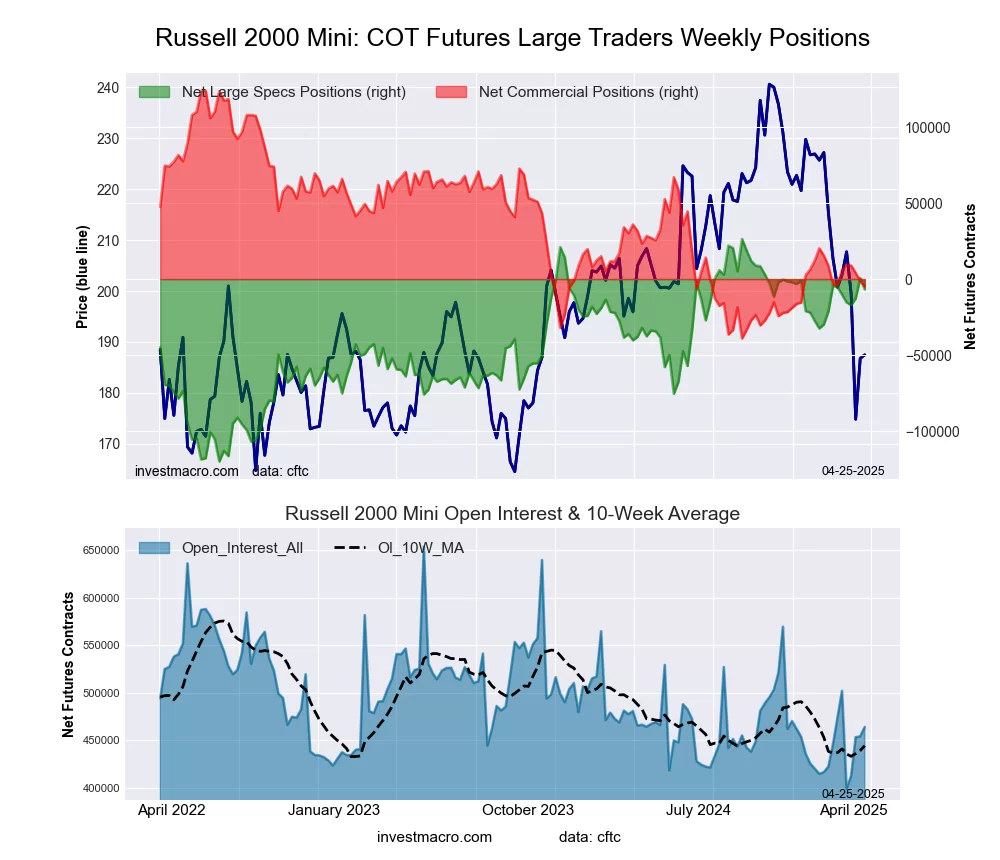
This week’s current strength score (the trader positioning range over the past three years, measured from 0 to 100) shows the speculators are currently Bullish with a score of 77.4 percent. The commercials are Bearish with a score of 21.0 percent and the small traders (not shown in chart) are Bullish with a score of 56.9 percent.
Our weekly trend-following model classifies the current market price position as: Downtrend.
| Russell 2000 Mini Futures Statistics | SPECULATORS | COMMERCIALS | SMALL TRADERS |
| – Percent of Open Interest Longs: | 17.9 | 72.0 | 8.2 |
| – Percent of Open Interest Shorts: | 19.4 | 73.1 | 5.8 |
| – Net Position: | -6,719 | -4,795 | 11,514 |
| – Gross Longs: | 83,303 | 334,265 | 38,247 |
| – Gross Shorts: | 90,022 | 339,060 | 26,733 |
| – Long to Short Ratio: | 0.9 to 1 | 1.0 to 1 | 1.4 to 1 |
| NET POSITION TREND: | |||
| – Strength Index Score (3 Year Range Pct): | 77.4 | 21.0 | 56.9 |
| – Strength Index Reading (3 Year Range): | Bullish | Bearish | Bullish |
| NET POSITION MOVEMENT INDEX: | |||
| – 6-Week Change in Strength Index: | -1.1 | -0.6 | 7.2 |
This week’s current strength score (the trader positioning range over the past three years, measured from 0 to 100) shows the speculators are currently Bullish-Extreme with a score of 96.4 percent. The commercials are Bearish-Extreme with a score of 15.4 percent and the small traders (not shown in chart) are Bearish with a score of 37.1 percent.
Our weekly trend-following model classifies the current market price position as: Downtrend.
| Nikkei Stock Average Futures Statistics | SPECULATORS | COMMERCIALS | SMALL TRADERS |
| – Percent of Open Interest Longs: | 20.3 | 60.5 | 19.2 |
| – Percent of Open Interest Shorts: | 2.5 | 75.4 | 22.1 |
| – Net Position: | 1,904 | -1,590 | -314 |
| – Gross Longs: | 2,169 | 6,480 | 2,056 |
| – Gross Shorts: | 265 | 8,070 | 2,370 |
| – Long to Short Ratio: | 8.2 to 1 | 0.8 to 1 | 0.9 to 1 |
| NET POSITION TREND: | |||
| – Strength Index Score (3 Year Range Pct): | 96.4 | 15.4 | 37.1 |
| – Strength Index Reading (3 Year Range): | Bullish-Extreme | Bearish-Extreme | Bearish |
| NET POSITION MOVEMENT INDEX: | |||
| – 6-Week Change in Strength Index: | 35.0 | -26.7 | -5.5 |
This week’s current strength score (the trader positioning range over the past three years, measured from 0 to 100) shows the speculators are currently Bullish with a score of 74.0 percent. The commercials are Bearish with a score of 34.5 percent and the small traders (not shown in chart) are Bearish with a score of 37.9 percent.
Our weekly trend-following model classifies the current market price position as: Strong Uptrend.
| MSCI EAFE Mini Futures Statistics | SPECULATORS | COMMERCIALS | SMALL TRADERS |
| – Percent of Open Interest Longs: | 9.0 | 88.4 | 2.2 |
| – Percent of Open Interest Shorts: | 11.4 | 87.0 | 1.3 |
| – Net Position: | -11,050 | 6,859 | 4,191 |
| – Gross Longs: | 41,995 | 412,914 | 10,383 |
| – Gross Shorts: | 53,045 | 406,055 | 6,192 |
| – Long to Short Ratio: | 0.8 to 1 | 1.0 to 1 | 1.7 to 1 |
| NET POSITION TREND: | |||
| – Strength Index Score (3 Year Range Pct): | 74.0 | 34.5 | 37.9 |
| – Strength Index Reading (3 Year Range): | Bullish | Bearish | Bearish |
| NET POSITION MOVEMENT INDEX: | |||
| – 6-Week Change in Strength Index: | -26.0 | 25.9 | -14.5 |
Article By InvestMacro – Receive our weekly COT Newsletter
*COT Report: The COT data, released weekly to the public each Friday, is updated through the most recent Tuesday (data is 3 days old) and shows a quick view of how large speculators or non-commercials (for-profit traders) were positioned in the futures markets.
The CFTC categorizes trader positions according to commercial hedgers (traders who use futures contracts for hedging as part of the business), non-commercials (large traders who speculate to realize trading profits) and nonreportable traders (usually small traders/speculators) as well as their open interest (contracts open in the market at time of reporting). See CFTC criteria here.
By JustMarkets The US stock market rose on Wednesday. By the end of the day,…
By Daniele D'Alvia, Queen Mary University of London When a conflict escalates, financial markets respond…
By Analytical Department RoboForex GBP/USD contracted to 1.3350 on Thursday, with the pound remaining under…
Opinion -- Source: Michael Ballanger (3/2/26) Michael Ballanger of GGM Advisory Inc. shares his view…
By ForexTime Oil benchmarks surge over 15% since Monday on supply fears Spiking energy prices…
By JustMarkets The US stock market declined sharply on Tuesday. By the end of the…
This website uses cookies.