By RoboForex Analytical Department
The New Zealand dollar continues its ascent for the second consecutive session against the US dollar, resulting in the NZD/USD pair climbing to 0.6125. This increase is attributed to recent US economic data indicating slower-than-expected growth in Q1, suggesting the possibility of an interest rate cut by the end of the year.
The market is now focused on the upcoming release of the US Core Personal Consumption Expenditures (Core PCE) report, a pivotal inflation measure for the Federal Reserve. The report’s outcome could offer further insights into the Fed’s future actions.
Meanwhile, the New Zealand government has unveiled its annual budget report, which includes modest tax relief and spending cuts due to subdued economic growth. Other concerns for the economy include rising unemployment and a weak trade balance.
Today’s speech by the Reserve Bank of New Zealand (RBNZ) Governor is highly anticipated, particularly following the central bank’s recent policy meeting.
Technical analysis of NZD/USD
Free Reports:
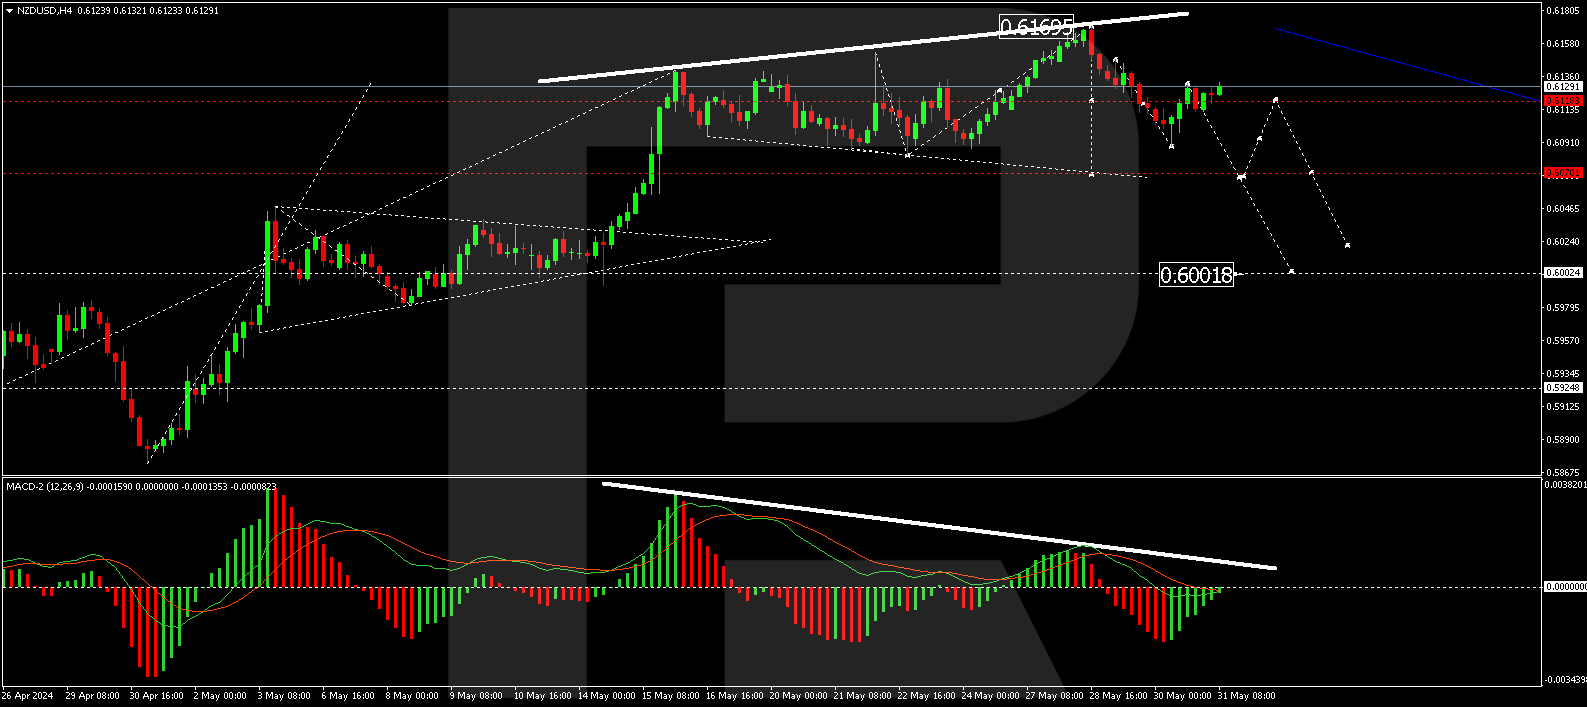
The NZD/USD pair is developing within a wide consolidation range around 0.6136. A downward impulse to 0.6088 has been observed. Today, the market might see a corrective move to 0.6137 (testing from below). Following this correction, a new decline to 0.6070 is anticipated, with a potential breakdown of this level leading to a further decrease to 0.6002. The bearish scenario is technically supported by the MACD indicator, whose signal line is below zero and directed downwards. Notably, there is a significant divergence between the peaks on the chart and the indicator, which traders should monitor closely.
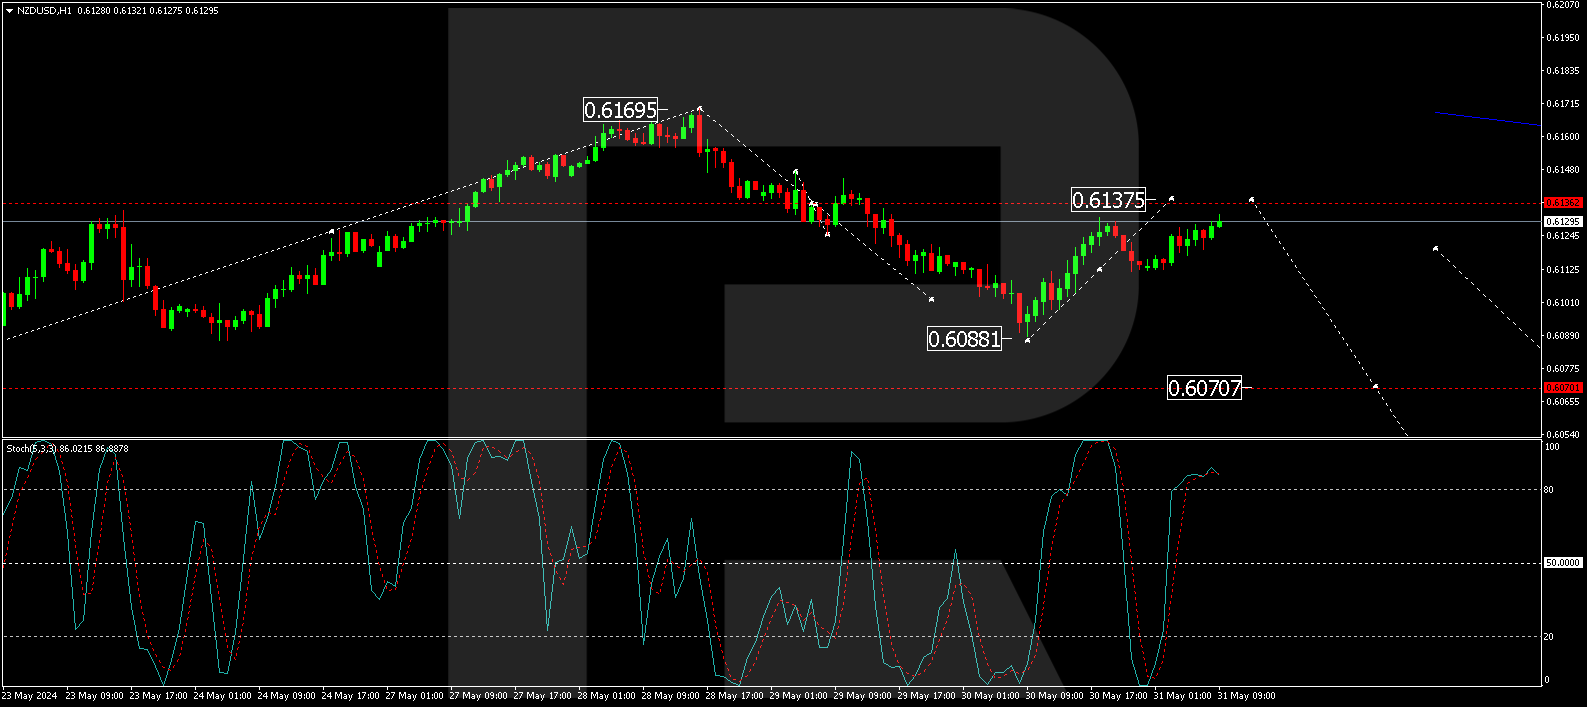
On the H1 chart, after forming a downward impulse to 0.6088, a correction to 0.6137 may occur today. Upon its completion, a new downward wave to 0.6075 is expected, with a potential continuation to 0.6000. This target is the first one in the expected downward trend. The technical setup is confirmed by the Stochastic oscillator, whose signal line is currently above 80 but is pointing sharply downwards, indicating the potential for a decline.
Summary
The NZD/USD pair’s upward movement directly reflects recent US economic data and the market’s expectations of potential Fed policy adjustments. Technical indicators suggest possible short-term corrections followed by further declines, providing critical levels for traders to watch as market conditions evolve. Today’s speech by the RBNZ Governor could introduce volatility to the trading session, further impacting the currency’s movement.
Disclaimer
Any forecasts contained herein are based on the author’s particular opinion. This analysis may not be treated as trading advice. RoboForex bears no responsibility for trading results based on trading recommendations and reviews contained herein.
By JustMarkets The US stock indices ended Friday’s session in the red. By the end…
By Analytical Department RoboForex USD/JPY opens the week at 162.36 on Monday. The Japanese yen…
By InvestMacro Here are the latest charts and statistics for the Commitment of Traders (COT)…
By InvestMacro The latest update for the weekly Commitment of Traders (COT) report was released…
By InvestMacro Here are the latest charts and statistics for the Commitment of Traders (COT)…
By InvestMacro Here are the latest charts and statistics for the Commitment of Traders (COT)…
This website uses cookies.