By RoboForex Analytical Department
The EUR/USD pair has experienced a notable decline, currently stabilising around 1.0648. Last week, the pair recorded its most significant weekly gain since 2022, fuelled by the anticipation of persistently high interest rates in the US and escalated conflicts in the Middle East.
The US dollar appreciated by 1.6% over the week against a basket of six major currencies, reaching another 34-year high against the Japanese yen and experiencing its most substantial weekly increase against the British pound since July 2023.
Recent US inflation data and the Federal Reserve’s cautious stance have tempered expectations for substantial interest rate cuts this year. Initially, six cuts were anticipated at the start of the year, reduced to three in early April, and now just two cuts are forecasted. In contrast, European monetary authorities have hinted at potential rate cuts within the coming months.
Market expectations for the first Fed rate cut have shifted from June to September, reflecting ongoing concerns about inflation and uncertainty about whether the economic environment will support easing monetary policies soon. Additionally, the disputes in the Middle East have bolstered the safe-haven appeal of the US dollar, further supporting its strength.
EUR/USD technical analysis
Free Reports:
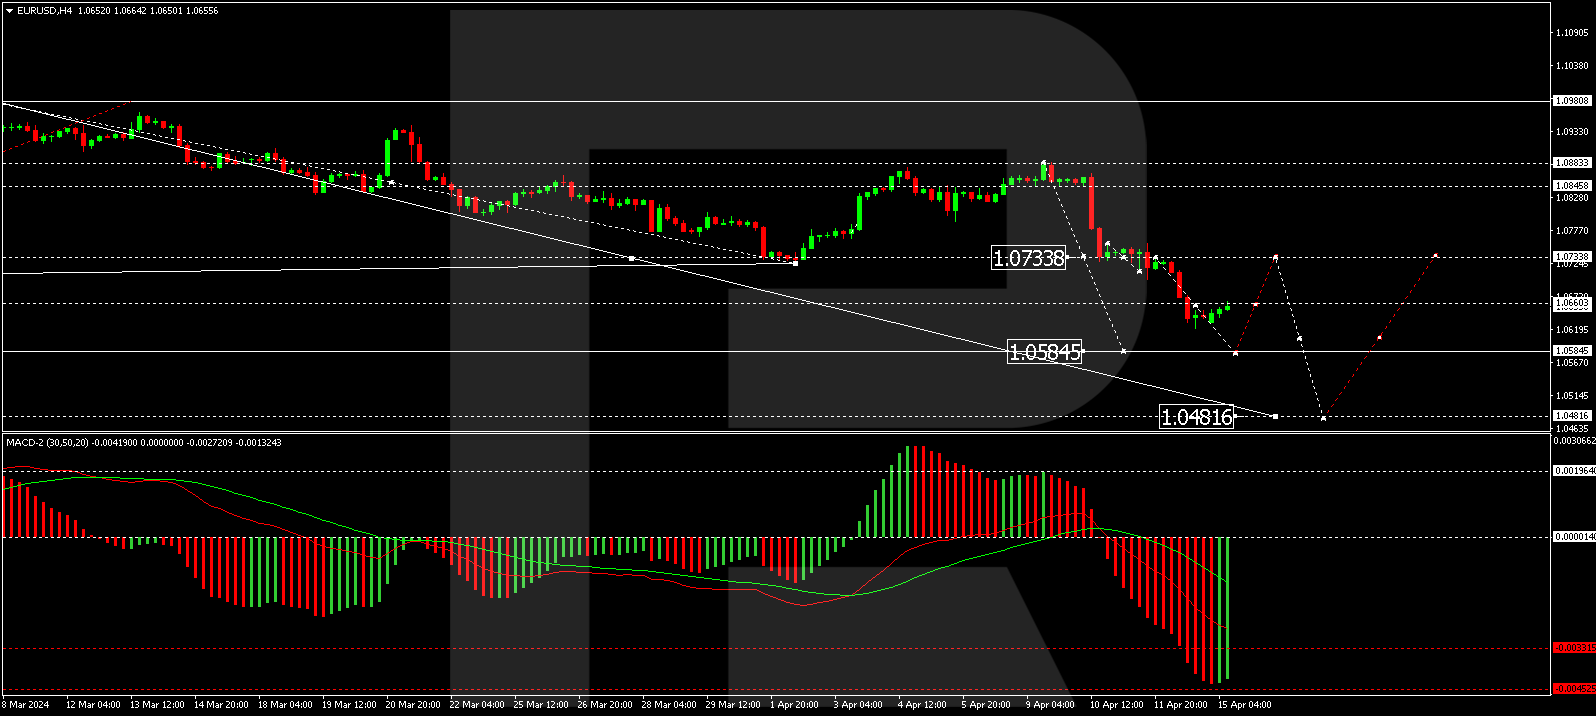
On the H4 chart of EUR/USD, the pair formed a consolidation range around 1.0733 before beginning a downward wave to 1.0622. A new consolidation range is currently forming above this level. An upward exit from this range could lead to a corrective move towards 1.0733. Conversely, a downward exit might signal a continuation of the decline to 1.0585. The MACD indicator, with its signal line below zero and directed downwards, supports this bearish scenario.
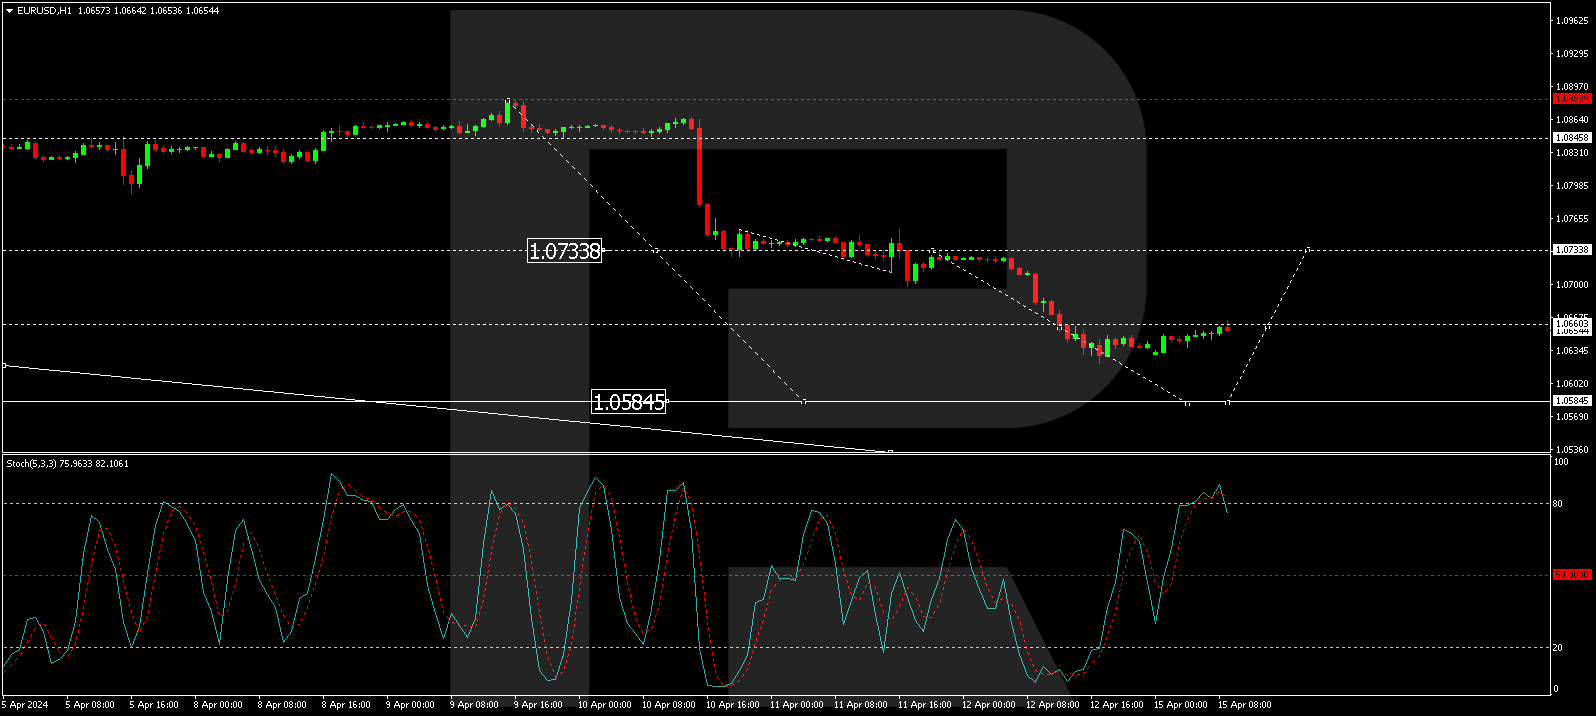
The H1 chart shows ongoing development in the downward wave towards 1.0585. After completing a rise to 1.0622, the market is currently correcting to 1.0660. Following this correction, a further decline to 1.0585 is anticipated. This bearish outlook is confirmed by the Stochastic oscillator, currently above 80, with an expected fall to the 20 mark, indicating potential for further declines.
Disclaimer
Any forecasts contained herein are based on the author’s particular opinion. This analysis may not be treated as trading advice. RoboForex bears no responsibility for trading results based on trading recommendations and reviews contained herein.
By JustMarkets The US stock indices ended Friday’s session in the red. By the end…
By Analytical Department RoboForex USD/JPY opens the week at 162.36 on Monday. The Japanese yen…
By InvestMacro Here are the latest charts and statistics for the Commitment of Traders (COT)…
By InvestMacro The latest update for the weekly Commitment of Traders (COT) report was released…
By InvestMacro Here are the latest charts and statistics for the Commitment of Traders (COT)…
By InvestMacro Here are the latest charts and statistics for the Commitment of Traders (COT)…
This website uses cookies.