By InvestMacro
Here are the latest charts and statistics for the Commitment of Traders (COT) reports data published by the Commodities Futures Trading Commission (CFTC).
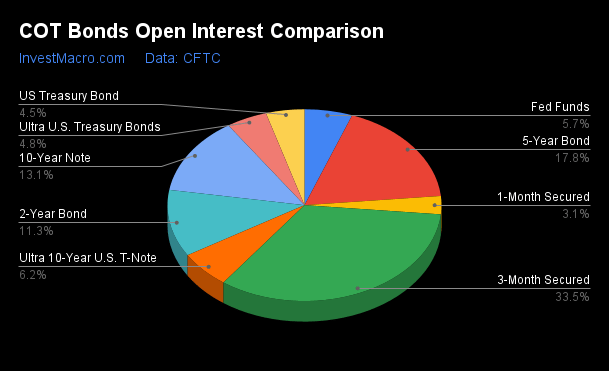
The latest COT data is updated through Tuesday March 19th and shows a quick view of how large traders (for-profit speculators and commercial hedgers) were positioned in the futures markets.
The COT bond market speculator bets were higher this week as six out of the eight bond markets we cover had higher positioning while the other two markets had lower speculator contracts.
Free Reports:
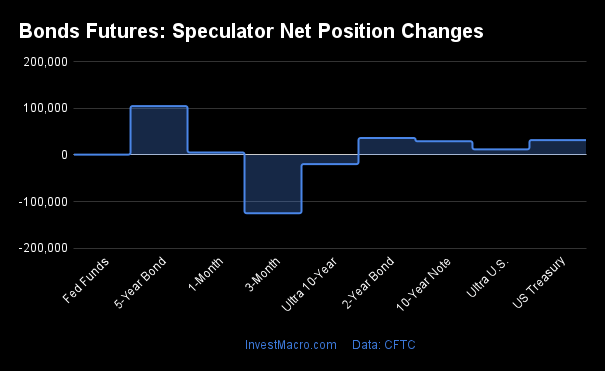
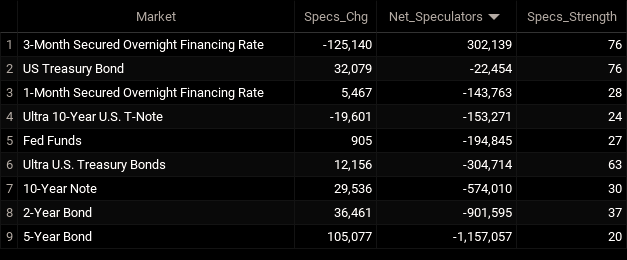
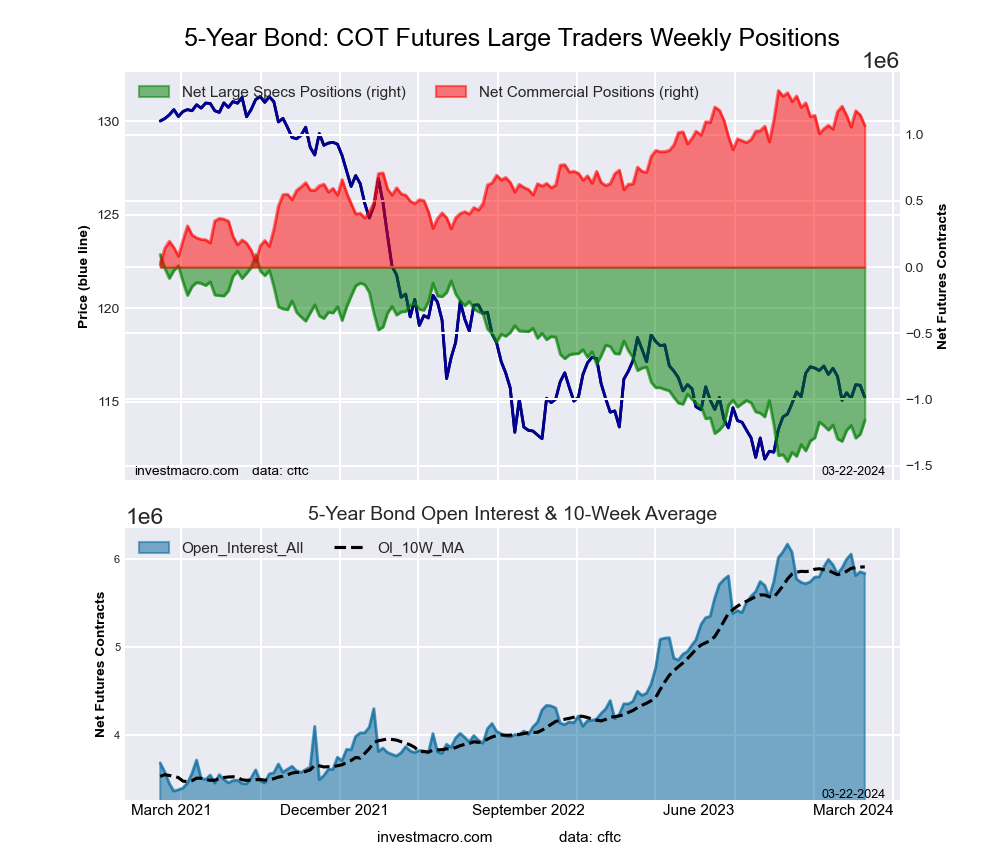
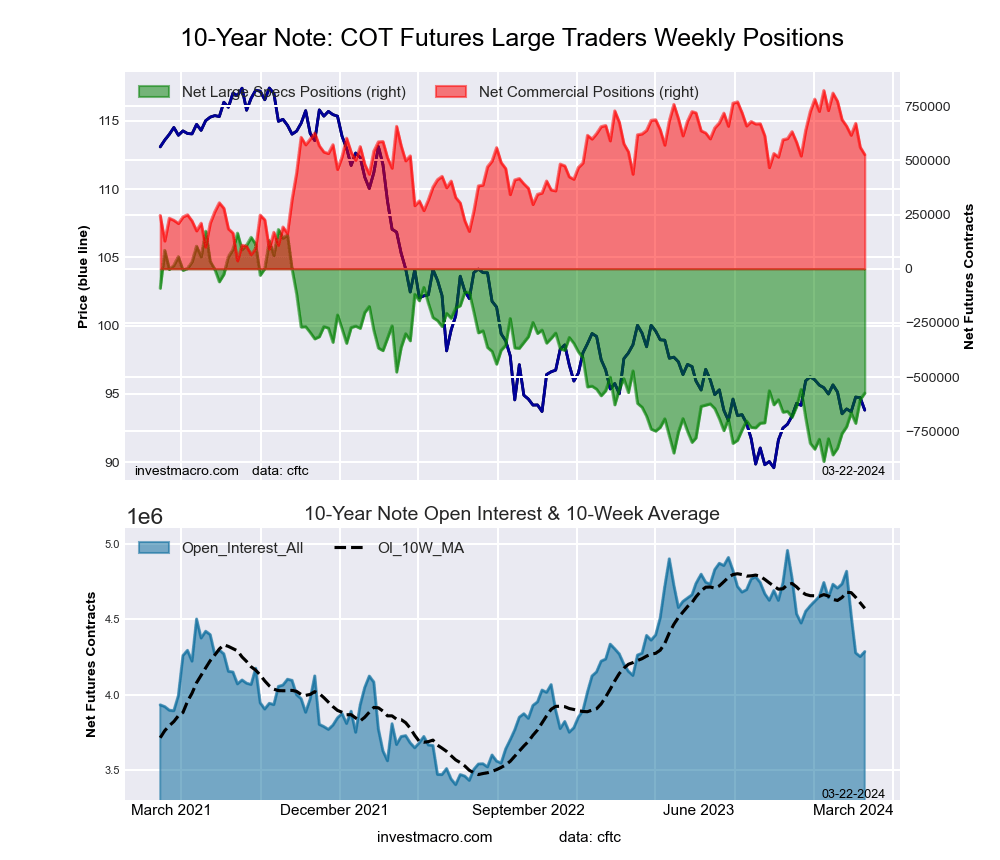
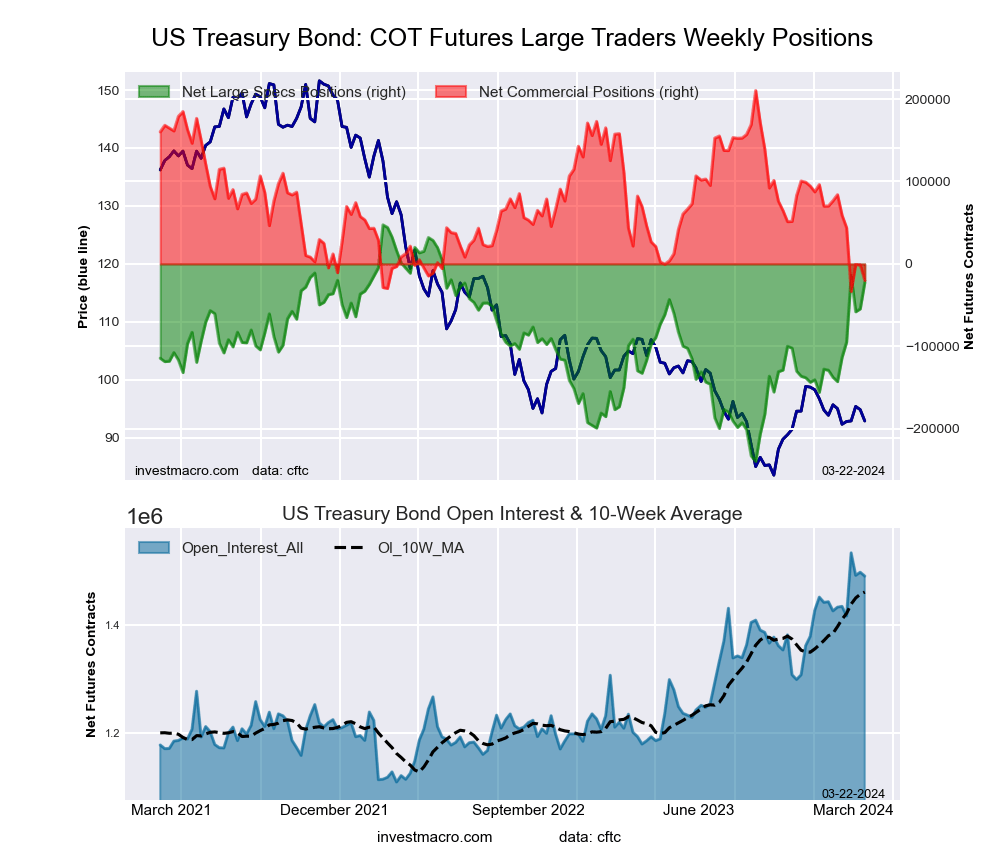
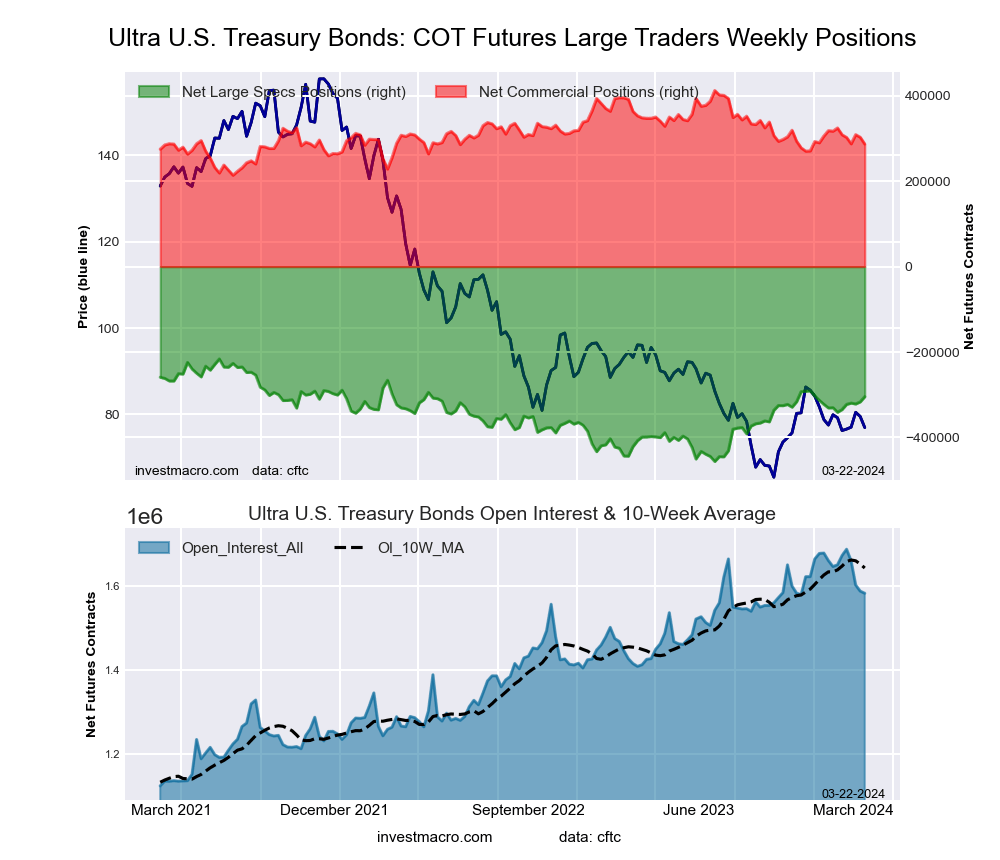
Leading the gains for the bond markets was the 5-Year Bonds (105,077 contracts), the 2-Year Bonds (36,461 contracts), the US Treasury Bonds (32,079 contracts), the 10-Year Bonds (29,536 contracts), the Ultra Treasury Bonds (12,156 contracts) and the Fed Funds (905 contracts) also showing positive weeks.
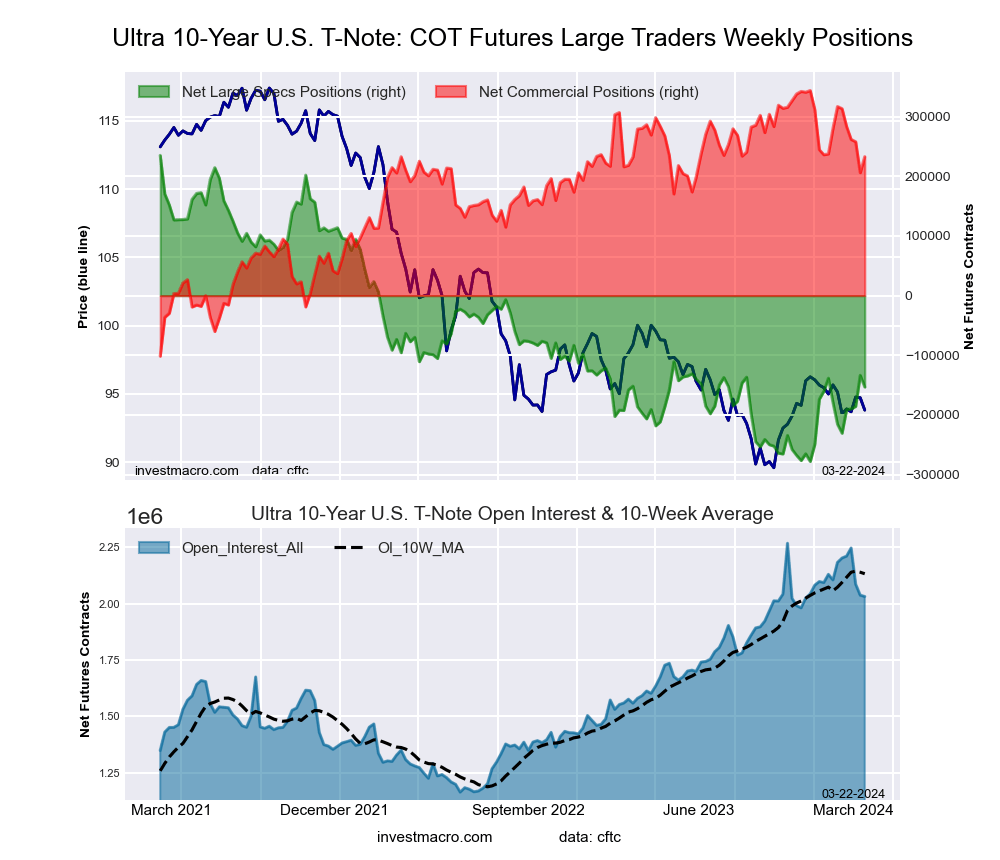
The bond markets with declines in speculator bets for the week were the SOFR 3-Months (-125,140 contracts) and the Ultra 10-Year Bonds (-19,601 contracts).
Legend: Weekly Speculators Change | Speculators Current Net Position | Speculators Strength Score compared to last 3-Years (0-100 range)
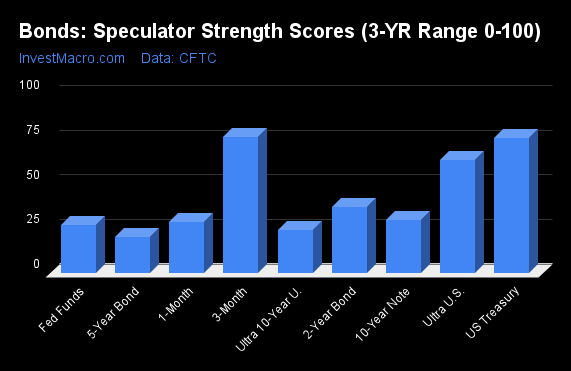
COT Strength Scores (a normalized measure of Speculator positions over a 3-Year range, from 0 to 100 where above 80 is Extreme-Bullish and below 20 is Extreme-Bearish) showed that the US Treasury Bonds (76 percent) and the SOFR 3-Months (76 percent) lead the bond markets this week. The Ultra Treasury Bonds (63 percent) comes in as the next highest in the weekly strength scores.
On the downside, the 5-Year Bonds (20 percent) and the Ultra 10-Year Bonds (24 percent) come in at the lowest strength level currently. The next lowest strength scores were the Fed Funds (27 percent) and the 10-Year Bonds (29 percent).
Strength Statistics:
Fed Funds (26.9 percent) vs Fed Funds previous week (26.7 percent)
2-Year Bond (36.7 percent) vs 2-Year Bond previous week (34.4 percent)
5-Year Bond (19.9 percent) vs 5-Year Bond previous week (13.2 percent)
10-Year Bond (29.5 percent) vs 10-Year Bond previous week (26.7 percent)
Ultra 10-Year Bond (24.3 percent) vs Ultra 10-Year Bond previous week (28.1 percent)
US Treasury Bond (75.7 percent) vs US Treasury Bond previous week (64.5 percent)
Ultra US Treasury Bond (63.2 percent) vs Ultra US Treasury Bond previous week (58.1 percent)
SOFR 3-Months (75.9 percent) vs SOFR 3-Months previous week (82.3 percent)
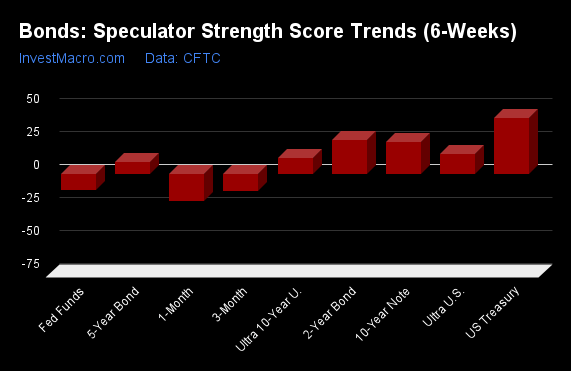
COT Strength Score Trends (or move index, calculates the 6-week changes in strength scores) showed that the US Treasury Bonds (42 percent) and the 2-Year Bonds (26 percent) lead the past six weeks trends for bonds. The 10-Year Bonds (24 percent) are the next highest positive movers in the latest trends data.
The SOFR 3-Months (-13 percent) and the Fed Funds (-13 percent) leads the downside currently with negative trend scores.
Strength Trend Statistics:
Fed Funds (-12.6 percent) vs Fed Funds previous week (-8.5 percent)
2-Year Bond (25.8 percent) vs 2-Year Bond previous week (23.6 percent)
5-Year Bond (9.0 percent) vs 5-Year Bond previous week (-4.4 percent)
10-Year Bond (23.8 percent) vs 10-Year Bond previous week (23.9 percent)
Ultra 10-Year Bond (12.2 percent) vs Ultra 10-Year Bond previous week (8.9 percent)
US Treasury Bond (41.9 percent) vs US Treasury Bond previous week (28.9 percent)
Ultra US Treasury Bond (15.2 percent) vs Ultra US Treasury Bond previous week (5.7 percent)
SOFR 3-Months (-13.1 percent) vs SOFR 3-Months previous week (-14.4 percent)
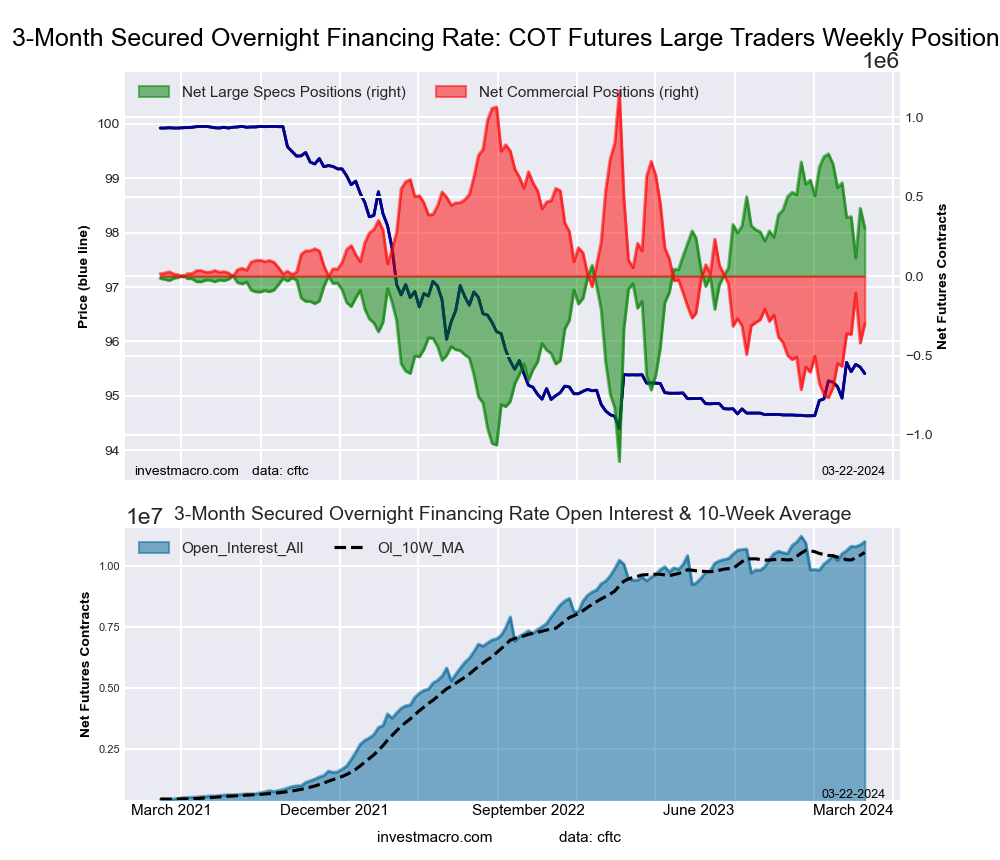
This week’s current strength score (the trader positioning range over the past three years, measured from 0 to 100) shows the speculators are currently Bullish with a score of 75.9 percent. The commercials are Bearish with a score of 24.1 percent and the small traders (not shown in chart) are Bullish-Extreme with a score of 85.9 percent.
Our weekly trend-following model classifies the current market price position as: Weak Uptrend. The current action for the model is considered to be: Hold – Maintain Long Position.
| SOFR 3-Months Statistics | SPECULATORS | COMMERCIALS | SMALL TRADERS |
| – Percent of Open Interest Longs: | 17.3 | 56.3 | 0.3 |
| – Percent of Open Interest Shorts: | 14.5 | 59.1 | 0.3 |
| – Net Position: | 302,139 | -298,573 | -3,566 |
| – Gross Longs: | 1,899,123 | 6,195,531 | 28,551 |
| – Gross Shorts: | 1,596,984 | 6,494,104 | 32,117 |
| – Long to Short Ratio: | 1.2 to 1 | 1.0 to 1 | 0.9 to 1 |
| NET POSITION TREND: | |||
| – Strength Index Score (3 Year Range Pct): | 75.9 | 24.1 | 85.9 |
| – Strength Index Reading (3 Year Range): | Bullish | Bearish | Bullish-Extreme |
| NET POSITION MOVEMENT INDEX: | |||
| – 6-Week Change in Strength Index: | -13.1 | 13.0 | 1.6 |
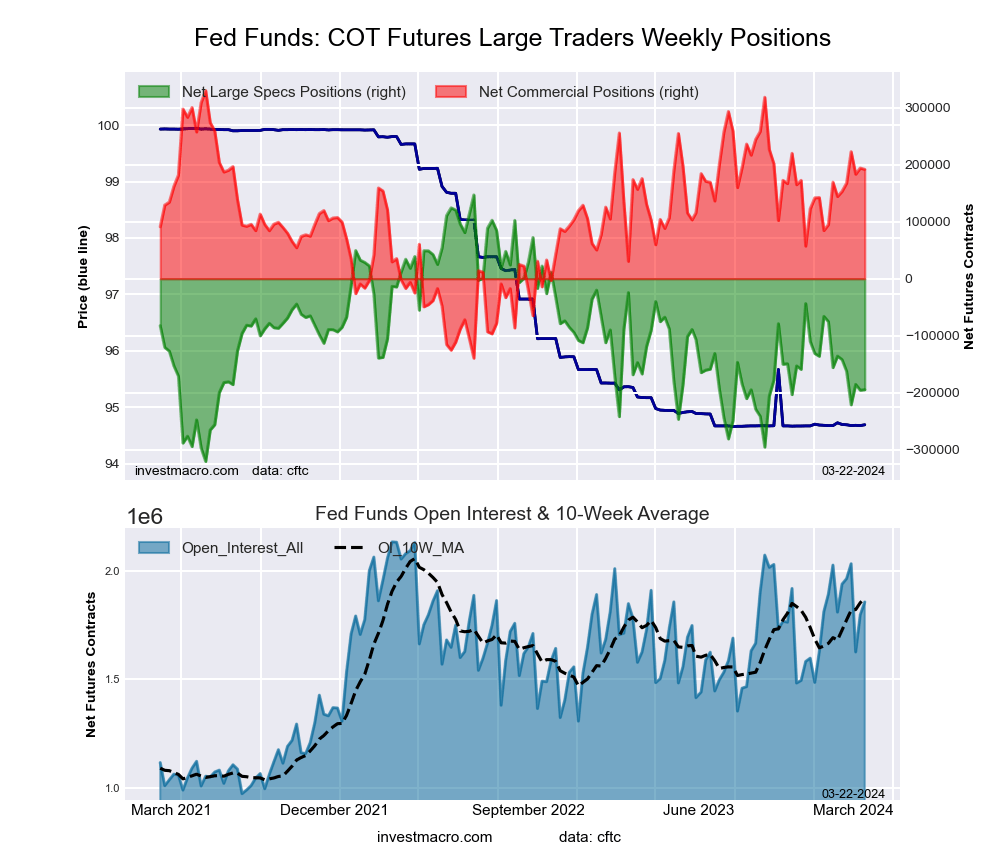
This week’s current strength score (the trader positioning range over the past three years, measured from 0 to 100) shows the speculators are currently Bearish with a score of 26.9 percent. The commercials are Bullish with a score of 70.5 percent and the small traders (not shown in chart) are Bullish-Extreme with a score of 96.5 percent.
Our weekly trend-following model classifies the current market price position as: Downtrend. The current action for the model is considered to be: Hold – Maintain Short Position.
| 30-Day Federal Funds Statistics | SPECULATORS | COMMERCIALS | SMALL TRADERS |
| – Percent of Open Interest Longs: | 8.1 | 72.9 | 2.1 |
| – Percent of Open Interest Shorts: | 18.6 | 62.5 | 2.0 |
| – Net Position: | -194,845 | 192,059 | 2,786 |
| – Gross Longs: | 151,004 | 1,352,227 | 39,137 |
| – Gross Shorts: | 345,849 | 1,160,168 | 36,351 |
| – Long to Short Ratio: | 0.4 to 1 | 1.2 to 1 | 1.1 to 1 |
| NET POSITION TREND: | |||
| – Strength Index Score (3 Year Range Pct): | 26.9 | 70.5 | 96.5 |
| – Strength Index Reading (3 Year Range): | Bearish | Bullish | Bullish-Extreme |
| NET POSITION MOVEMENT INDEX: | |||
| – 6-Week Change in Strength Index: | -12.6 | 10.1 | 22.0 |
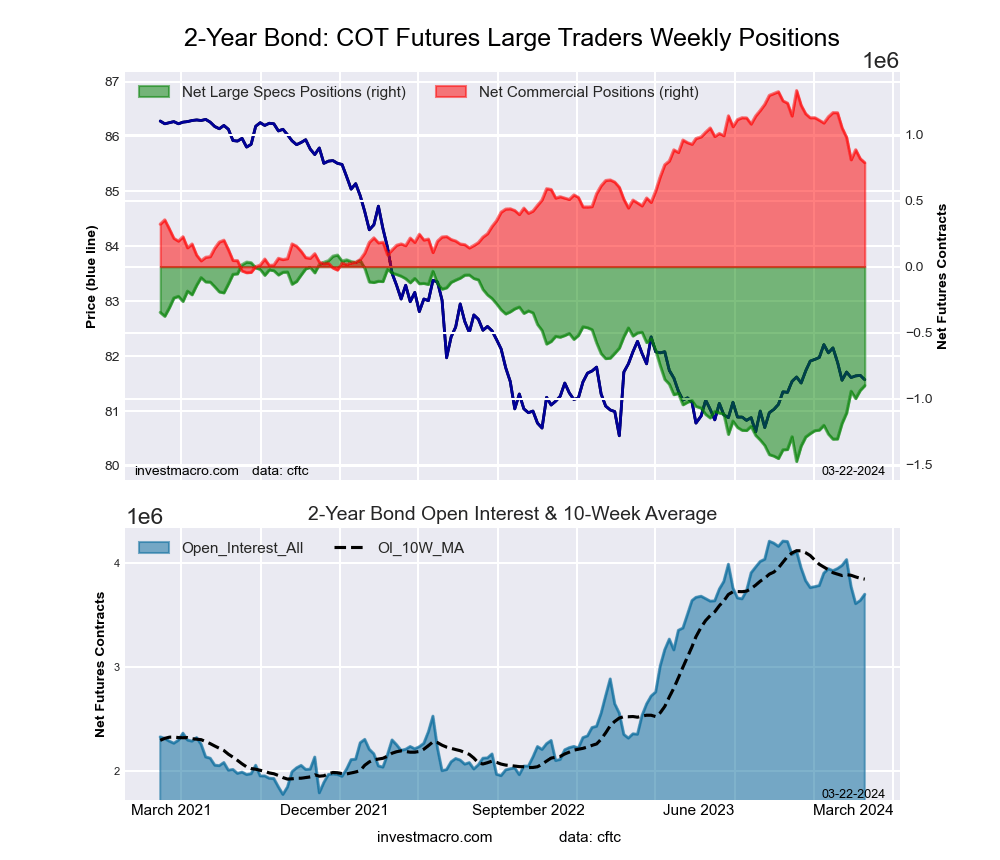
This week’s current strength score (the trader positioning range over the past three years, measured from 0 to 100) shows the speculators are currently Bearish with a score of 36.7 percent. The commercials are Bullish with a score of 60.4 percent and the small traders (not shown in chart) are Bullish-Extreme with a score of 87.2 percent.
Our weekly trend-following model classifies the current market price position as: Uptrend. The current action for the model is considered to be: Hold – Maintain Long Position.
| 2-Year Treasury Note Statistics | SPECULATORS | COMMERCIALS | SMALL TRADERS |
| – Percent of Open Interest Longs: | 11.4 | 80.3 | 6.6 |
| – Percent of Open Interest Shorts: | 35.8 | 59.0 | 3.6 |
| – Net Position: | -901,595 | 787,910 | 113,685 |
| – Gross Longs: | 422,597 | 2,969,326 | 245,616 |
| – Gross Shorts: | 1,324,192 | 2,181,416 | 131,931 |
| – Long to Short Ratio: | 0.3 to 1 | 1.4 to 1 | 1.9 to 1 |
| NET POSITION TREND: | |||
| – Strength Index Score (3 Year Range Pct): | 36.7 | 60.4 | 87.2 |
| – Strength Index Reading (3 Year Range): | Bearish | Bullish | Bullish-Extreme |
| NET POSITION MOVEMENT INDEX: | |||
| – 6-Week Change in Strength Index: | 25.8 | -27.4 | -9.6 |
This week’s current strength score (the trader positioning range over the past three years, measured from 0 to 100) shows the speculators are currently Bearish-Extreme with a score of 19.9 percent. The commercials are Bullish with a score of 79.9 percent and the small traders (not shown in chart) are Bullish-Extreme with a score of 81.3 percent.
Our weekly trend-following model classifies the current market price position as: Uptrend. The current action for the model is considered to be: Hold – Maintain Long Position.
| 5-Year Treasury Note Statistics | SPECULATORS | COMMERCIALS | SMALL TRADERS |
| – Percent of Open Interest Longs: | 6.8 | 84.0 | 7.0 |
| – Percent of Open Interest Shorts: | 26.6 | 65.7 | 5.5 |
| – Net Position: | -1,157,057 | 1,069,939 | 87,118 |
| – Gross Longs: | 395,194 | 4,907,528 | 406,591 |
| – Gross Shorts: | 1,552,251 | 3,837,589 | 319,473 |
| – Long to Short Ratio: | 0.3 to 1 | 1.3 to 1 | 1.3 to 1 |
| NET POSITION TREND: | |||
| – Strength Index Score (3 Year Range Pct): | 19.9 | 79.9 | 81.3 |
| – Strength Index Reading (3 Year Range): | Bearish-Extreme | Bullish | Bullish-Extreme |
| NET POSITION MOVEMENT INDEX: | |||
| – 6-Week Change in Strength Index: | 9.0 | -8.0 | -7.4 |
This week’s current strength score (the trader positioning range over the past three years, measured from 0 to 100) shows the speculators are currently Bearish with a score of 29.5 percent. The commercials are Bullish with a score of 62.3 percent and the small traders (not shown in chart) are Bullish-Extreme with a score of 83.8 percent.
Our weekly trend-following model classifies the current market price position as: Weak Uptrend. The current action for the model is considered to be: Hold – Maintain Long Position.
| 10-Year Treasury Note Statistics | SPECULATORS | COMMERCIALS | SMALL TRADERS |
| – Percent of Open Interest Longs: | 10.8 | 77.6 | 9.7 |
| – Percent of Open Interest Shorts: | 24.1 | 65.3 | 8.6 |
| – Net Position: | -574,010 | 526,781 | 47,229 |
| – Gross Longs: | 461,066 | 3,327,859 | 414,071 |
| – Gross Shorts: | 1,035,076 | 2,801,078 | 366,842 |
| – Long to Short Ratio: | 0.4 to 1 | 1.2 to 1 | 1.1 to 1 |
| NET POSITION TREND: | |||
| – Strength Index Score (3 Year Range Pct): | 29.5 | 62.3 | 83.8 |
| – Strength Index Reading (3 Year Range): | Bearish | Bullish | Bullish-Extreme |
| NET POSITION MOVEMENT INDEX: | |||
| – 6-Week Change in Strength Index: | 23.8 | -31.3 | -1.8 |
This week’s current strength score (the trader positioning range over the past three years, measured from 0 to 100) shows the speculators are currently Bearish with a score of 24.3 percent. The commercials are Bullish with a score of 75.1 percent and the small traders (not shown in chart) are Bullish with a score of 66.6 percent.
Our weekly trend-following model classifies the current market price position as: Weak Uptrend. The current action for the model is considered to be: Hold – Maintain Long Position.
| Ultra 10-Year Notes Statistics | SPECULATORS | COMMERCIALS | SMALL TRADERS |
| – Percent of Open Interest Longs: | 14.5 | 73.7 | 10.0 |
| – Percent of Open Interest Shorts: | 22.0 | 62.2 | 13.9 |
| – Net Position: | -153,271 | 233,014 | -79,743 |
| – Gross Longs: | 294,809 | 1,497,187 | 203,561 |
| – Gross Shorts: | 448,080 | 1,264,173 | 283,304 |
| – Long to Short Ratio: | 0.7 to 1 | 1.2 to 1 | 0.7 to 1 |
| NET POSITION TREND: | |||
| – Strength Index Score (3 Year Range Pct): | 24.3 | 75.1 | 66.6 |
| – Strength Index Reading (3 Year Range): | Bearish | Bullish | Bullish |
| NET POSITION MOVEMENT INDEX: | |||
| – 6-Week Change in Strength Index: | 12.2 | -18.9 | 12.8 |
This week’s current strength score (the trader positioning range over the past three years, measured from 0 to 100) shows the speculators are currently Bullish with a score of 75.7 percent. The commercials are Bearish-Extreme with a score of 5.5 percent and the small traders (not shown in chart) are Bullish with a score of 79.3 percent.
Our weekly trend-following model classifies the current market price position as: Weak Uptrend. The current action for the model is considered to be: Hold – Maintain Long Position.
| US Treasury Bonds Statistics | SPECULATORS | COMMERCIALS | SMALL TRADERS |
| – Percent of Open Interest Longs: | 16.2 | 69.4 | 12.9 |
| – Percent of Open Interest Shorts: | 17.7 | 70.7 | 10.0 |
| – Net Position: | -22,454 | -19,971 | 42,425 |
| – Gross Longs: | 242,086 | 1,034,162 | 191,844 |
| – Gross Shorts: | 264,540 | 1,054,133 | 149,419 |
| – Long to Short Ratio: | 0.9 to 1 | 1.0 to 1 | 1.3 to 1 |
| NET POSITION TREND: | |||
| – Strength Index Score (3 Year Range Pct): | 75.7 | 5.5 | 79.3 |
| – Strength Index Reading (3 Year Range): | Bullish | Bearish-Extreme | Bullish |
| NET POSITION MOVEMENT INDEX: | |||
| – 6-Week Change in Strength Index: | 41.9 | -42.7 | -12.0 |
This week’s current strength score (the trader positioning range over the past three years, measured from 0 to 100) shows the speculators are currently Bullish with a score of 63.2 percent. The commercials are Bearish with a score of 36.7 percent and the small traders (not shown in chart) are Bullish with a score of 53.8 percent.
Our weekly trend-following model classifies the current market price position as: Weak Uptrend. The current action for the model is considered to be: Hold – Maintain Long Position.
| Ultra US Treasury Bonds Statistics | SPECULATORS | COMMERCIALS | SMALL TRADERS |
| – Percent of Open Interest Longs: | 8.8 | 79.8 | 11.1 |
| – Percent of Open Interest Shorts: | 28.0 | 61.6 | 10.0 |
| – Net Position: | -304,714 | 287,081 | 17,633 |
| – Gross Longs: | 139,244 | 1,263,105 | 175,999 |
| – Gross Shorts: | 443,958 | 976,024 | 158,366 |
| – Long to Short Ratio: | 0.3 to 1 | 1.3 to 1 | 1.1 to 1 |
| NET POSITION TREND: | |||
| – Strength Index Score (3 Year Range Pct): | 63.2 | 36.7 | 53.8 |
| – Strength Index Reading (3 Year Range): | Bullish | Bearish | Bullish |
| NET POSITION MOVEMENT INDEX: | |||
| – 6-Week Change in Strength Index: | 15.2 | -19.0 | 1.2 |
Article By InvestMacro – Receive our weekly COT Newsletter
*COT Report: The COT data, released weekly to the public each Friday, is updated through the most recent Tuesday (data is 3 days old) and shows a quick view of how large speculators or non-commercials (for-profit traders) were positioned in the futures markets.
The CFTC categorizes trader positions according to commercial hedgers (traders who use futures contracts for hedging as part of the business), non-commercials (large traders who speculate to realize trading profits) and nonreportable traders (usually small traders/speculators) as well as their open interest (contracts open in the market at time of reporting). See CFTC criteria here.
By JustMarkets On Tuesday, the US stock indices finished the session in the green, supported…
By Analytical Department RoboForex GBP/USD rose to 1.3403 on Wednesday, with British politics taking centre…
By Analytical Department RoboForex USD/JPY ended Tuesday at 162.27, with the Japanese yen remaining near…
By JustMarkets On Friday, the Dow Jones Index (US30) rose by 0.29% (weekly: -0.36%). The…
By Analytical Department RoboForex EUR/USD opens the week around 1.1433. Investors continue to assess the…
By InvestMacro Here are the latest charts and statistics for the Commitment of Traders (COT)…
This website uses cookies.