
By RoboForex Analytical Department
Brent crude oil is seeing a slight increase on Tuesday, priced around $83.57 per barrel. The market remains close to two-month lows, caught between optimism for a peaceful resolution to the Middle East conflict and concerns over crude oil inventories in the United States.
The primary focus in the stock market currently revolves around the ongoing negotiations between Israel and Hamas, facilitated by Egypt. However, these talks have hit an impasse, and there are renewed signs of conflict from both parties. Israel has expressed dissatisfaction, stating that the terms offered do not meet its demands, thereby complicating diplomatic efforts.
Despite these challenges, the ongoing conflict in the Middle East contributes to supporting energy prices due to fears of potential disruptions in raw material supplies. On the demand side, Saudi Arabia has recently increased its oil selling prices to Asian buyers, indicating an expectation of robust demand, particularly during the upcoming summer. This adjustment is often seen when a producer is confident about expanding demand, with Saudi Arabia likely counting on strong consumption from China, the world’s leading oil importer.
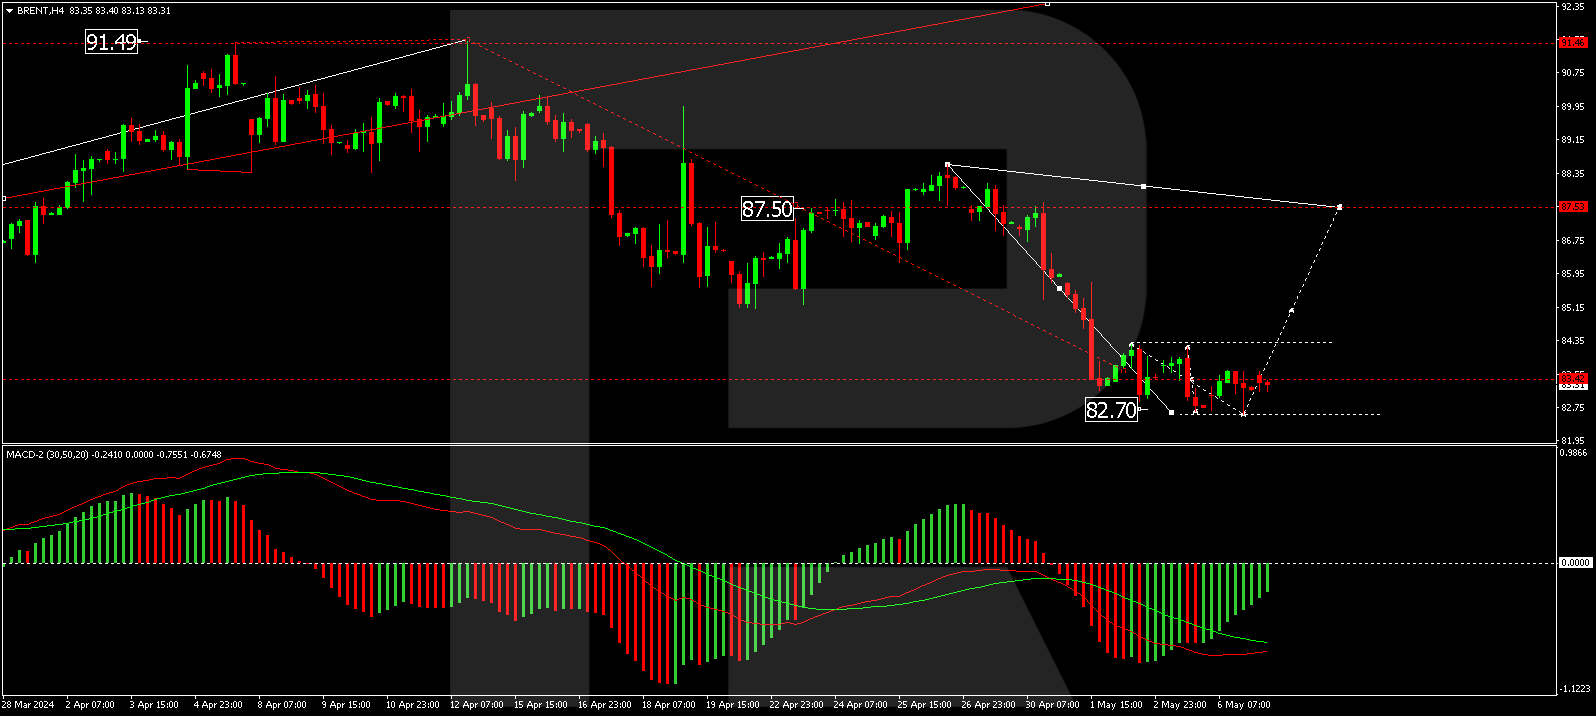
Brent technical analysis
Free Reports:
 Download Our Metatrader 4 Indicators – Put Our Free MetaTrader 4 Custom Indicators on your charts when you join our Weekly Newsletter
 Get our Weekly Commitment of Traders Reports - See where the biggest traders (Hedge Funds and Commercial Hedgers) are positioned in the futures markets on a weekly basis.
On the H4 chart, Brent has achieved the local target of the growth wave at 91.50. The correction towards 82.70 is nearing completion, and we anticipate the formation of a consolidation range above this level. Should the price break upwards from this range, a new wave of growth towards $95.00 could be initiated. This bullish scenario is technically supported by the MACD indicator, which shows the signal line at the lows under the zero mark, indicating potential growth to new highs.
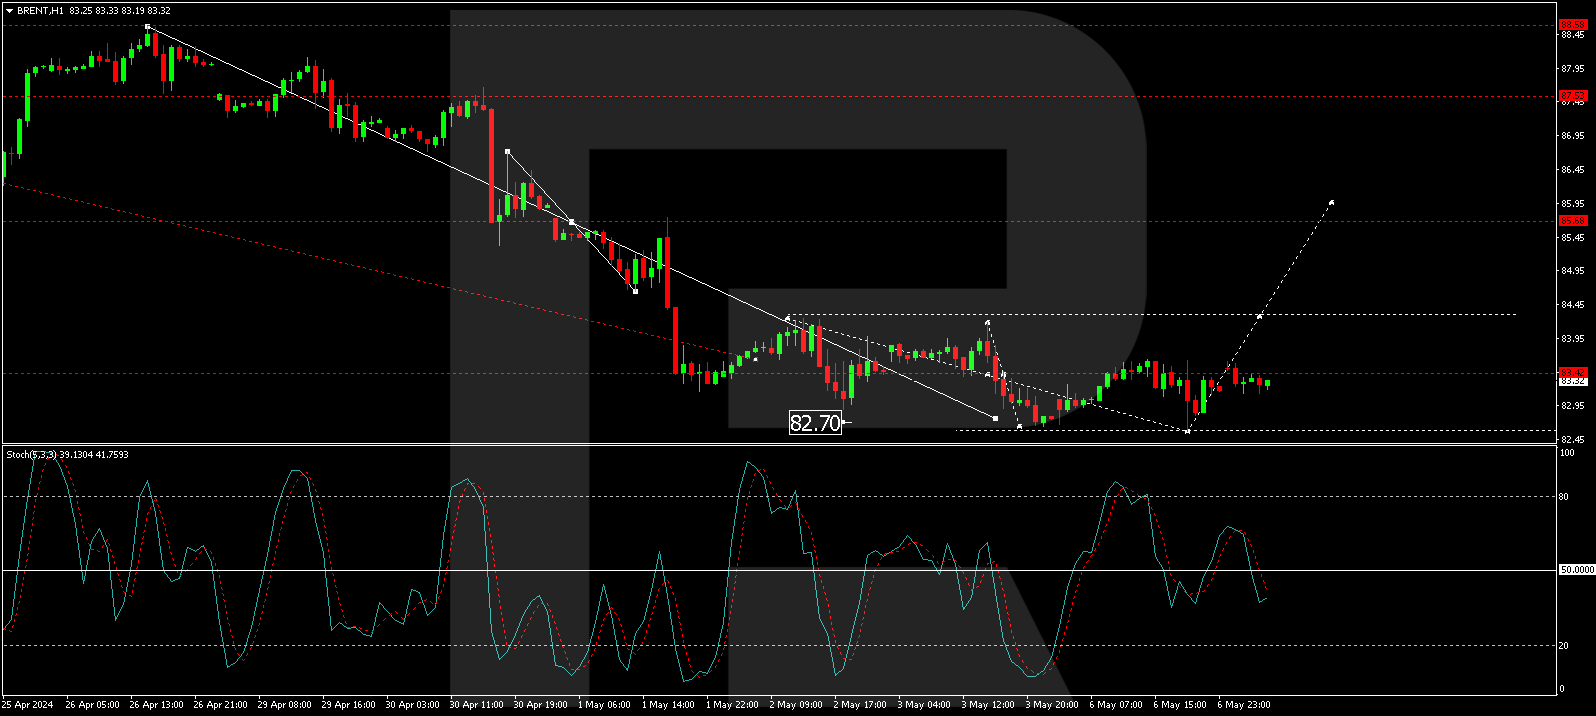
On the H1 chart, the structure of the fifth wave of correction to 82.70 has been formed. A consolidation range has developed above this level, and we expect a growth link to 84.44. Should this level be surpassed, it could open the potential for a growth wave to 85.70, which is the initial target. This technical outlook is corroborated by the Stochastic oscillator, with its signal line above 20 and prepared to ascend to 80.
Disclaimer
Any forecasts contained herein are based on the author’s particular opinion. This analysis may not be treated as trading advice. RoboForex bears no responsibility for trading results based on trading recommendations and reviews contained herein.

- Oil prices jumped 4% amid a new wave of escalation between the US and Iran Jul 13, 2026
- EUR/USD: US Inflation Will Determine Everything Jul 13, 2026
- COT Metals Charts: Weekly Speculator Bets see small gains for Silver & Gold Jul 12, 2026
- COT Bonds Charts: Speculator Bets led by SOFR 3-Months & 2-Year Bonds Jul 12, 2026
- COT Energy Charts: Weekly Speculator Changes led by Brent Oil Jul 12, 2026
- COT Soft Commodities Charts: Weekly Speculator Changes led by Sugar, Corn & Soybeans Jul 12, 2026
- The US and European stock indices are rising again amid renewed investor interest in the AI industry. Jul 10, 2026
- USD/JPY Falls as Yen Recovers Weekly Losses Jul 10, 2026
- Crude oil prices surged sharply by 7% in reaction to the rapid escalation of the conflict in the Middle East Jul 9, 2026
- Middle East Tensions Weigh on Gold Jul 9, 2026