By InvestMacro
Here are the latest charts and statistics for the Commitment of Traders (COT) reports data published by the Commodities Futures Trading Commission (CFTC).
The latest COT data is updated through Tuesday January 9th and shows a quick view of how large traders (for-profit speculators and commercial entities) were positioned in the futures markets.
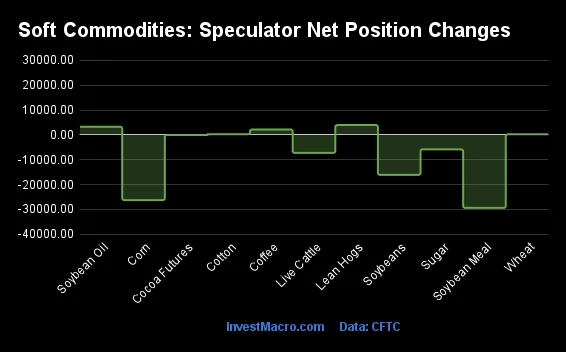
The COT soft commodities markets speculator bets were lower this week as five out of the eleven softs markets we cover had higher positioning while the other six markets had lower speculator contracts.
Free Reports:
Leading the gains for the softs markets was Lean Hogs (3,950 contracts) with Soybean Oil (3,279 contracts), Coffee (2,160 contracts), Cotton (261 contracts) and Wheat (227 contracts) also showing positive weeks.
The markets with the declines in speculator bets this week were Soybean Meal (-29,428 contracts), Corn (-26,305 contracts), Soybeans (-16,121 contracts) Sugar (-5,867 contracts), Live Cattle (-7,286 contracts) and Cocoa (-73 contracts) also registering lower bets on the week.
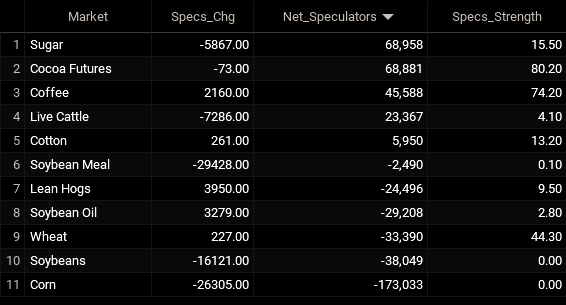
Legend: Weekly Speculators Change | Speculators Current Net Position | Speculators Strength Score compared to last 3-Years (0-100 range)
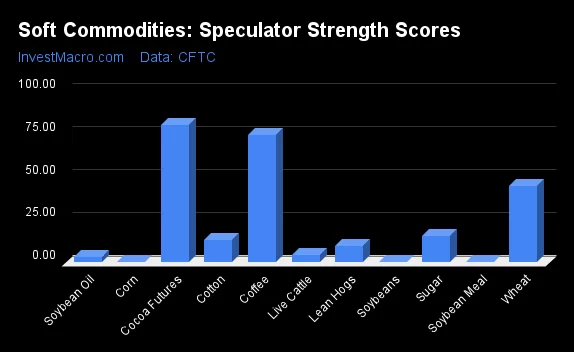
COT Strength Scores (a normalized measure of Speculator positions over a 3-Year range, from 0 to 100 where above 80 is Extreme-Bullish and below 20 is Extreme-Bearish) showed that Cocoa (80 percent) and Coffee (74 percent) lead the softs markets this week.
On the downside there are a number of markets at extreme lows. Soybean Meal (0 percent), Corn (0 percent), Soybeans (0 percent), Soybean Oil (3 percent), Live Cattle (4 percent), Lean Hogs (10 percent), Sugar (16 percent) and Cotton (13 percent) all come in at the lowest strength levels currently and are in Extreme-Bearish territory (below 20 percent).
Strength Statistics:
Corn (0.0 percent) vs Corn previous week (3.6 percent)
Sugar (15.5 percent) vs Sugar previous week (17.7 percent)
Coffee (74.2 percent) vs Coffee previous week (72.0 percent)
Soybeans (0.0 percent) vs Soybeans previous week (5.6 percent)
Soybean Oil (2.8 percent) vs Soybean Oil previous week (0.8 percent)
Soybean Meal (0.1 percent) vs Soybean Meal previous week (16.4 percent)
Live Cattle (4.1 percent) vs Live Cattle previous week (12.0 percent)
Lean Hogs (9.5 percent) vs Lean Hogs previous week (6.3 percent)
Cotton (13.2 percent) vs Cotton previous week (13.0 percent)
Cocoa (80.2 percent) vs Cocoa previous week (80.3 percent)
Wheat (44.3 percent) vs Wheat previous week (44.2 percent)
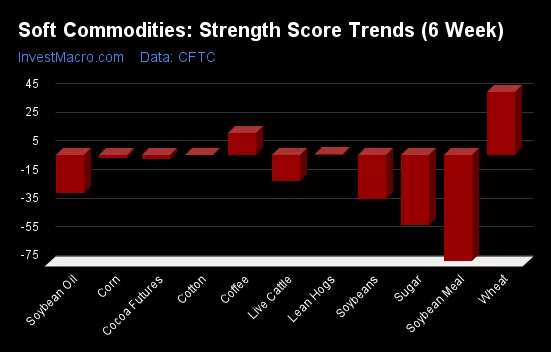
COT Strength Score Trends (or move index, calculates the 6-week changes in strength scores) showed that Wheat (44 percent) and Coffee (15 percent) lead the past six weeks trends for soft commodities. Lean Hogs (1 percent) is the next highest positive mover in the latest trends data.
Soybean Meal (-74 percent) leads the downside trend scores currently with Sugar (-49 percent), Soybeans (-31 percent) and Soybean Oil (-27 percent) following next with lower trend scores.
Strength Trend Statistics:
Corn (-2.2 percent) vs Corn previous week (-3.2 percent)
Sugar (-49.3 percent) vs Sugar previous week (-53.3 percent)
Coffee (15.4 percent) vs Coffee previous week (13.4 percent)
Soybeans (-30.7 percent) vs Soybeans previous week (-33.2 percent)
Soybean Oil (-26.5 percent) vs Soybean Oil previous week (-33.0 percent)
Soybean Meal (-74.1 percent) vs Soybean Meal previous week (-62.2 percent)
Live Cattle (-17.8 percent) vs Live Cattle previous week (-8.6 percent)
Lean Hogs (0.6 percent) vs Lean Hogs previous week (-9.5 percent)
Cotton (-0.2 percent) vs Cotton previous week (-0.2 percent)
Cocoa (-2.8 percent) vs Cocoa previous week (-4.0 percent)
Wheat (44.3 percent) vs Wheat previous week (30.5 percent)
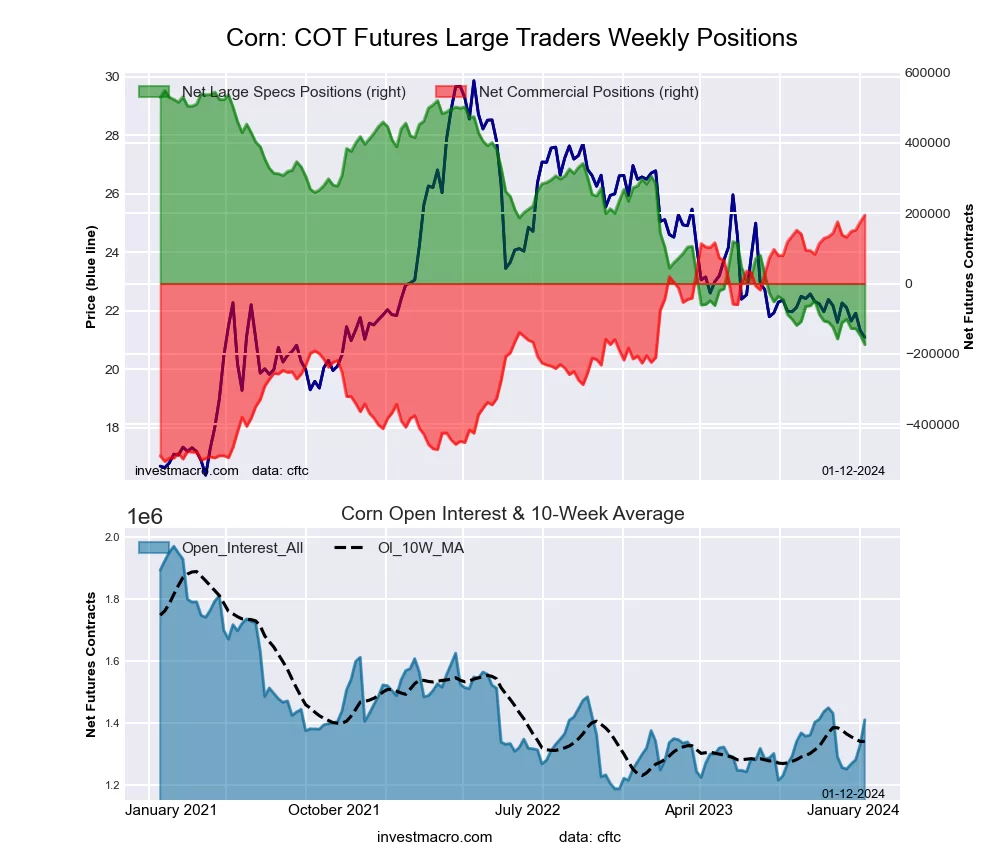
This week’s current strength score (the trader positioning range over the past three years, measured from 0 to 100) shows the speculators are currently Bearish-Extreme with a score of 0.0 percent. The commercials are Bullish-Extreme with a score of 100.0 percent and the small traders (not shown in chart) are Bullish-Extreme with a score of 95.3 percent.
Our weekly trend-following model classifies the current market price position as: Strong Downtrend. The current action for the model is considered to be: Hold – Maintain Short Position.
| CORN Futures Statistics | SPECULATORS | COMMERCIALS | SMALL TRADERS |
| – Percent of Open Interest Longs: | 18.7 | 46.4 | 10.4 |
| – Percent of Open Interest Shorts: | 30.9 | 32.7 | 11.9 |
| – Net Position: | -173,033 | 194,021 | -20,988 |
| – Gross Longs: | 263,111 | 654,962 | 146,167 |
| – Gross Shorts: | 436,144 | 460,941 | 167,155 |
| – Long to Short Ratio: | 0.6 to 1 | 1.4 to 1 | 0.9 to 1 |
| NET POSITION TREND: | |||
| – Strength Index Score (3 Year Range Pct): | 0.0 | 100.0 | 95.3 |
| – Strength Index Reading (3 Year Range): | Bearish-Extreme | Bullish-Extreme | Bullish-Extreme |
| NET POSITION MOVEMENT INDEX: | |||
| – 6-Week Change in Strength Index: | -2.2 | 2.7 | -4.7 |
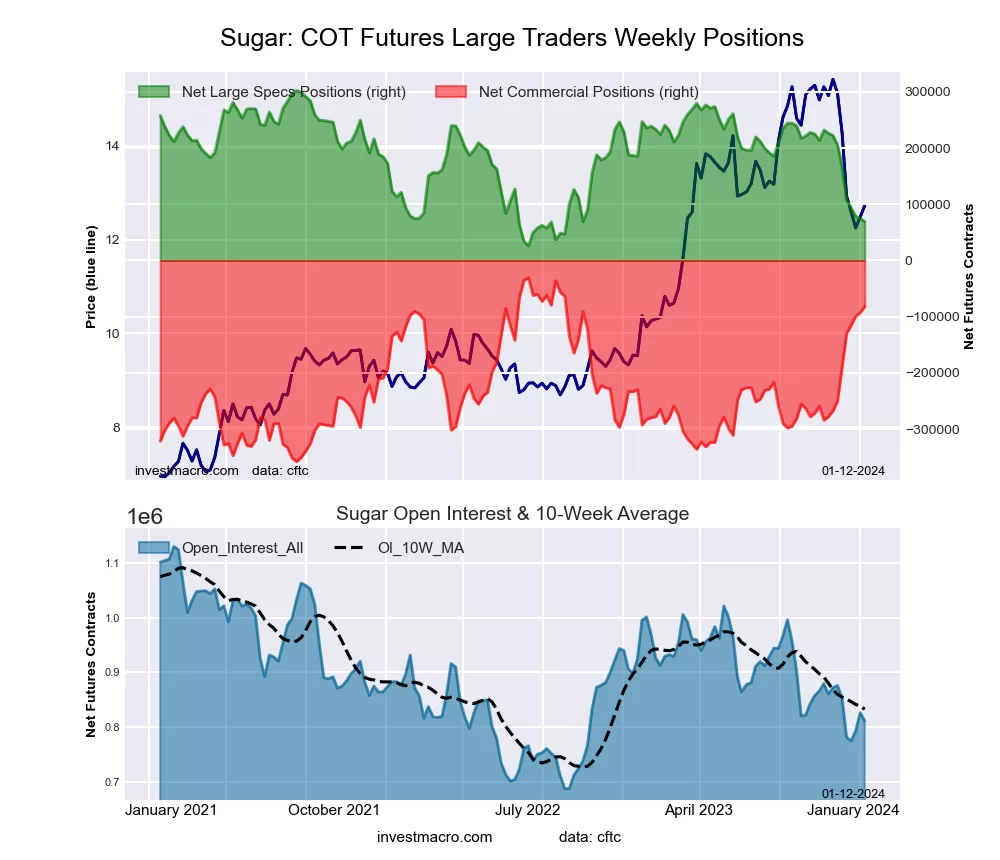
This week’s current strength score (the trader positioning range over the past three years, measured from 0 to 100) shows the speculators are currently Bearish-Extreme with a score of 15.5 percent. The commercials are Bullish-Extreme with a score of 84.4 percent and the small traders (not shown in chart) are Bearish-Extreme with a score of 18.6 percent.
Our weekly trend-following model classifies the current market price position as: Strong Downtrend. The current action for the model is considered to be: Hold – Maintain Short Position.
| SUGAR Futures Statistics | SPECULATORS | COMMERCIALS | SMALL TRADERS |
| – Percent of Open Interest Longs: | 21.4 | 57.1 | 9.1 |
| – Percent of Open Interest Shorts: | 12.9 | 67.1 | 7.5 |
| – Net Position: | 68,958 | -81,593 | 12,635 |
| – Gross Longs: | 173,488 | 463,071 | 73,874 |
| – Gross Shorts: | 104,530 | 544,664 | 61,239 |
| – Long to Short Ratio: | 1.7 to 1 | 0.9 to 1 | 1.2 to 1 |
| NET POSITION TREND: | |||
| – Strength Index Score (3 Year Range Pct): | 15.5 | 84.4 | 18.6 |
| – Strength Index Reading (3 Year Range): | Bearish-Extreme | Bullish-Extreme | Bearish-Extreme |
| NET POSITION MOVEMENT INDEX: | |||
| – 6-Week Change in Strength Index: | -49.3 | 51.4 | -42.0 |
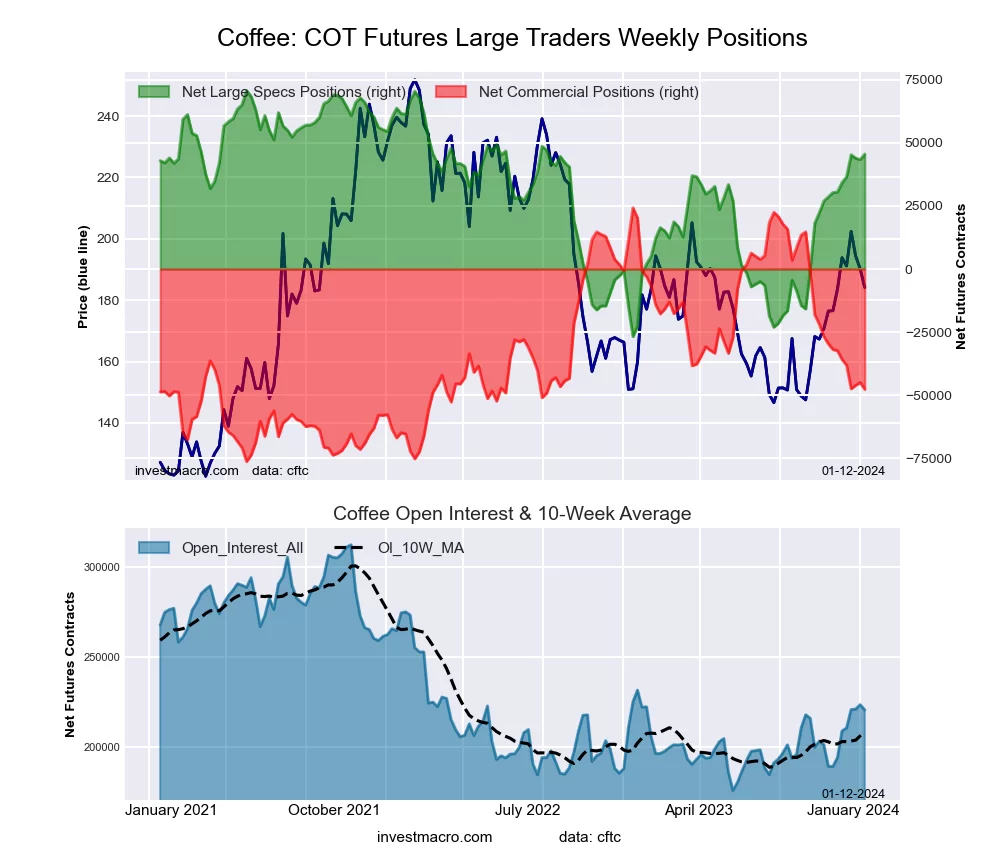
This week’s current strength score (the trader positioning range over the past three years, measured from 0 to 100) shows the speculators are currently Bullish with a score of 74.2 percent. The commercials are Bearish with a score of 28.4 percent and the small traders (not shown in chart) are Bearish with a score of 41.0 percent.
Our weekly trend-following model classifies the current market price position as: Uptrend. The current action for the model is considered to be: Hold – Maintain Long Position.
| COFFEE Futures Statistics | SPECULATORS | COMMERCIALS | SMALL TRADERS |
| – Percent of Open Interest Longs: | 33.2 | 36.4 | 4.6 |
| – Percent of Open Interest Shorts: | 12.5 | 58.1 | 3.6 |
| – Net Position: | 45,588 | -47,708 | 2,120 |
| – Gross Longs: | 73,163 | 80,276 | 10,075 |
| – Gross Shorts: | 27,575 | 127,984 | 7,955 |
| – Long to Short Ratio: | 2.7 to 1 | 0.6 to 1 | 1.3 to 1 |
| NET POSITION TREND: | |||
| – Strength Index Score (3 Year Range Pct): | 74.2 | 28.4 | 41.0 |
| – Strength Index Reading (3 Year Range): | Bullish | Bearish | Bearish |
| NET POSITION MOVEMENT INDEX: | |||
| – 6-Week Change in Strength Index: | 15.4 | -15.2 | 3.5 |
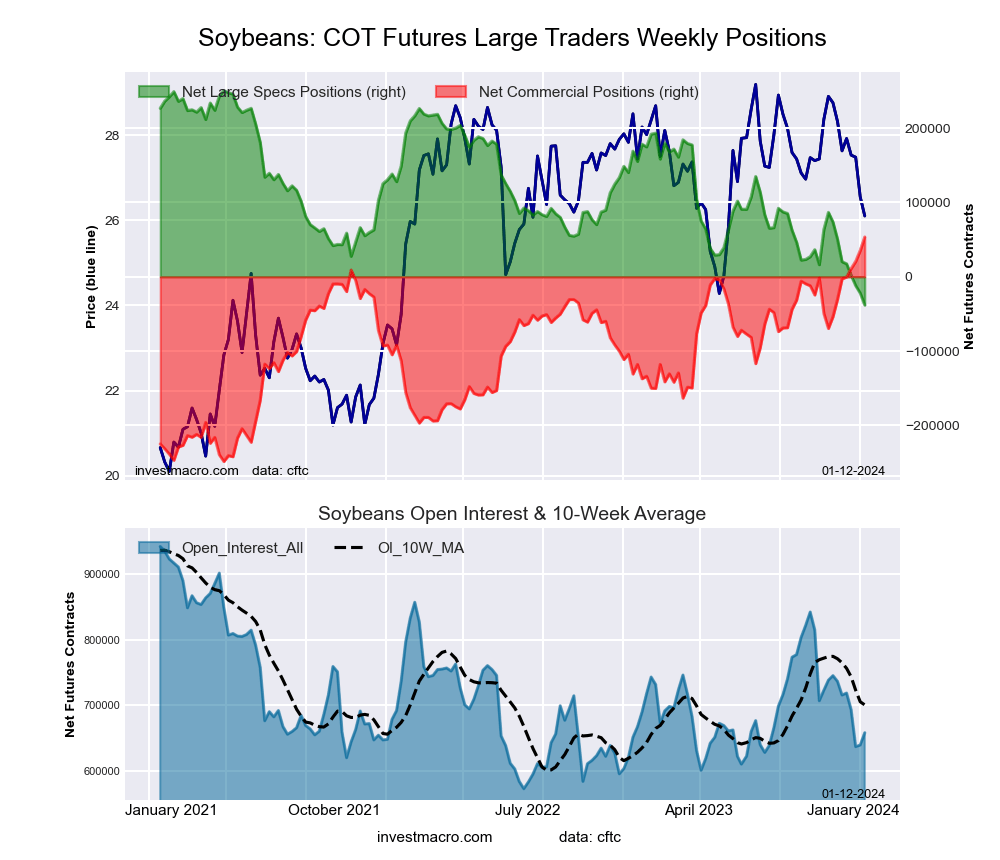
This week’s current strength score (the trader positioning range over the past three years, measured from 0 to 100) shows the speculators are currently Bearish-Extreme with a score of 0.0 percent. The commercials are Bullish-Extreme with a score of 100.0 percent and the small traders (not shown in chart) are Bullish with a score of 66.6 percent.
Our weekly trend-following model classifies the current market price position as: Strong Downtrend. The current action for the model is considered to be: Hold – Maintain Short Position.
| SOYBEANS Futures Statistics | SPECULATORS | COMMERCIALS | SMALL TRADERS |
| – Percent of Open Interest Longs: | 15.1 | 57.5 | 7.6 |
| – Percent of Open Interest Shorts: | 20.9 | 49.3 | 10.0 |
| – Net Position: | -38,049 | 53,620 | -15,571 |
| – Gross Longs: | 99,237 | 378,409 | 50,048 |
| – Gross Shorts: | 137,286 | 324,789 | 65,619 |
| – Long to Short Ratio: | 0.7 to 1 | 1.2 to 1 | 0.8 to 1 |
| NET POSITION TREND: | |||
| – Strength Index Score (3 Year Range Pct): | 0.0 | 100.0 | 66.6 |
| – Strength Index Reading (3 Year Range): | Bearish-Extreme | Bullish-Extreme | Bullish |
| NET POSITION MOVEMENT INDEX: | |||
| – 6-Week Change in Strength Index: | -30.7 | 27.8 | 11.4 |
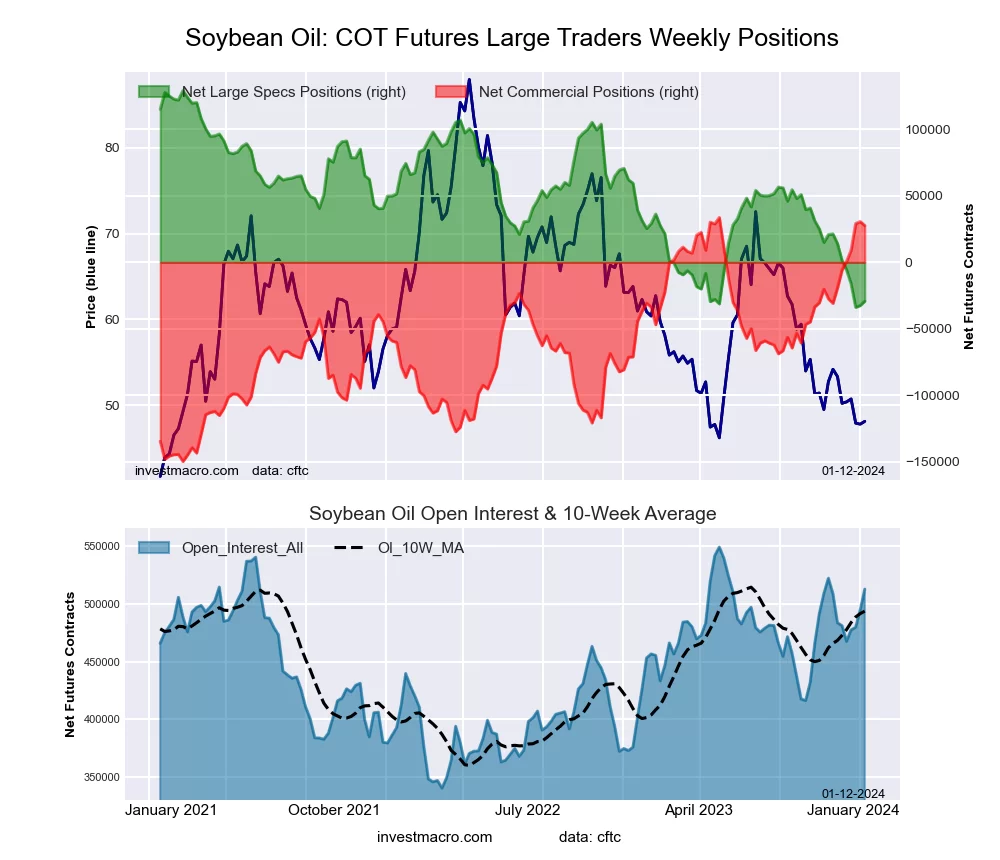
This week’s current strength score (the trader positioning range over the past three years, measured from 0 to 100) shows the speculators are currently Bearish-Extreme with a score of 2.8 percent. The commercials are Bullish-Extreme with a score of 96.7 percent and the small traders (not shown in chart) are Bearish-Extreme with a score of 19.4 percent.
Our weekly trend-following model classifies the current market price position as: Downtrend. The current action for the model is considered to be: Hold – Maintain Short Position.
| SOYBEAN OIL Futures Statistics | SPECULATORS | COMMERCIALS | SMALL TRADERS |
| – Percent of Open Interest Longs: | 18.6 | 50.5 | 5.8 |
| – Percent of Open Interest Shorts: | 24.3 | 45.1 | 5.5 |
| – Net Position: | -29,208 | 27,654 | 1,554 |
| – Gross Longs: | 95,344 | 258,646 | 29,768 |
| – Gross Shorts: | 124,552 | 230,992 | 28,214 |
| – Long to Short Ratio: | 0.8 to 1 | 1.1 to 1 | 1.1 to 1 |
| NET POSITION TREND: | |||
| – Strength Index Score (3 Year Range Pct): | 2.8 | 96.7 | 19.4 |
| – Strength Index Reading (3 Year Range): | Bearish-Extreme | Bullish-Extreme | Bearish-Extreme |
| NET POSITION MOVEMENT INDEX: | |||
| – 6-Week Change in Strength Index: | -26.5 | 25.6 | -13.8 |
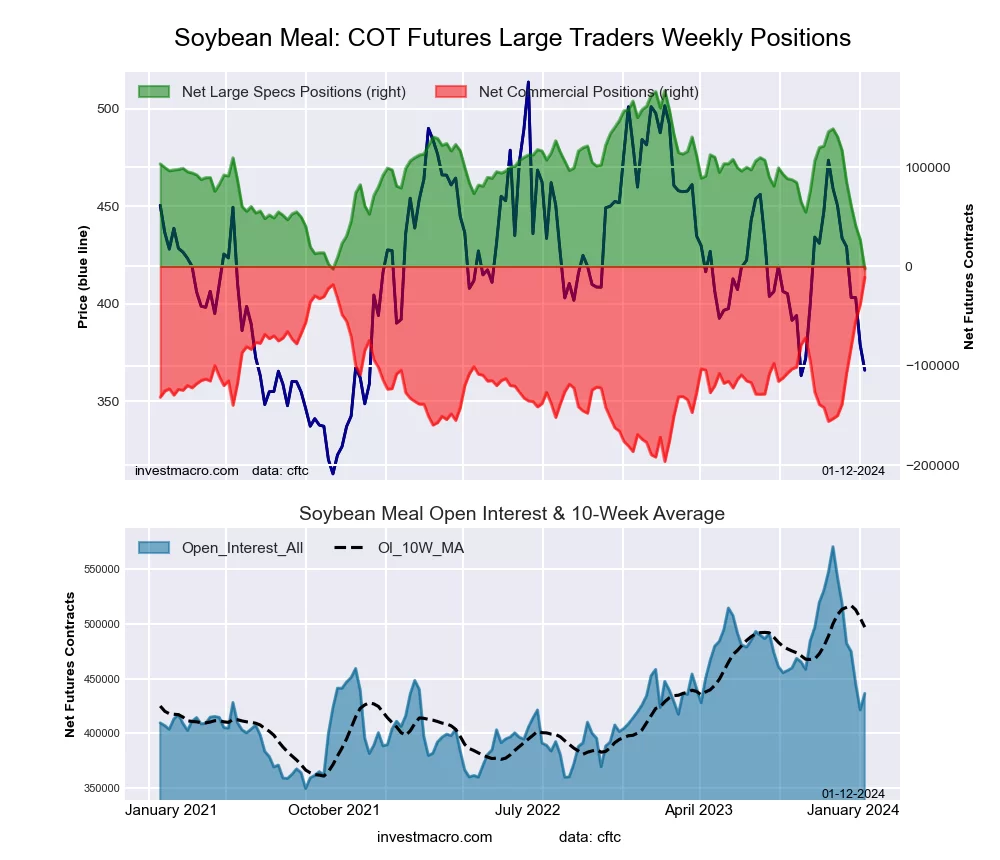
This week’s current strength score (the trader positioning range over the past three years, measured from 0 to 100) shows the speculators are currently Bearish-Extreme with a score of 0.1 percent. The commercials are Bullish-Extreme with a score of 100.0 percent and the small traders (not shown in chart) are Bearish-Extreme with a score of 15.4 percent.
Our weekly trend-following model classifies the current market price position as: Strong Downtrend. The current action for the model is considered to be: New Sell – Short Position.
| SOYBEAN MEAL Futures Statistics | SPECULATORS | COMMERCIALS | SMALL TRADERS |
| – Percent of Open Interest Longs: | 20.8 | 48.2 | 10.3 |
| – Percent of Open Interest Shorts: | 21.4 | 50.7 | 7.2 |
| – Net Position: | -2,490 | -10,834 | 13,324 |
| – Gross Longs: | 90,725 | 210,311 | 44,758 |
| – Gross Shorts: | 93,215 | 221,145 | 31,434 |
| – Long to Short Ratio: | 1.0 to 1 | 1.0 to 1 | 1.4 to 1 |
| NET POSITION TREND: | |||
| – Strength Index Score (3 Year Range Pct): | 0.1 | 100.0 | 15.4 |
| – Strength Index Reading (3 Year Range): | Bearish-Extreme | Bullish-Extreme | Bearish-Extreme |
| NET POSITION MOVEMENT INDEX: | |||
| – 6-Week Change in Strength Index: | -74.1 | 75.1 | -27.1 |
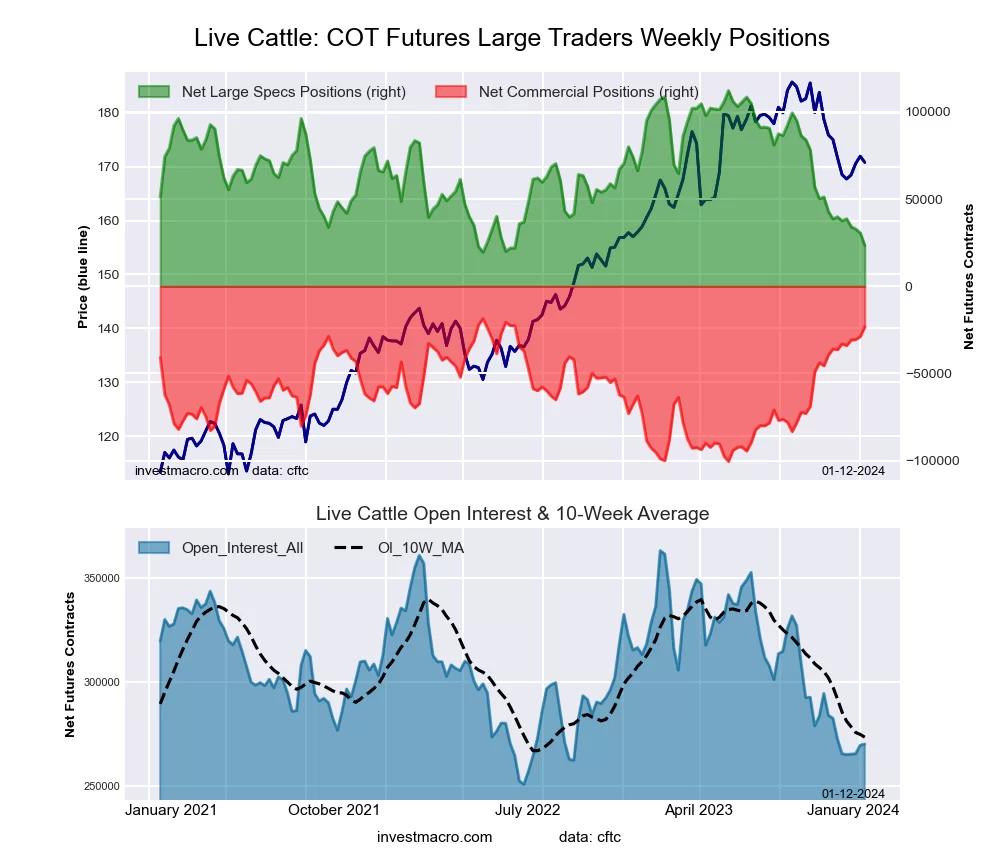
This week’s current strength score (the trader positioning range over the past three years, measured from 0 to 100) shows the speculators are currently Bearish-Extreme with a score of 4.1 percent. The commercials are Bullish-Extreme with a score of 94.3 percent and the small traders (not shown in chart) are Bullish-Extreme with a score of 89.2 percent.
Our weekly trend-following model classifies the current market price position as: Downtrend. The current action for the model is considered to be: Hold – Maintain Short Position.
| LIVE CATTLE Futures Statistics | SPECULATORS | COMMERCIALS | SMALL TRADERS |
| – Percent of Open Interest Longs: | 26.2 | 40.7 | 12.3 |
| – Percent of Open Interest Shorts: | 17.5 | 49.3 | 12.3 |
| – Net Position: | 23,367 | -23,263 | -104 |
| – Gross Longs: | 70,653 | 109,803 | 33,163 |
| – Gross Shorts: | 47,286 | 133,066 | 33,267 |
| – Long to Short Ratio: | 1.5 to 1 | 0.8 to 1 | 1.0 to 1 |
| NET POSITION TREND: | |||
| – Strength Index Score (3 Year Range Pct): | 4.1 | 94.3 | 89.2 |
| – Strength Index Reading (3 Year Range): | Bearish-Extreme | Bullish-Extreme | Bullish-Extreme |
| NET POSITION MOVEMENT INDEX: | |||
| – 6-Week Change in Strength Index: | -17.8 | 15.9 | 18.3 |
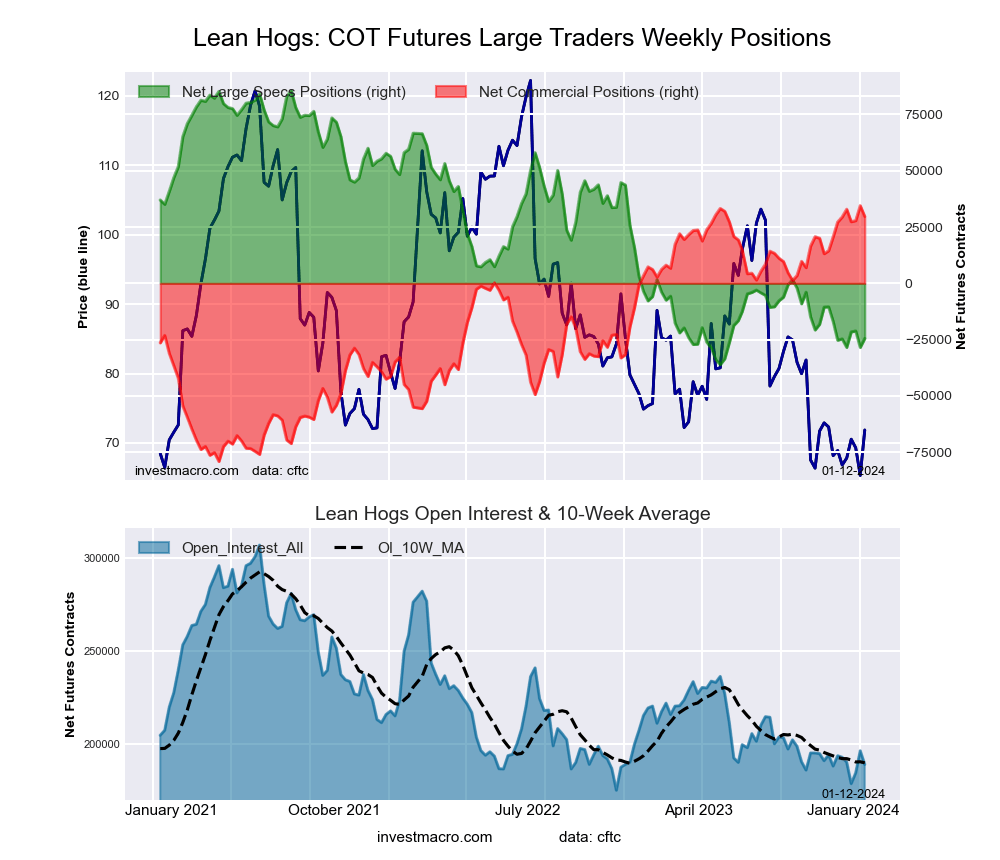
This week’s current strength score (the trader positioning range over the past three years, measured from 0 to 100) shows the speculators are currently Bearish-Extreme with a score of 9.5 percent. The commercials are Bullish-Extreme with a score of 95.7 percent and the small traders (not shown in chart) are Bullish with a score of 60.3 percent.
Our weekly trend-following model classifies the current market price position as: Downtrend. The current action for the model is considered to be: Hold – Maintain Short Position.
| LEAN HOGS Futures Statistics | SPECULATORS | COMMERCIALS | SMALL TRADERS |
| – Percent of Open Interest Longs: | 29.6 | 38.2 | 8.7 |
| – Percent of Open Interest Shorts: | 42.6 | 22.5 | 11.4 |
| – Net Position: | -24,496 | 29,637 | -5,141 |
| – Gross Longs: | 55,979 | 72,177 | 16,359 |
| – Gross Shorts: | 80,475 | 42,540 | 21,500 |
| – Long to Short Ratio: | 0.7 to 1 | 1.7 to 1 | 0.8 to 1 |
| NET POSITION TREND: | |||
| – Strength Index Score (3 Year Range Pct): | 9.5 | 95.7 | 60.3 |
| – Strength Index Reading (3 Year Range): | Bearish-Extreme | Bullish-Extreme | Bullish |
| NET POSITION MOVEMENT INDEX: | |||
| – 6-Week Change in Strength Index: | 0.6 | 2.2 | -14.5 |
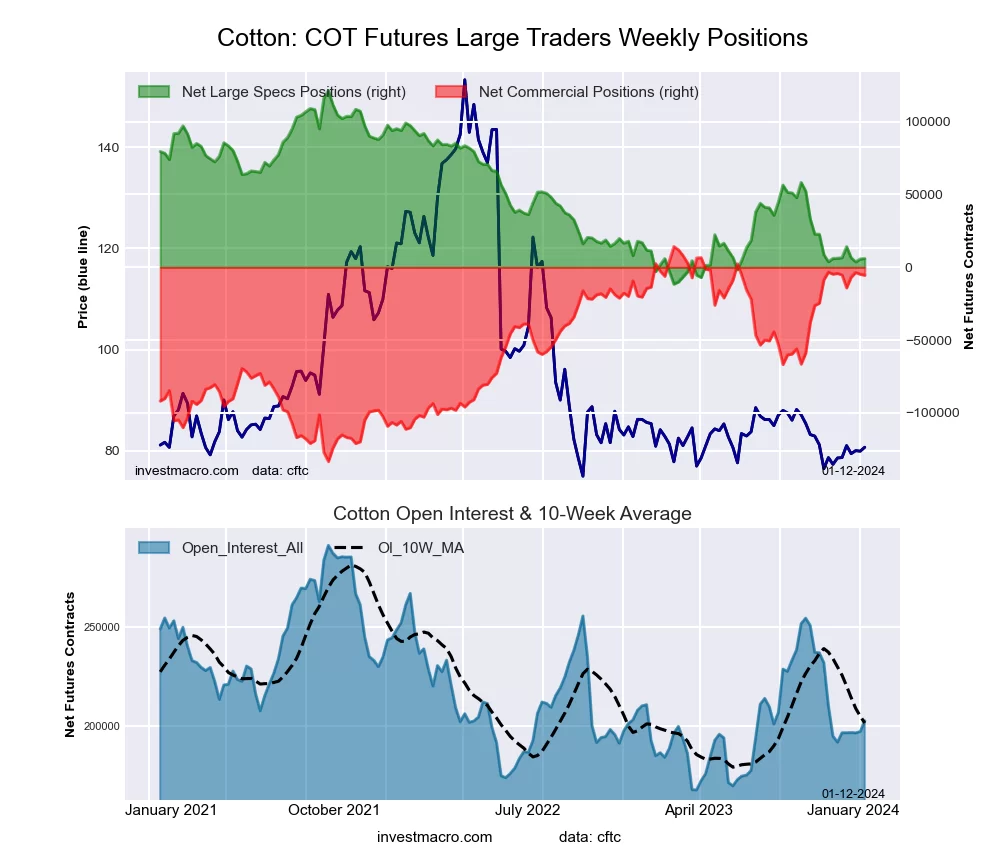
This week’s current strength score (the trader positioning range over the past three years, measured from 0 to 100) shows the speculators are currently Bearish-Extreme with a score of 13.2 percent. The commercials are Bullish-Extreme with a score of 86.6 percent and the small traders (not shown in chart) are Bearish-Extreme with a score of 13.4 percent.
Our weekly trend-following model classifies the current market price position as: Downtrend. The current action for the model is considered to be: Hold – Maintain Short Position.
| COTTON Futures Statistics | SPECULATORS | COMMERCIALS | SMALL TRADERS |
| – Percent of Open Interest Longs: | 28.4 | 45.8 | 6.2 |
| – Percent of Open Interest Shorts: | 25.5 | 48.5 | 6.4 |
| – Net Position: | 5,950 | -5,513 | -437 |
| – Gross Longs: | 57,617 | 92,979 | 12,617 |
| – Gross Shorts: | 51,667 | 98,492 | 13,054 |
| – Long to Short Ratio: | 1.1 to 1 | 0.9 to 1 | 1.0 to 1 |
| NET POSITION TREND: | |||
| – Strength Index Score (3 Year Range Pct): | 13.2 | 86.6 | 13.4 |
| – Strength Index Reading (3 Year Range): | Bearish-Extreme | Bullish-Extreme | Bearish-Extreme |
| NET POSITION MOVEMENT INDEX: | |||
| – 6-Week Change in Strength Index: | -0.2 | -0.9 | 9.2 |
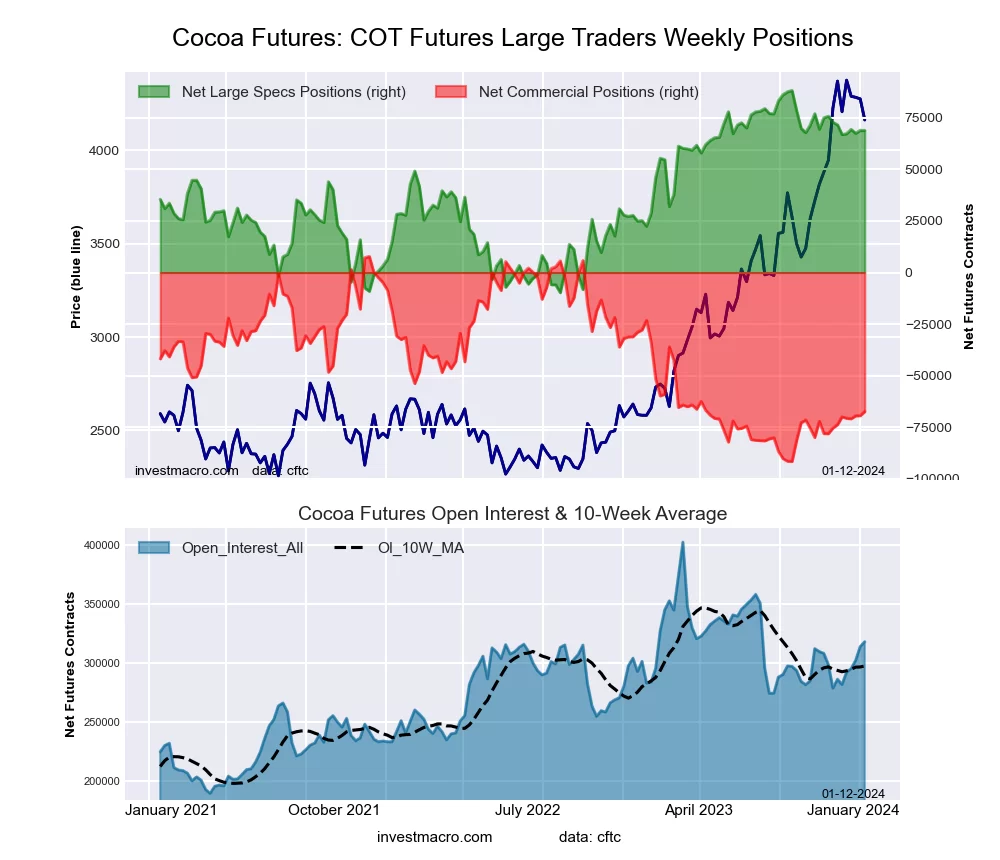
This week’s current strength score (the trader positioning range over the past three years, measured from 0 to 100) shows the speculators are currently Bullish-Extreme with a score of 80.2 percent. The commercials are Bearish with a score of 24.3 percent and the small traders (not shown in chart) are Bearish-Extreme with a score of 0.0 percent.
Our weekly trend-following model classifies the current market price position as: Uptrend. The current action for the model is considered to be: Hold – Maintain Long Position.
| COCOA Futures Statistics | SPECULATORS | COMMERCIALS | SMALL TRADERS |
| – Percent of Open Interest Longs: | 37.6 | 26.6 | 5.0 |
| – Percent of Open Interest Shorts: | 15.9 | 47.8 | 5.4 |
| – Net Position: | 68,881 | -67,423 | -1,458 |
| – Gross Longs: | 119,536 | 84,761 | 15,778 |
| – Gross Shorts: | 50,655 | 152,184 | 17,236 |
| – Long to Short Ratio: | 2.4 to 1 | 0.6 to 1 | 0.9 to 1 |
| NET POSITION TREND: | |||
| – Strength Index Score (3 Year Range Pct): | 80.2 | 24.3 | 0.0 |
| – Strength Index Reading (3 Year Range): | Bullish-Extreme | Bearish | Bearish-Extreme |
| NET POSITION MOVEMENT INDEX: | |||
| – 6-Week Change in Strength Index: | -2.8 | 6.4 | -30.5 |
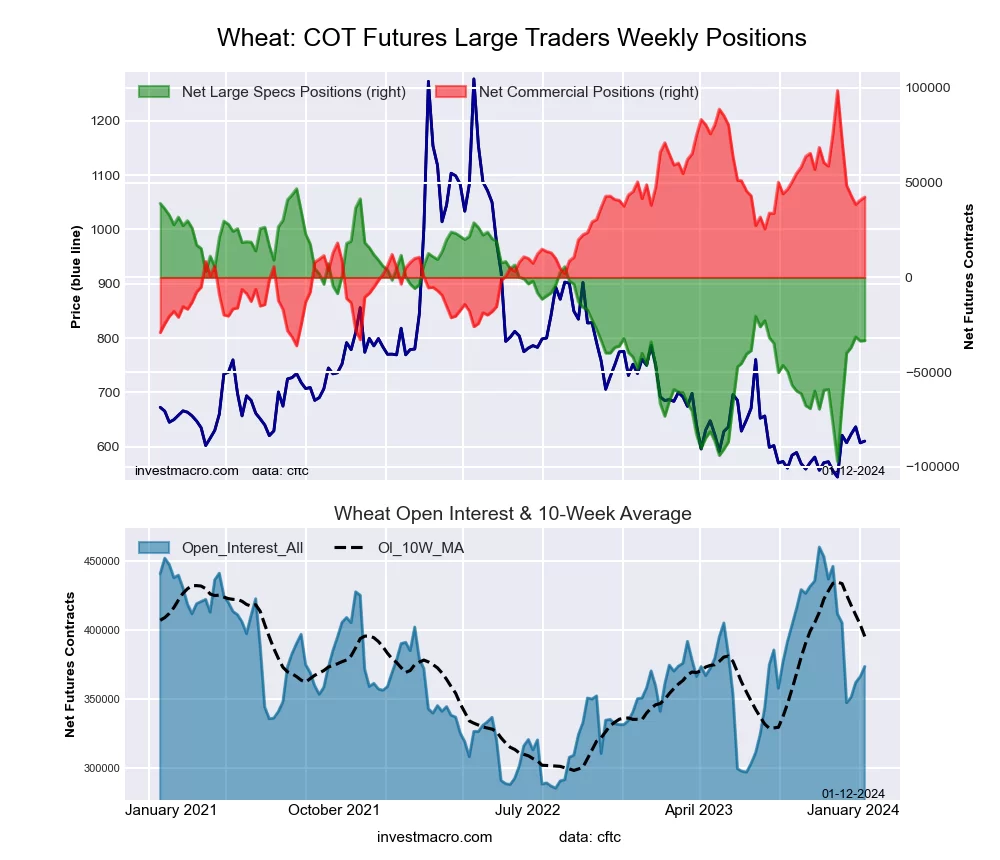
This week’s current strength score (the trader positioning range over the past three years, measured from 0 to 100) shows the speculators are currently Bearish with a score of 44.3 percent. The commercials are Bullish with a score of 58.3 percent and the small traders (not shown in chart) are Bearish with a score of 26.8 percent.
Our weekly trend-following model classifies the current market price position as: Uptrend. The current action for the model is considered to be: Hold – Maintain Long Position.
| WHEAT Futures Statistics | SPECULATORS | COMMERCIALS | SMALL TRADERS |
| – Percent of Open Interest Longs: | 28.8 | 37.1 | 7.8 |
| – Percent of Open Interest Shorts: | 37.8 | 25.7 | 10.2 |
| – Net Position: | -33,390 | 42,432 | -9,042 |
| – Gross Longs: | 107,680 | 138,560 | 29,116 |
| – Gross Shorts: | 141,070 | 96,128 | 38,158 |
| – Long to Short Ratio: | 0.8 to 1 | 1.4 to 1 | 0.8 to 1 |
| NET POSITION TREND: | |||
| – Strength Index Score (3 Year Range Pct): | 44.3 | 58.3 | 26.8 |
| – Strength Index Reading (3 Year Range): | Bearish | Bullish | Bearish |
| NET POSITION MOVEMENT INDEX: | |||
| – 6-Week Change in Strength Index: | 44.3 | -41.7 | -33.0 |
Article By InvestMacro – Receive our weekly COT Newsletter
*COT Report: The COT data, released weekly to the public each Friday, is updated through the most recent Tuesday (data is 3 days old) and shows a quick view of how large speculators or non-commercials (for-profit traders) were positioned in the futures markets.
The CFTC categorizes trader positions according to commercial hedgers (traders who use futures contracts for hedging as part of the business), non-commercials (large traders who speculate to realize trading profits) and nonreportable traders (usually small traders/speculators) as well as their open interest (contracts open in the market at time of reporting). See CFTC criteria here.
By Analytical Department RoboForex Gold fell to 4,033 USD per ounce on Thursday, extending its…
By JustMarkets By the end of the day, the Dow Jones Index (US30) rose by…
By JustMarkets On Tuesday, the US stock indices finished the session in the green, supported…
By Analytical Department RoboForex GBP/USD rose to 1.3403 on Wednesday, with British politics taking centre…
By Analytical Department RoboForex USD/JPY ended Tuesday at 162.27, with the Japanese yen remaining near…
By JustMarkets On Friday, the Dow Jones Index (US30) rose by 0.29% (weekly: -0.36%). The…
This website uses cookies.