By InvestMacro | COT | Data Tables | COT Leaders | Downloads | COT Newsletter
Here are the latest charts and statistics for the Commitment of Traders (COT) data published by the Commodities Futures Trading Commission (CFTC).
The latest COT data is updated through Tuesday October 24th and shows a quick view of how large traders (for-profit speculators and commercial entities) were positioned in the futures markets.
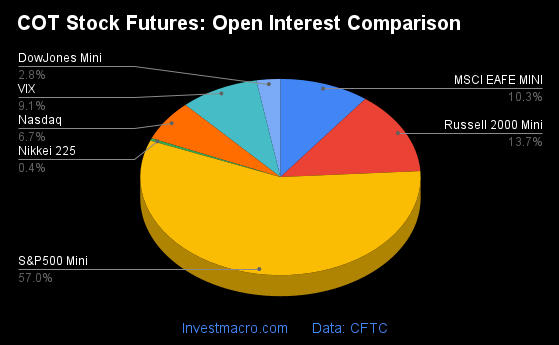
The COT stock markets speculator bets were slightly higher this week as four out of the seven stock markets we cover had higher positioning while the other three markets had lower speculator contracts.
Free Reports:
Leading the gains for the stock markets was a big jump by the S&P500-Mini (73,363 contracts) with the VIX (1,351 contracts), the Russell-Mini (1,301 contracts) and the Nikkei 225 (127 contracts) also showing positive weeks.
The markets with the declines in speculator bets were led this week by the Nasdaq-Mini (-11,651 contracts), the MSCI EAFE-Mini (-2,280 contracts) and the DowJones-Mini (-749 contracts) also registering lower bets on the week.
| Oct-24-2023 | OI | OI-Index | Spec-Net | Spec-Index | Com-Net | COM-Index | Smalls-Net | Smalls-Index |
|---|---|---|---|---|---|---|---|---|
| S&P500-Mini | 2,158,452 | 17 | 10,185 | 66 | -34,736 | 35 | 24,551 | 47 |
| Nikkei 225 | 15,326 | 14 | -2,128 | 52 | 695 | 40 | 1,433 | 46 |
| Nasdaq-Mini | 253,055 | 39 | 2,697 | 43 | -4,366 | 39 | 1,669 | 74 |
| DowJones-Mini | 104,581 | 72 | -35,960 | 0 | 39,649 | 99 | -3,689 | 26 |
| VIX | 344,318 | 44 | -21,594 | 95 | 26,058 | 3 | -4,464 | 74 |
| Nikkei 225 Yen | 53,712 | 42 | 7,280 | 57 | 9,599 | 37 | -16,879 | 53 |
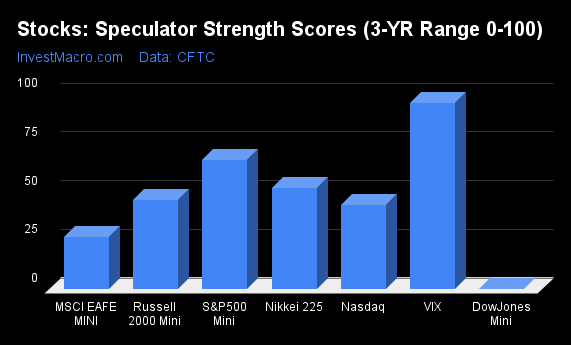
COT Strength Scores (a normalized measure of Speculator positions over a 3-Year range, from 0 to 100 where above 80 is Extreme-Bullish and below 20 is Extreme-Bearish) showed that the VIX (95 percent) and the S&P500-Mini (66 percent) were the leaders for the stock markets this week. The Nikkei 225 (52 percent) came in as the next highest in the weekly strength scores.
On the downside, the DowJones-Mini (0 percent) was at the lowest strength level and is in Extreme-Bearish territory (below 20 percent). The next lowest strength score is the MSCI EAFE-Mini (27 percent).
Strength Statistics:
VIX (95.3 percent) vs VIX previous week (94.4 percent)
S&P500-Mini (66.3 percent) vs S&P500-Mini previous week (55.3 percent)
DowJones-Mini (0.0 percent) vs DowJones-Mini previous week (1.7 percent)
Nasdaq-Mini (43.1 percent) vs Nasdaq-Mini previous week (61.0 percent)
Russell2000-Mini (45.5 percent) vs Russell2000-Mini previous week (44.7 percent)
Nikkei USD (51.8 percent) vs Nikkei USD previous week (50.9 percent)
EAFE-Mini (26.7 percent) vs EAFE-Mini previous week (28.9 percent)
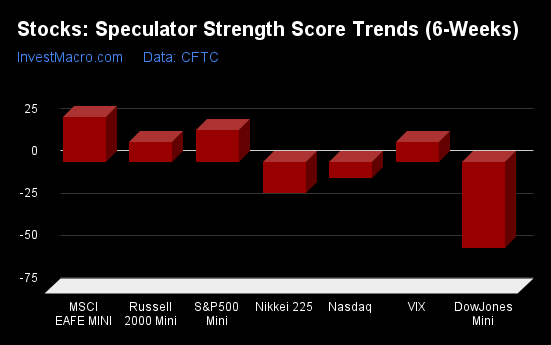
COT Strength Score Trends (or move index, calculates the 6-week changes in strength scores) showed that the MSCI EAFE-Mini (27 percent) leads the past six weeks trends for the stock markets. The S&P500-Mini (19 percent), the VIX (12 percent) and the Russell-Mini (12 percent) are the next highest positive movers in the latest trends data.
The DowJones-Mini (-51 percent) leads the downside trend scores currently with the Nikkei 225 (-19 percent) coming in as the next lowest market.
Strength Trend Statistics:
VIX (11.9 percent) vs VIX previous week (13.3 percent)
S&P500-Mini (18.9 percent) vs S&P500-Mini previous week (12.1 percent)
DowJones-Mini (-51.1 percent) vs DowJones-Mini previous week (-52.0 percent)
Nasdaq-Mini (-9.8 percent) vs Nasdaq-Mini previous week (1.2 percent)
Russell2000-Mini (11.7 percent) vs Russell2000-Mini previous week (15.7 percent)
Nikkei USD (-18.6 percent) vs Nikkei USD previous week (-14.8 percent)
EAFE-Mini (26.7 percent) vs EAFE-Mini previous week (9.5 percent)
This week’s current strength score (the trader positioning range over the past three years, measured from 0 to 100) shows the speculators are currently Bullish-Extreme with a score of 95.3 percent. The commercials are Bearish-Extreme with a score of 2.5 percent and the small traders (not shown in chart) are Bullish with a score of 73.7 percent.
Our weekly trend-following model classifies the current market price position as: Strong Uptrend. The current action for the model is considered to be: Hold – Maintain Long Position.
| VIX Volatility Futures Statistics | SPECULATORS | COMMERCIALS | SMALL TRADERS |
| – Percent of Open Interest Longs: | 25.7 | 47.5 | 7.2 |
| – Percent of Open Interest Shorts: | 32.0 | 40.0 | 8.5 |
| – Net Position: | -21,594 | 26,058 | -4,464 |
| – Gross Longs: | 88,500 | 163,682 | 24,682 |
| – Gross Shorts: | 110,094 | 137,624 | 29,146 |
| – Long to Short Ratio: | 0.8 to 1 | 1.2 to 1 | 0.8 to 1 |
| NET POSITION TREND: | |||
| – Strength Index Score (3 Year Range Pct): | 95.3 | 2.5 | 73.7 |
| – Strength Index Reading (3 Year Range): | Bullish-Extreme | Bearish-Extreme | Bullish |
| NET POSITION MOVEMENT INDEX: | |||
| – 6-Week Change in Strength Index: | 11.9 | -9.4 | -18.9 |
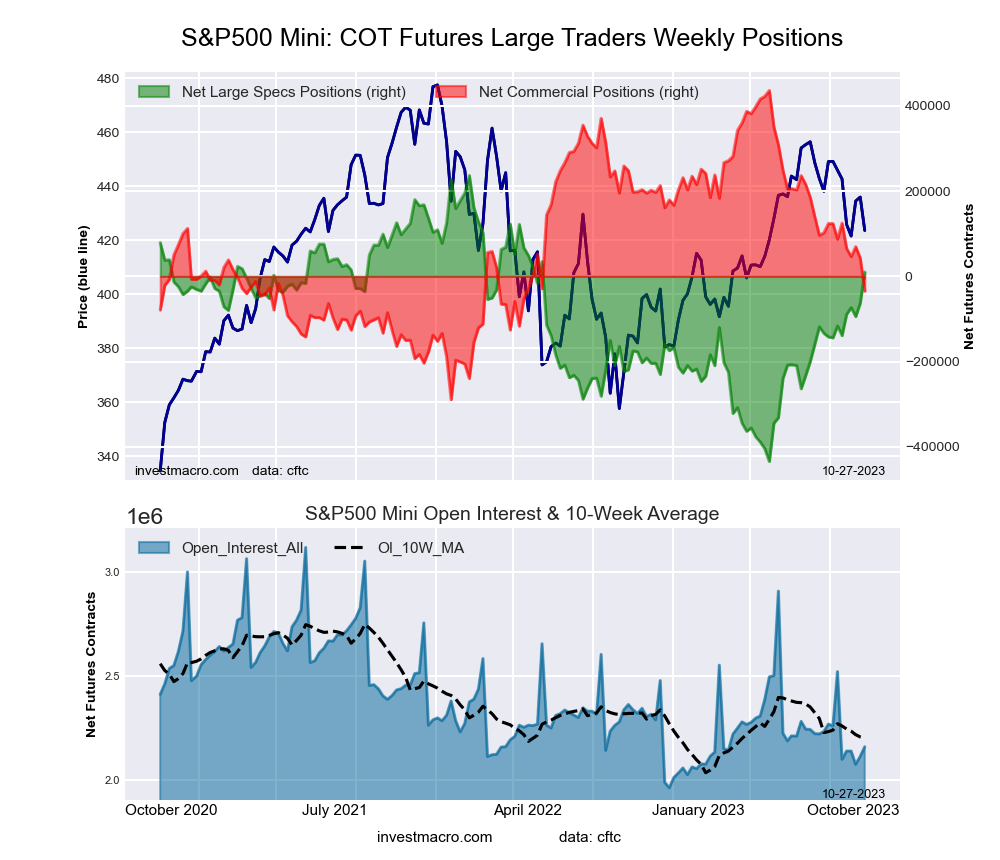
This week’s current strength score (the trader positioning range over the past three years, measured from 0 to 100) shows the speculators are currently Bullish with a score of 66.3 percent. The commercials are Bearish with a score of 35.1 percent and the small traders (not shown in chart) are Bearish with a score of 47.0 percent.
Our weekly trend-following model classifies the current market price position as: Strong Downtrend. The current action for the model is considered to be: Hold – Maintain Short Position.
| S&P500 Mini Futures Statistics | SPECULATORS | COMMERCIALS | SMALL TRADERS |
| – Percent of Open Interest Longs: | 13.1 | 72.4 | 11.5 |
| – Percent of Open Interest Shorts: | 12.6 | 74.0 | 10.4 |
| – Net Position: | 10,185 | -34,736 | 24,551 |
| – Gross Longs: | 282,604 | 1,562,074 | 248,407 |
| – Gross Shorts: | 272,419 | 1,596,810 | 223,856 |
| – Long to Short Ratio: | 1.0 to 1 | 1.0 to 1 | 1.1 to 1 |
| NET POSITION TREND: | |||
| – Strength Index Score (3 Year Range Pct): | 66.3 | 35.1 | 47.0 |
| – Strength Index Reading (3 Year Range): | Bullish | Bearish | Bearish |
| NET POSITION MOVEMENT INDEX: | |||
| – 6-Week Change in Strength Index: | 18.9 | -16.8 | -1.9 |
This week’s current strength score (the trader positioning range over the past three years, measured from 0 to 100) shows the speculators are currently Bearish-Extreme with a score of 0.0 percent. The commercials are Bullish-Extreme with a score of 98.9 percent and the small traders (not shown in chart) are Bearish with a score of 25.9 percent.
Our weekly trend-following model classifies the current market price position as: Strong Downtrend. The current action for the model is considered to be: Hold – Maintain Short Position.
| Dow Jones Mini Futures Statistics | SPECULATORS | COMMERCIALS | SMALL TRADERS |
| – Percent of Open Interest Longs: | 24.1 | 65.1 | 10.4 |
| – Percent of Open Interest Shorts: | 58.4 | 27.1 | 13.9 |
| – Net Position: | -35,960 | 39,649 | -3,689 |
| – Gross Longs: | 25,159 | 68,034 | 10,893 |
| – Gross Shorts: | 61,119 | 28,385 | 14,582 |
| – Long to Short Ratio: | 0.4 to 1 | 2.4 to 1 | 0.7 to 1 |
| NET POSITION TREND: | |||
| – Strength Index Score (3 Year Range Pct): | 0.0 | 98.9 | 25.9 |
| – Strength Index Reading (3 Year Range): | Bearish-Extreme | Bullish-Extreme | Bearish |
| NET POSITION MOVEMENT INDEX: | |||
| – 6-Week Change in Strength Index: | -51.1 | 47.8 | -20.2 |
This week’s current strength score (the trader positioning range over the past three years, measured from 0 to 100) shows the speculators are currently Bearish with a score of 43.1 percent. The commercials are Bearish with a score of 39.1 percent and the small traders (not shown in chart) are Bullish with a score of 73.7 percent.
Our weekly trend-following model classifies the current market price position as: Strong Downtrend. The current action for the model is considered to be: Hold – Maintain Short Position.
| Nasdaq Mini Futures Statistics | SPECULATORS | COMMERCIALS | SMALL TRADERS |
| – Percent of Open Interest Longs: | 27.3 | 56.0 | 15.0 |
| – Percent of Open Interest Shorts: | 26.2 | 57.7 | 14.3 |
| – Net Position: | 2,697 | -4,366 | 1,669 |
| – Gross Longs: | 69,019 | 141,589 | 37,947 |
| – Gross Shorts: | 66,322 | 145,955 | 36,278 |
| – Long to Short Ratio: | 1.0 to 1 | 1.0 to 1 | 1.0 to 1 |
| NET POSITION TREND: | |||
| – Strength Index Score (3 Year Range Pct): | 43.1 | 39.1 | 73.7 |
| – Strength Index Reading (3 Year Range): | Bearish | Bearish | Bullish |
| NET POSITION MOVEMENT INDEX: | |||
| – 6-Week Change in Strength Index: | -9.8 | 6.6 | 3.0 |
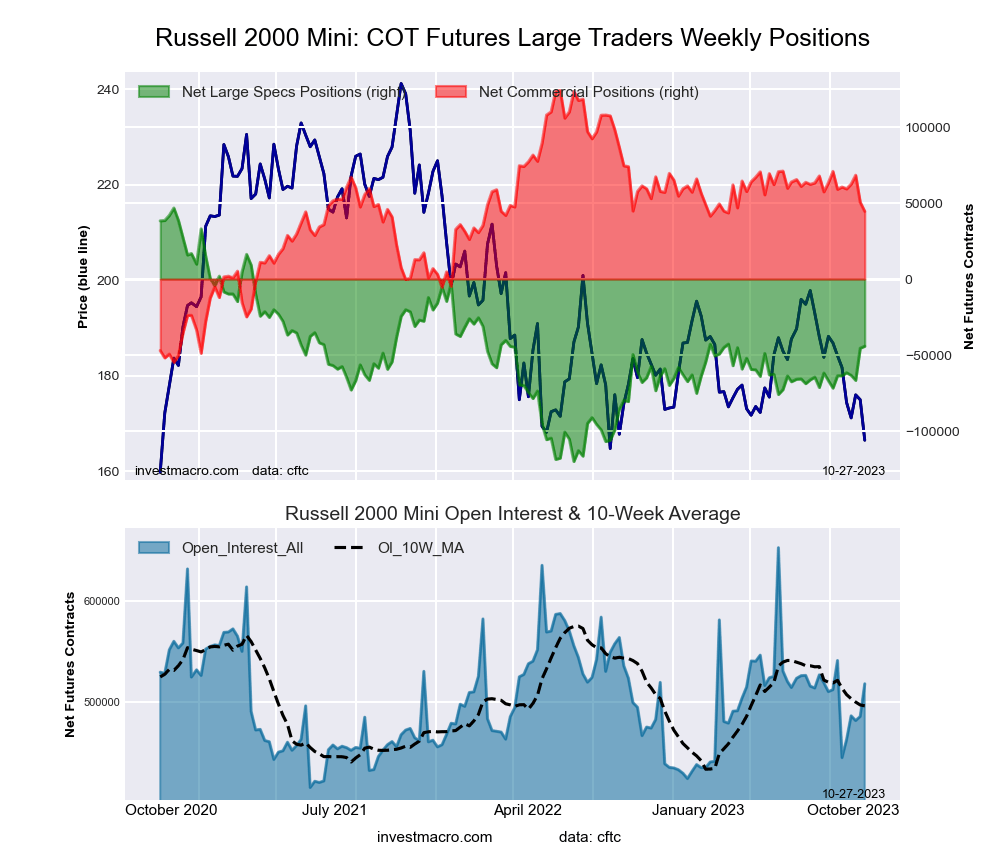
This week’s current strength score (the trader positioning range over the past three years, measured from 0 to 100) shows the speculators are currently Bearish with a score of 45.5 percent. The commercials are Bullish with a score of 55.5 percent and the small traders (not shown in chart) are Bearish with a score of 25.4 percent.
Our weekly trend-following model classifies the current market price position as: Strong Downtrend. The current action for the model is considered to be: Hold – Maintain Short Position.
| Russell 2000 Mini Futures Statistics | SPECULATORS | COMMERCIALS | SMALL TRADERS |
| – Percent of Open Interest Longs: | 14.0 | 79.8 | 4.6 |
| – Percent of Open Interest Shorts: | 22.5 | 71.2 | 4.6 |
| – Net Position: | -44,171 | 44,537 | -366 |
| – Gross Longs: | 72,617 | 413,481 | 23,620 |
| – Gross Shorts: | 116,788 | 368,944 | 23,986 |
| – Long to Short Ratio: | 0.6 to 1 | 1.1 to 1 | 1.0 to 1 |
| NET POSITION TREND: | |||
| – Strength Index Score (3 Year Range Pct): | 45.5 | 55.5 | 25.4 |
| – Strength Index Reading (3 Year Range): | Bearish | Bullish | Bearish |
| NET POSITION MOVEMENT INDEX: | |||
| – 6-Week Change in Strength Index: | 11.7 | -8.1 | -15.3 |
This week’s current strength score (the trader positioning range over the past three years, measured from 0 to 100) shows the speculators are currently Bullish with a score of 51.8 percent. The commercials are Bearish with a score of 40.1 percent and the small traders (not shown in chart) are Bearish with a score of 46.3 percent.
Our weekly trend-following model classifies the current market price position as: Strong Downtrend. The current action for the model is considered to be: Hold – Maintain Short Position.
| Nikkei Stock Average Futures Statistics | SPECULATORS | COMMERCIALS | SMALL TRADERS |
| – Percent of Open Interest Longs: | 5.8 | 70.2 | 24.1 |
| – Percent of Open Interest Shorts: | 19.7 | 65.6 | 14.7 |
| – Net Position: | -2,128 | 695 | 1,433 |
| – Gross Longs: | 884 | 10,754 | 3,688 |
| – Gross Shorts: | 3,012 | 10,059 | 2,255 |
| – Long to Short Ratio: | 0.3 to 1 | 1.1 to 1 | 1.6 to 1 |
| NET POSITION TREND: | |||
| – Strength Index Score (3 Year Range Pct): | 51.8 | 40.1 | 46.3 |
| – Strength Index Reading (3 Year Range): | Bullish | Bearish | Bearish |
| NET POSITION MOVEMENT INDEX: | |||
| – 6-Week Change in Strength Index: | -18.6 | 9.8 | 12.9 |
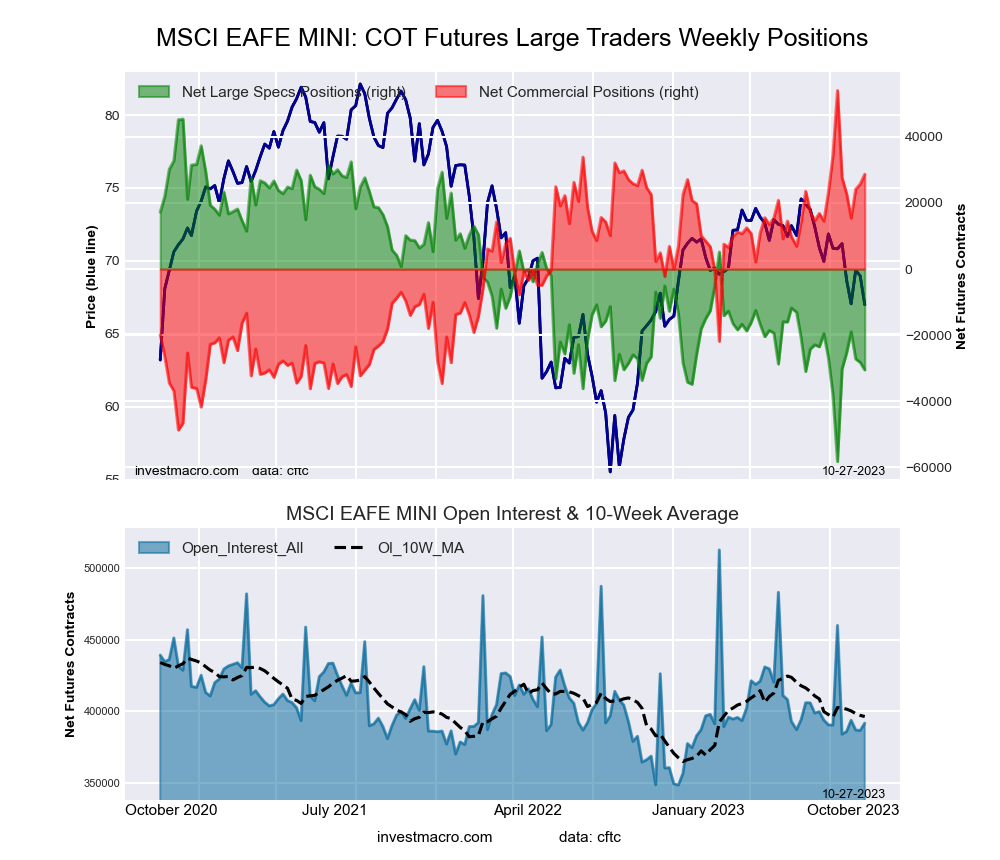
This week’s current strength score (the trader positioning range over the past three years, measured from 0 to 100) shows the speculators are currently Bearish with a score of 26.7 percent. The commercials are Bullish with a score of 75.4 percent and the small traders (not shown in chart) are Bearish with a score of 26.0 percent.
Our weekly trend-following model classifies the current market price position as: Strong Downtrend. The current action for the model is considered to be: Hold – Maintain Short Position.
| MSCI EAFE Mini Futures Statistics | SPECULATORS | COMMERCIALS | SMALL TRADERS |
| – Percent of Open Interest Longs: | 6.5 | 90.0 | 2.6 |
| – Percent of Open Interest Shorts: | 14.3 | 82.7 | 2.2 |
| – Net Position: | -30,499 | 28,700 | 1,799 |
| – Gross Longs: | 25,471 | 352,594 | 10,247 |
| – Gross Shorts: | 55,970 | 323,894 | 8,448 |
| – Long to Short Ratio: | 0.5 to 1 | 1.1 to 1 | 1.2 to 1 |
| NET POSITION TREND: | |||
| – Strength Index Score (3 Year Range Pct): | 26.7 | 75.4 | 26.0 |
| – Strength Index Reading (3 Year Range): | Bearish | Bullish | Bearish |
| NET POSITION MOVEMENT INDEX: | |||
| – 6-Week Change in Strength Index: | 26.7 | -24.6 | -11.8 |
Article By InvestMacro – Receive our weekly COT Reports by Email
*COT Report: The COT data, released weekly to the public each Friday, is updated through the most recent Tuesday (data is 3 days old) and shows a quick view of how large speculators or non-commercials (for-profit traders) were positioned in the futures markets.
The CFTC categorizes trader positions according to commercial hedgers (traders who use futures contracts for hedging as part of the business), non-commercials (large traders who speculate to realize trading profits) and nonreportable traders (usually small traders/speculators) as well as their open interest (contracts open in the market at time of reporting).See CFTC criteria here.
All information and opinions on this website and contained in this article are for general informational purposes only and do not constitute investment advice.
By JustMarkets The US stock market rose on Wednesday. By the end of the day,…
By Daniele D'Alvia, Queen Mary University of London When a conflict escalates, financial markets respond…
By Analytical Department RoboForex GBP/USD contracted to 1.3350 on Thursday, with the pound remaining under…
Opinion -- Source: Michael Ballanger (3/2/26) Michael Ballanger of GGM Advisory Inc. shares his view…
By ForexTime Oil benchmarks surge over 15% since Monday on supply fears Spiking energy prices…
By JustMarkets The US stock market declined sharply on Tuesday. By the end of the…
This website uses cookies.