
By InvestMacro
Here are the latest charts and statistics for the Commitment of Traders (COT) reports data published by the Commodities Futures Trading Commission (CFTC).
The latest COT data is updated through Tuesday September 12th and shows a quick view of how large traders (for-profit speculators and commercial entities) were positioned in the futures markets.
Weekly Speculator Changes led by Sugar & Live Cattle
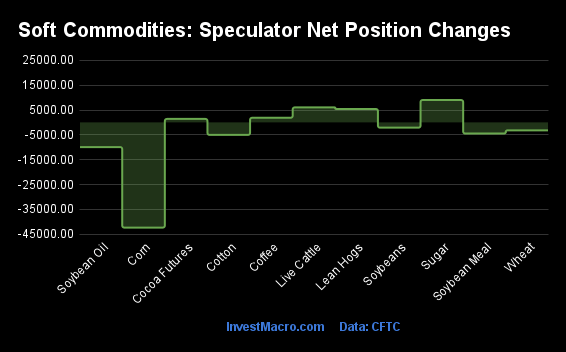
The COT soft commodities markets speculator bets were lower this week as just four out of the eleven softs markets we cover had higher positioning while the other seven markets had lower speculator contracts.
Free Reports:
 Sign Up for Our Stock Market Newsletter – Get updated on News, Charts & Rankings of Public Companies when you join our Stocks Newsletter
 Get our Weekly Commitment of Traders Reports - See where the biggest traders (Hedge Funds and Commercial Hedgers) are positioned in the futures markets on a weekly basis.
Leading the gains for the softs markets was Sugar (9,014 contracts) with Live Cattle (6,055 contracts), Lean Hogs (5,402 contracts) and Cocoa (1,403 contracts) also having positive weeks.
The markets with the declines in speculator bets this week were Corn (-42,356 contracts) with Coffee (-18,522 contracts), Soybean Oil (-9,933 contracts), Cotton (-5,028 contracts), Soybean Meal (-4,467 contracts), Wheat (-3,209 contracts) and Soybeans (-2,112 contracts) also registering lower bets on the week.
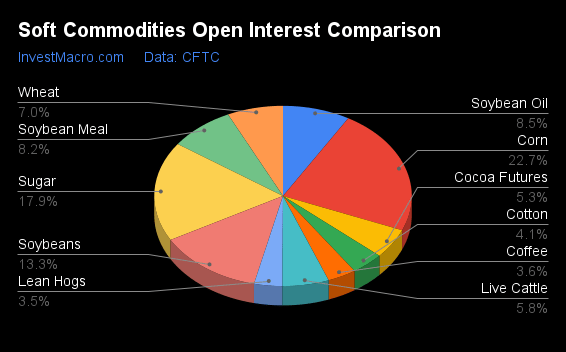
| Sep-12-2023 | OI | OI-Index | Spec-Net | Spec-Index | Com-Net | COM-Index | Smalls-Net | Smalls-Index |
|---|---|---|---|---|---|---|---|---|
| WTI Crude | 1,791,696 | 35 | 326,871 | 47 | -348,713 | 57 | 21,842 | 24 |
| Gold | 441,221 | 9 | 123,864 | 32 | -144,810 | 68 | 20,946 | 32 |
| Silver | 125,292 | 14 | 18,033 | 44 | -32,040 | 55 | 14,007 | 44 |
| Copper | 196,198 | 39 | -12,334 | 20 | 9,886 | 80 | 2,448 | 34 |
| Palladium | 17,838 | 82 | -10,712 | 2 | 10,761 | 99 | -49 | 39 |
| Platinum | 87,021 | 100 | 6,721 | 31 | -12,396 | 68 | 5,675 | 44 |
| Natural Gas | 1,171,747 | 44 | -112,044 | 27 | 86,523 | 74 | 25,521 | 41 |
| Brent | 136,160 | 13 | -48,610 | 17 | 47,945 | 90 | 665 | 18 |
| Heating Oil | 334,395 | 50 | 36,922 | 92 | -62,799 | 7 | 25,877 | 88 |
| Soybeans | 740,047 | 36 | 85,217 | 23 | -68,440 | 73 | -16,777 | 64 |
| Corn | 1,268,176 | 10 | -87,988 | 0 | 118,836 | 100 | -30,848 | 90 |
| Coffee | 180,118 | 3 | 8,495 | 36 | -8,052 | 68 | -443 | 7 |
| Sugar | 996,532 | 70 | 244,435 | 77 | -297,725 | 19 | 53,290 | 72 |
| Wheat | 391,669 | 61 | -49,619 | 32 | 46,521 | 66 | 3,098 | 82 |
Strength Scores led by Cocoa & Live Cattle
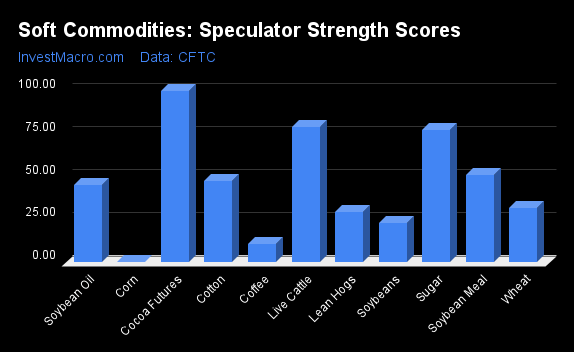
COT Strength Scores (a normalized measure of Speculator positions over a 3-Year range, from 0 to 100 where above 80 is Extreme-Bullish and below 20 is Extreme-Bearish) showed that Cocoa (100 percent) and Live Cattle (79 percent) lead the softs markets this week. Sugar (77 percent), Soybean Meal (51 percent) and Cotton (47 percent) come in as the next highest in the weekly strength scores.
On the downside, Corn (0 percent) comes in at the lowest strength levels currently and is in Extreme-Bearish territory (below 20 percent). The next lowest strength scores are Soybeans (23 percent), Lean Hogs (29 percent) and Wheat (32 percent).
Strength Statistics:
Corn (0.0 percent) vs Corn previous week (6.7 percent)
Sugar (77.3 percent) vs Sugar previous week (74.1 percent)
Coffee (36.1 percent) vs Coffee previous week (61.8 percent)
Soybeans (22.6 percent) vs Soybeans previous week (23.5 percent)
Soybean Oil (44.8 percent) vs Soybean Oil previous week (50.6 percent)
Soybean Meal (50.6 percent) vs Soybean Meal previous week (53.1 percent)
Live Cattle (78.7 percent) vs Live Cattle previous week (72.2 percent)
Lean Hogs (29.1 percent) vs Lean Hogs previous week (24.6 percent)
Cotton (47.4 percent) vs Cotton previous week (51.2 percent)
Cocoa (100.0 percent) vs Cocoa previous week (98.6 percent)
Wheat (31.5 percent) vs Wheat previous week (33.8 percent)
Sugar & Cocoa top the 6-Week Strength Trends
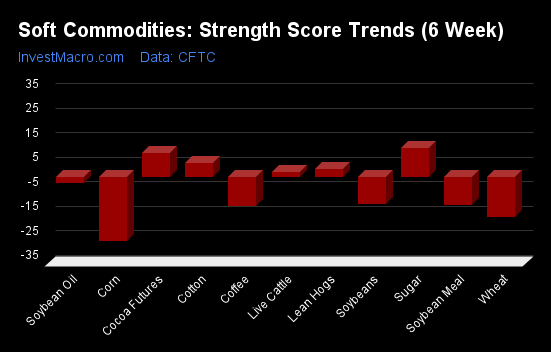
COT Strength Score Trends (or move index, calculates the 6-week changes in strength scores) showed that Sugar (12 percent) and Cocoa (10 percent) lead the past six weeks trends for soft commodities. Cotton (6 percent), Lean Hogs (3 percent) and Live Cattle (2 percent) are the next highest positive movers in the latest trends data.
Corn (-26 percent) leads the downside trend scores currently with Coffee (-23 percent), Wheat (-17 percent) and Soybean Meal (-12 percent) following next with lower trend scores.
Strength Trend Statistics:
Corn (-26.4 percent) vs Corn previous week (-18.3 percent)
Sugar (11.6 percent) vs Sugar previous week (5.5 percent)
Coffee (-23.1 percent) vs Coffee previous week (-0.0 percent)
Soybeans (-11.2 percent) vs Soybeans previous week (-18.7 percent)
Soybean Oil (-2.6 percent) vs Soybean Oil previous week (1.1 percent)
Soybean Meal (-11.8 percent) vs Soybean Meal previous week (-7.6 percent)
Live Cattle (1.7 percent) vs Live Cattle previous week (-9.5 percent)
Lean Hogs (2.9 percent) vs Lean Hogs previous week (-2.6 percent)
Cotton (5.6 percent) vs Cotton previous week (13.9 percent)
Cocoa (9.7 percent) vs Cocoa previous week (8.5 percent)
Wheat (-16.7 percent) vs Wheat previous week (-18.4 percent)
Individual Soft Commodities Markets:
CORN Futures:
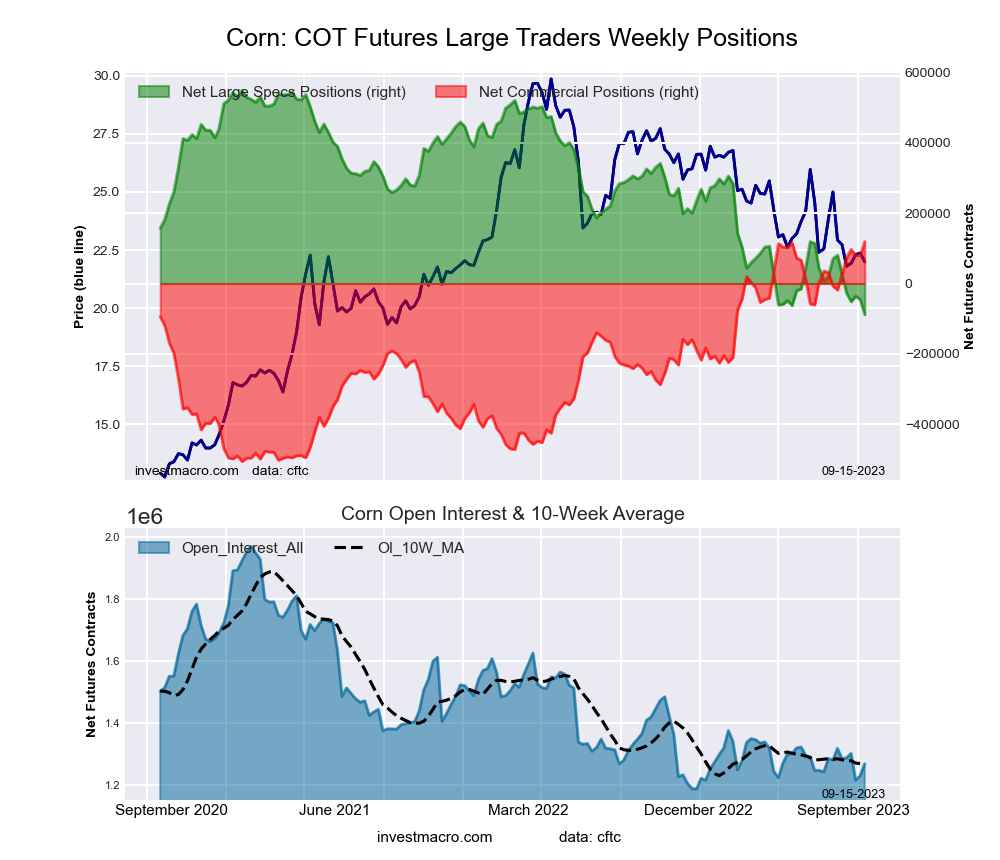 The CORN large speculator standing this week reached a net position of -87,988 contracts in the data reported through Tuesday. This was a weekly decline of -42,356 contracts from the previous week which had a total of -45,632 net contracts.
This week’s current strength score (the trader positioning range over the past three years, measured from 0 to 100) shows the speculators are currently Bearish-Extreme with a score of 0.0 percent. The commercials are Bullish-Extreme with a score of 100.0 percent and the small traders (not shown in chart) are Bullish-Extreme with a score of 89.9 percent.
Price Trend-Following Model: Strong Downtrend
Our weekly trend-following model classifies the current market price position as: Strong Downtrend. The current action for the model is considered to be: Hold – Maintain Short Position.
| CORN Futures Statistics | SPECULATORS | COMMERCIALS | SMALL TRADERS |
| – Percent of Open Interest Longs: | 20.9 | 49.5 | 10.3 |
| – Percent of Open Interest Shorts: | 27.8 | 40.2 | 12.7 |
| – Net Position: | -87,988 | 118,836 | -30,848 |
| – Gross Longs: | 264,473 | 628,085 | 130,320 |
| – Gross Shorts: | 352,461 | 509,249 | 161,168 |
| – Long to Short Ratio: | 0.8 to 1 | 1.2 to 1 | 0.8 to 1 |
| NET POSITION TREND: | |||
| – Strength Index Score (3 Year Range Pct): | 0.0 | 100.0 | 89.9 |
| – Strength Index Reading (3 Year Range): | Bearish-Extreme | Bullish-Extreme | Bullish-Extreme |
| NET POSITION MOVEMENT INDEX: | |||
| – 6-Week Change in Strength Index: | -26.4 | 22.0 | 55.4 |
SUGAR Futures:
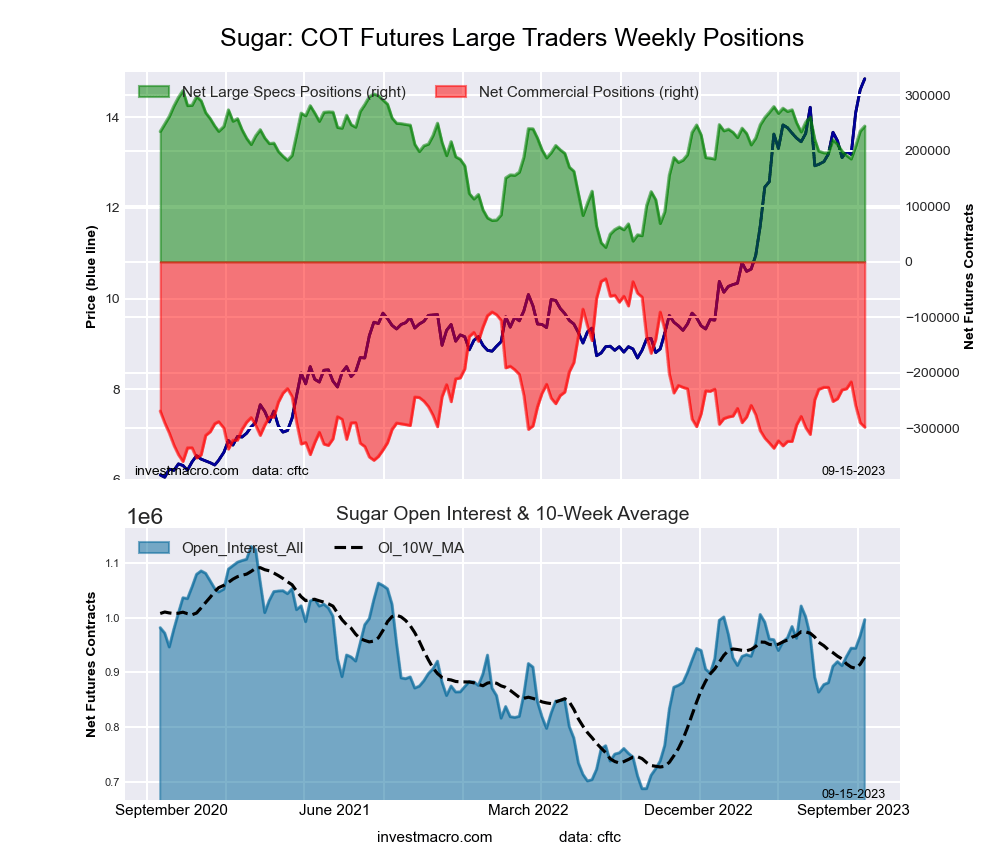 The SUGAR large speculator standing this week reached a net position of 244,435 contracts in the data reported through Tuesday. This was a weekly lift of 9,014 contracts from the previous week which had a total of 235,421 net contracts.
This week’s current strength score (the trader positioning range over the past three years, measured from 0 to 100) shows the speculators are currently Bullish with a score of 77.3 percent. The commercials are Bearish-Extreme with a score of 18.8 percent and the small traders (not shown in chart) are Bullish with a score of 72.0 percent.
Price Trend-Following Model: Strong Uptrend
Our weekly trend-following model classifies the current market price position as: Strong Uptrend. The current action for the model is considered to be: Hold – Maintain Long Position.
| SUGAR Futures Statistics | SPECULATORS | COMMERCIALS | SMALL TRADERS |
| – Percent of Open Interest Longs: | 33.0 | 44.8 | 9.9 |
| – Percent of Open Interest Shorts: | 8.4 | 74.7 | 4.6 |
| – Net Position: | 244,435 | -297,725 | 53,290 |
| – Gross Longs: | 328,566 | 446,542 | 98,865 |
| – Gross Shorts: | 84,131 | 744,267 | 45,575 |
| – Long to Short Ratio: | 3.9 to 1 | 0.6 to 1 | 2.2 to 1 |
| NET POSITION TREND: | |||
| – Strength Index Score (3 Year Range Pct): | 77.3 | 18.8 | 72.0 |
| – Strength Index Reading (3 Year Range): | Bullish | Bearish-Extreme | Bullish |
| NET POSITION MOVEMENT INDEX: | |||
| – 6-Week Change in Strength Index: | 11.6 | -15.6 | 24.2 |
COFFEE Futures:
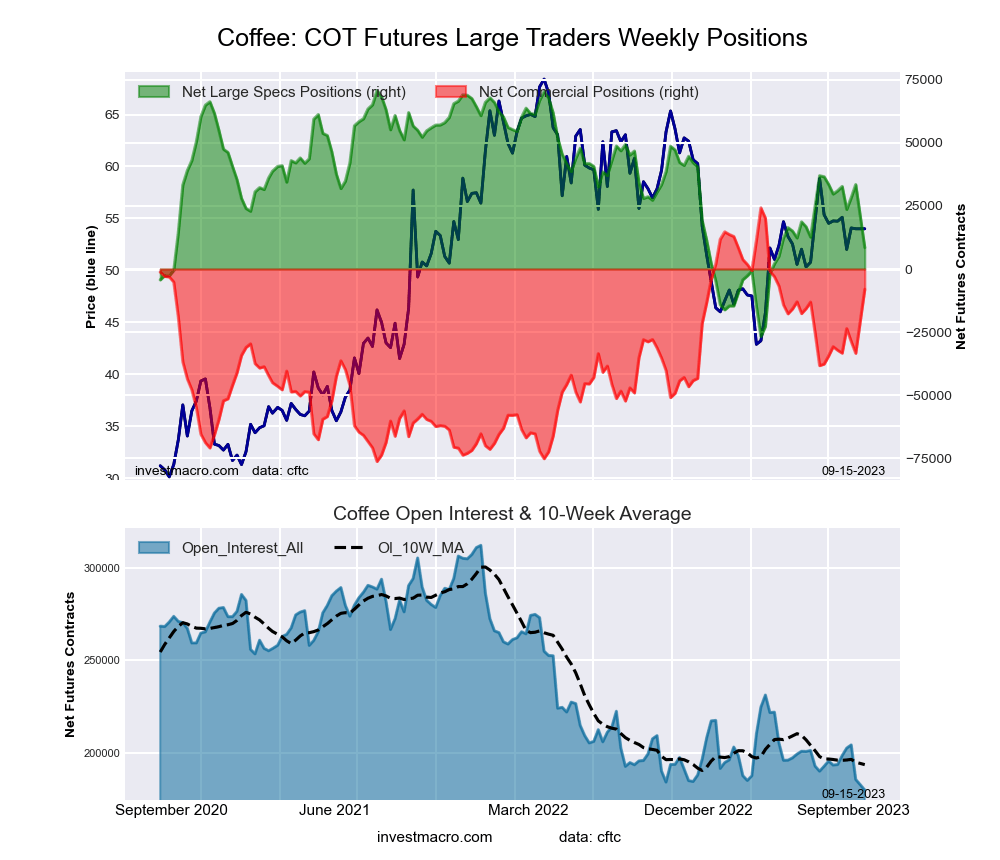 The COFFEE large speculator standing this week reached a net position of 8,495 contracts in the data reported through Tuesday. This was a weekly fall of -18,522 contracts from the previous week which had a total of 33,494 net contracts.
This week’s current strength score (the trader positioning range over the past three years, measured from 0 to 100) shows the speculators are currently Bearish with a score of 36.1 percent. The commercials are Bullish with a score of 67.9 percent and the small traders (not shown in chart) are Bearish-Extreme with a score of 7.3 percent.
Price Trend-Following Model: Uptrend
Our weekly trend-following model classifies the current market price position as: Uptrend. The current action for the model is considered to be: Hold – Maintain Long Position.
| COFFEE Futures Statistics | SPECULATORS | COMMERCIALS | SMALL TRADERS |
| – Percent of Open Interest Longs: | 23.4 | 47.0 | 3.7 |
| – Percent of Open Interest Shorts: | 18.7 | 51.4 | 3.9 |
| – Net Position: | 8,495 | -8,052 | -443 |
| – Gross Longs: | 42,190 | 84,606 | 6,662 |
| – Gross Shorts: | 33,695 | 92,658 | 7,105 |
| – Long to Short Ratio: | 1.3 to 1 | 0.9 to 1 | 0.9 to 1 |
| NET POSITION TREND: | |||
| – Strength Index Score (3 Year Range Pct): | 36.1 | 67.9 | 7.3 |
| – Strength Index Reading (3 Year Range): | Bearish | Bullish | Bearish-Extreme |
| NET POSITION MOVEMENT INDEX: | |||
| – 6-Week Change in Strength Index: | -23.1 | 24.0 | -19.8 |
SOYBEANS Futures:
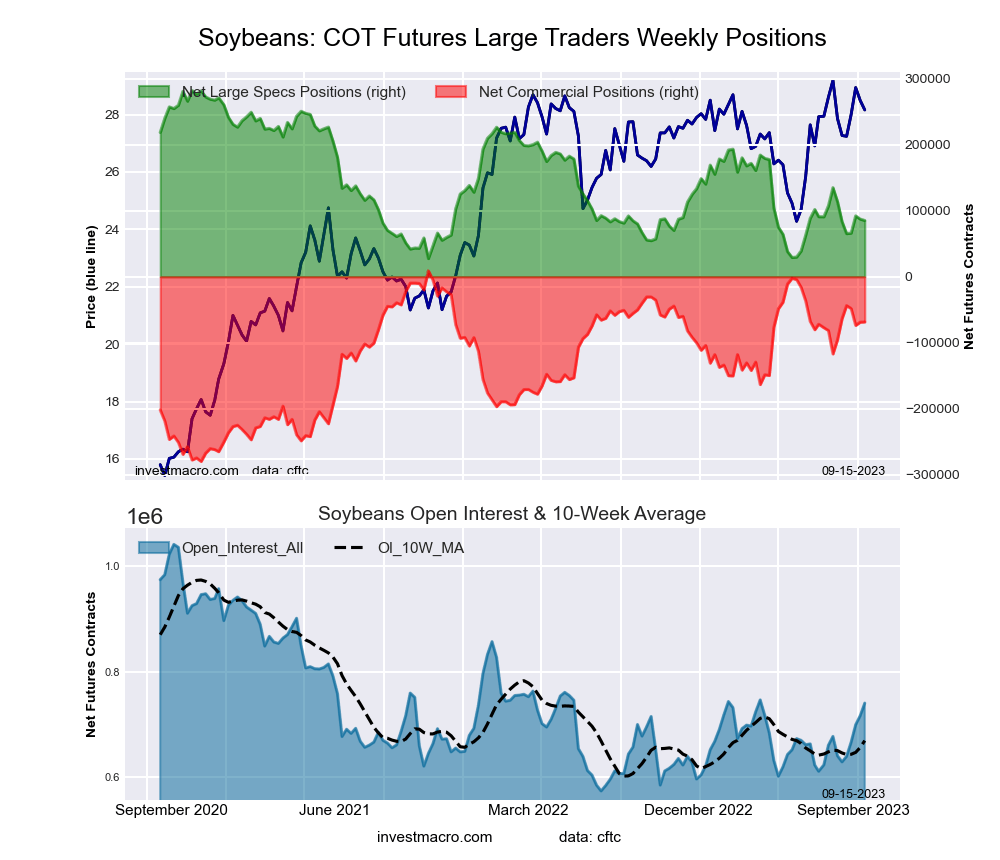 The SOYBEANS large speculator standing this week reached a net position of 85,217 contracts in the data reported through Tuesday. This was a weekly decline of -2,112 contracts from the previous week which had a total of 87,329 net contracts.
This week’s current strength score (the trader positioning range over the past three years, measured from 0 to 100) shows the speculators are currently Bearish with a score of 22.6 percent. The commercials are Bullish with a score of 73.2 percent and the small traders (not shown in chart) are Bullish with a score of 63.6 percent.
Price Trend-Following Model: Uptrend
Our weekly trend-following model classifies the current market price position as: Uptrend. The current action for the model is considered to be: Hold – Maintain Long Position.
| SOYBEANS Futures Statistics | SPECULATORS | COMMERCIALS | SMALL TRADERS |
| – Percent of Open Interest Longs: | 22.0 | 49.5 | 6.7 |
| – Percent of Open Interest Shorts: | 10.5 | 58.8 | 9.0 |
| – Net Position: | 85,217 | -68,440 | -16,777 |
| – Gross Longs: | 162,761 | 366,434 | 49,882 |
| – Gross Shorts: | 77,544 | 434,874 | 66,659 |
| – Long to Short Ratio: | 2.1 to 1 | 0.8 to 1 | 0.7 to 1 |
| NET POSITION TREND: | |||
| – Strength Index Score (3 Year Range Pct): | 22.6 | 73.2 | 63.6 |
| – Strength Index Reading (3 Year Range): | Bearish | Bullish | Bullish |
| NET POSITION MOVEMENT INDEX: | |||
| – 6-Week Change in Strength Index: | -11.2 | 9.3 | 3.9 |
SOYBEAN OIL Futures:
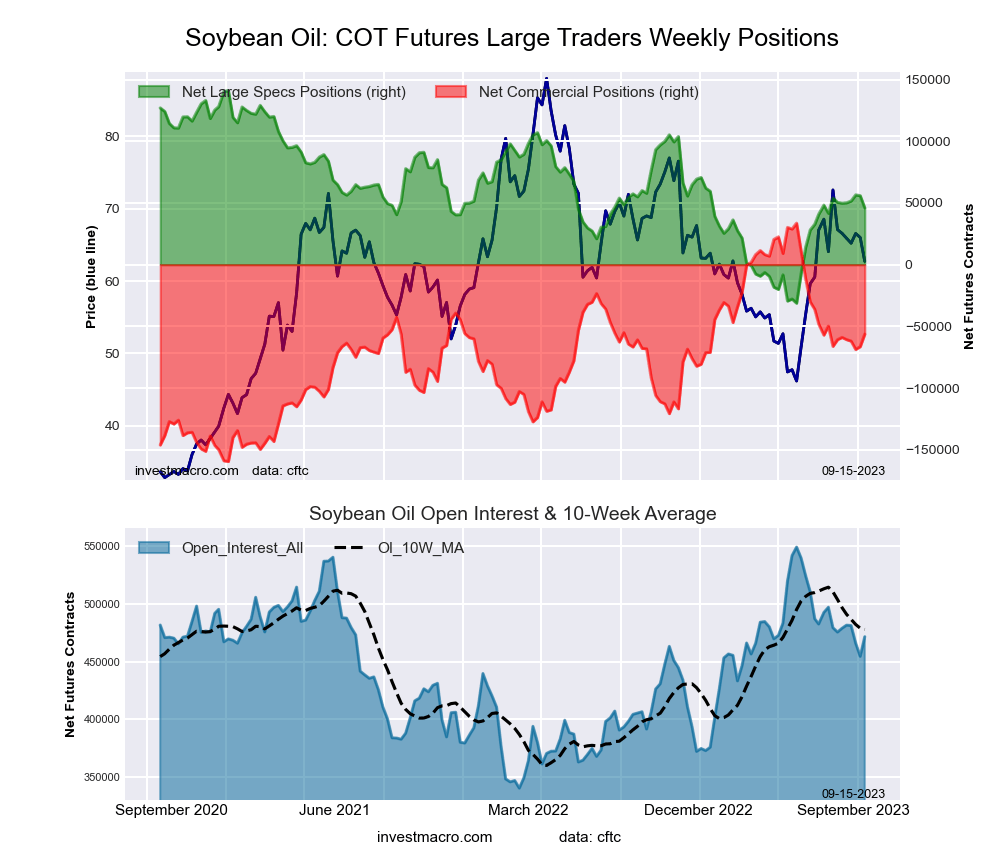 The SOYBEAN OIL large speculator standing this week reached a net position of 46,002 contracts in the data reported through Tuesday. This was a weekly decrease of -9,933 contracts from the previous week which had a total of 55,935 net contracts.
This week’s current strength score (the trader positioning range over the past three years, measured from 0 to 100) shows the speculators are currently Bearish with a score of 44.8 percent. The commercials are Bullish with a score of 53.4 percent and the small traders (not shown in chart) are Bullish with a score of 52.1 percent.
Price Trend-Following Model: Uptrend
Our weekly trend-following model classifies the current market price position as: Uptrend. The current action for the model is considered to be: Hold – Maintain Long Position.
| SOYBEAN OIL Futures Statistics | SPECULATORS | COMMERCIALS | SMALL TRADERS |
| – Percent of Open Interest Longs: | 20.6 | 50.9 | 6.7 |
| – Percent of Open Interest Shorts: | 10.8 | 62.9 | 4.5 |
| – Net Position: | 46,002 | -56,338 | 10,336 |
| – Gross Longs: | 97,027 | 240,105 | 31,734 |
| – Gross Shorts: | 51,025 | 296,443 | 21,398 |
| – Long to Short Ratio: | 1.9 to 1 | 0.8 to 1 | 1.5 to 1 |
| NET POSITION TREND: | |||
| – Strength Index Score (3 Year Range Pct): | 44.8 | 53.4 | 52.1 |
| – Strength Index Reading (3 Year Range): | Bearish | Bullish | Bullish |
| NET POSITION MOVEMENT INDEX: | |||
| – 6-Week Change in Strength Index: | -2.6 | 2.3 | 0.1 |
SOYBEAN MEAL Futures:
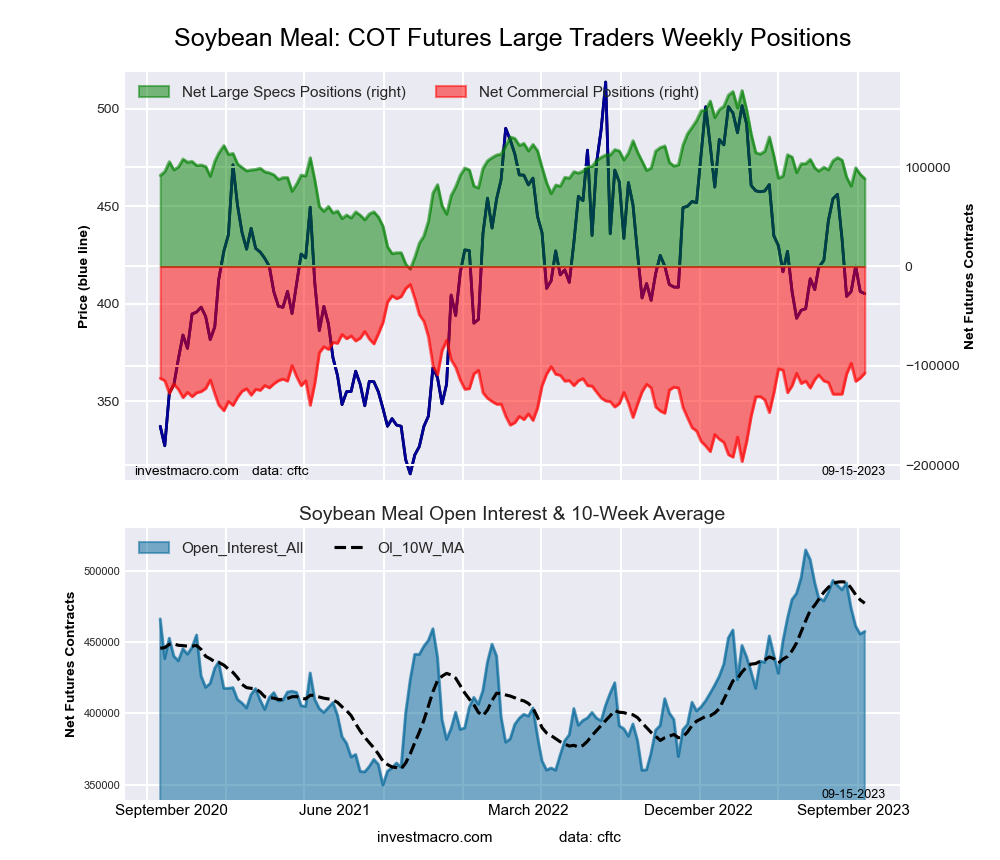 The SOYBEAN MEAL large speculator standing this week reached a net position of 88,283 contracts in the data reported through Tuesday. This was a weekly decline of -4,467 contracts from the previous week which had a total of 92,750 net contracts.
This week’s current strength score (the trader positioning range over the past three years, measured from 0 to 100) shows the speculators are currently Bullish with a score of 50.6 percent. The commercials are Bearish with a score of 49.9 percent and the small traders (not shown in chart) are Bearish with a score of 40.6 percent.
Price Trend-Following Model: Weak Uptrend
Our weekly trend-following model classifies the current market price position as: Weak Uptrend. The current action for the model is considered to be: Hold – Maintain Long Position.
| SOYBEAN MEAL Futures Statistics | SPECULATORS | COMMERCIALS | SMALL TRADERS |
| – Percent of Open Interest Longs: | 23.9 | 41.4 | 9.6 |
| – Percent of Open Interest Shorts: | 4.6 | 64.8 | 5.5 |
| – Net Position: | 88,283 | -107,255 | 18,972 |
| – Gross Longs: | 109,513 | 189,177 | 43,929 |
| – Gross Shorts: | 21,230 | 296,432 | 24,957 |
| – Long to Short Ratio: | 5.2 to 1 | 0.6 to 1 | 1.8 to 1 |
| NET POSITION TREND: | |||
| – Strength Index Score (3 Year Range Pct): | 50.6 | 49.9 | 40.6 |
| – Strength Index Reading (3 Year Range): | Bullish | Bearish | Bearish |
| NET POSITION MOVEMENT INDEX: | |||
| – 6-Week Change in Strength Index: | -11.8 | 11.9 | 0.1 |
LIVE CATTLE Futures:
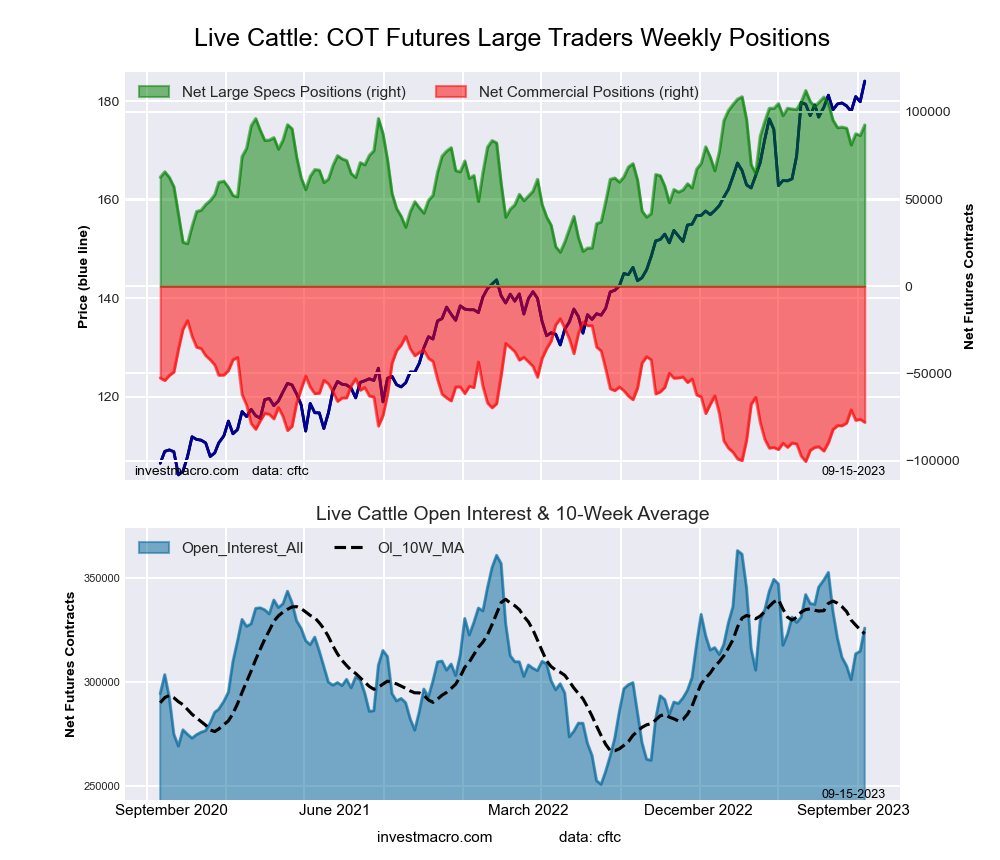 The LIVE CATTLE large speculator standing this week reached a net position of 92,544 contracts in the data reported through Tuesday. This was a weekly boost of 6,055 contracts from the previous week which had a total of 86,489 net contracts.
This week’s current strength score (the trader positioning range over the past three years, measured from 0 to 100) shows the speculators are currently Bullish with a score of 78.7 percent. The commercials are Bearish with a score of 27.4 percent and the small traders (not shown in chart) are Bearish-Extreme with a score of 8.5 percent.
Price Trend-Following Model: Strong Uptrend
Our weekly trend-following model classifies the current market price position as: Strong Uptrend. The current action for the model is considered to be: Hold – Maintain Long Position.
| LIVE CATTLE Futures Statistics | SPECULATORS | COMMERCIALS | SMALL TRADERS |
| – Percent of Open Interest Longs: | 44.3 | 28.6 | 8.6 |
| – Percent of Open Interest Shorts: | 15.9 | 52.6 | 13.1 |
| – Net Position: | 92,544 | -77,999 | -14,545 |
| – Gross Longs: | 144,383 | 93,333 | 28,157 |
| – Gross Shorts: | 51,839 | 171,332 | 42,702 |
| – Long to Short Ratio: | 2.8 to 1 | 0.5 to 1 | 0.7 to 1 |
| NET POSITION TREND: | |||
| – Strength Index Score (3 Year Range Pct): | 78.7 | 27.4 | 8.5 |
| – Strength Index Reading (3 Year Range): | Bullish | Bearish | Bearish-Extreme |
| NET POSITION MOVEMENT INDEX: | |||
| – 6-Week Change in Strength Index: | 1.7 | 2.3 | -19.3 |
LEAN HOGS Futures:
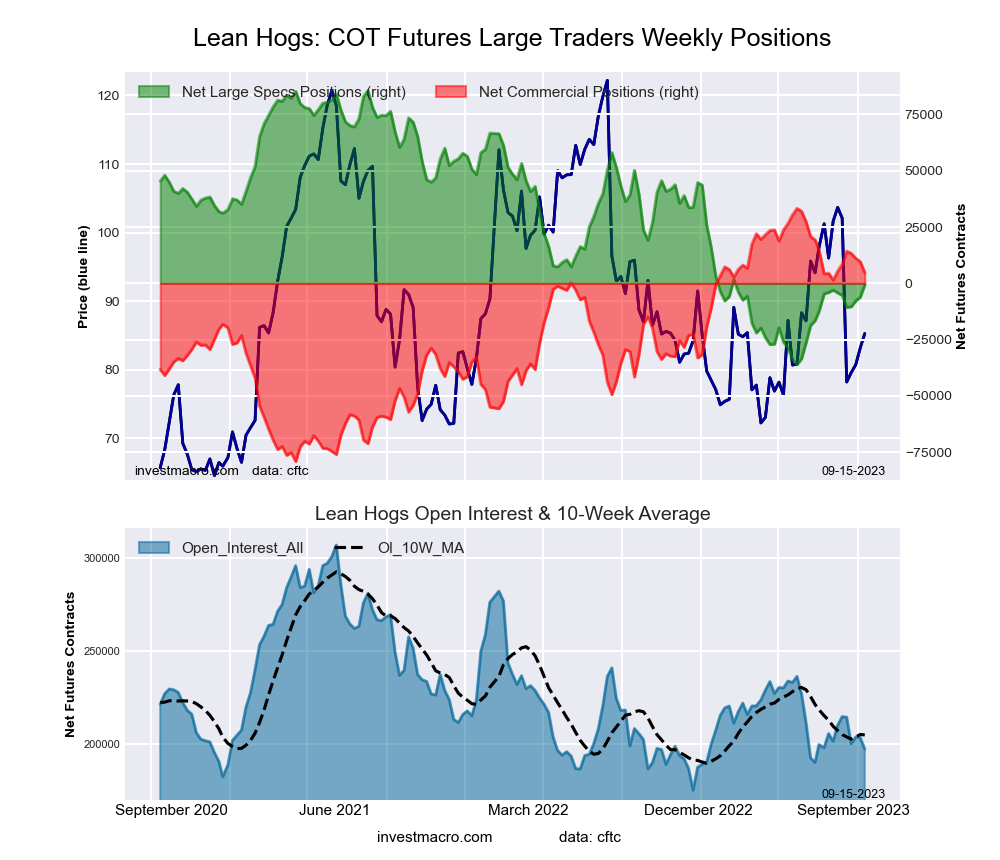 The LEAN HOGS large speculator standing this week reached a net position of -730 contracts in the data reported through Tuesday. This was a weekly advance of 5,402 contracts from the previous week which had a total of -6,132 net contracts.
This week’s current strength score (the trader positioning range over the past three years, measured from 0 to 100) shows the speculators are currently Bearish with a score of 29.1 percent. The commercials are Bullish with a score of 74.6 percent and the small traders (not shown in chart) are Bullish with a score of 65.5 percent.
Price Trend-Following Model: Weak Uptrend
Our weekly trend-following model classifies the current market price position as: Weak Uptrend. The current action for the model is considered to be: Hold – Maintain Long Position.
| LEAN HOGS Futures Statistics | SPECULATORS | COMMERCIALS | SMALL TRADERS |
| – Percent of Open Interest Longs: | 33.7 | 37.5 | 9.8 |
| – Percent of Open Interest Shorts: | 34.1 | 35.1 | 11.8 |
| – Net Position: | -730 | 4,709 | -3,979 |
| – Gross Longs: | 66,425 | 73,897 | 19,379 |
| – Gross Shorts: | 67,155 | 69,188 | 23,358 |
| – Long to Short Ratio: | 1.0 to 1 | 1.1 to 1 | 0.8 to 1 |
| NET POSITION TREND: | |||
| – Strength Index Score (3 Year Range Pct): | 29.1 | 74.6 | 65.5 |
| – Strength Index Reading (3 Year Range): | Bearish | Bullish | Bullish |
| NET POSITION MOVEMENT INDEX: | |||
| – 6-Week Change in Strength Index: | 2.9 | -0.6 | -12.7 |
COTTON Futures:
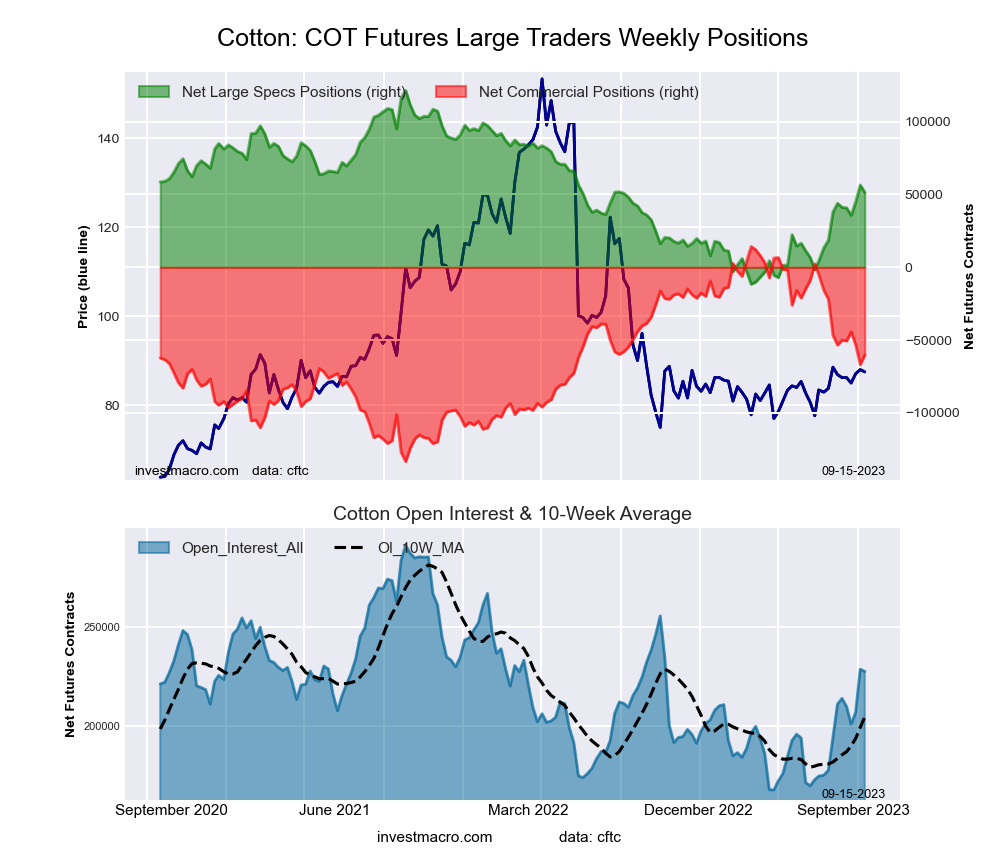 The COTTON large speculator standing this week reached a net position of 51,382 contracts in the data reported through Tuesday. This was a weekly fall of -5,028 contracts from the previous week which had a total of 56,410 net contracts.
This week’s current strength score (the trader positioning range over the past three years, measured from 0 to 100) shows the speculators are currently Bearish with a score of 47.4 percent. The commercials are Bearish with a score of 49.6 percent and the small traders (not shown in chart) are Bullish with a score of 69.4 percent.
Price Trend-Following Model: Uptrend
Our weekly trend-following model classifies the current market price position as: Uptrend. The current action for the model is considered to be: Hold – Maintain Long Position.
| COTTON Futures Statistics | SPECULATORS | COMMERCIALS | SMALL TRADERS |
| – Percent of Open Interest Longs: | 38.2 | 42.6 | 7.6 |
| – Percent of Open Interest Shorts: | 15.6 | 69.0 | 3.7 |
| – Net Position: | 51,382 | -60,187 | 8,805 |
| – Gross Longs: | 86,922 | 96,890 | 17,240 |
| – Gross Shorts: | 35,540 | 157,077 | 8,435 |
| – Long to Short Ratio: | 2.4 to 1 | 0.6 to 1 | 2.0 to 1 |
| NET POSITION TREND: | |||
| – Strength Index Score (3 Year Range Pct): | 47.4 | 49.6 | 69.4 |
| – Strength Index Reading (3 Year Range): | Bearish | Bearish | Bullish |
| NET POSITION MOVEMENT INDEX: | |||
| – 6-Week Change in Strength Index: | 5.6 | -4.6 | -4.1 |
COCOA Futures:
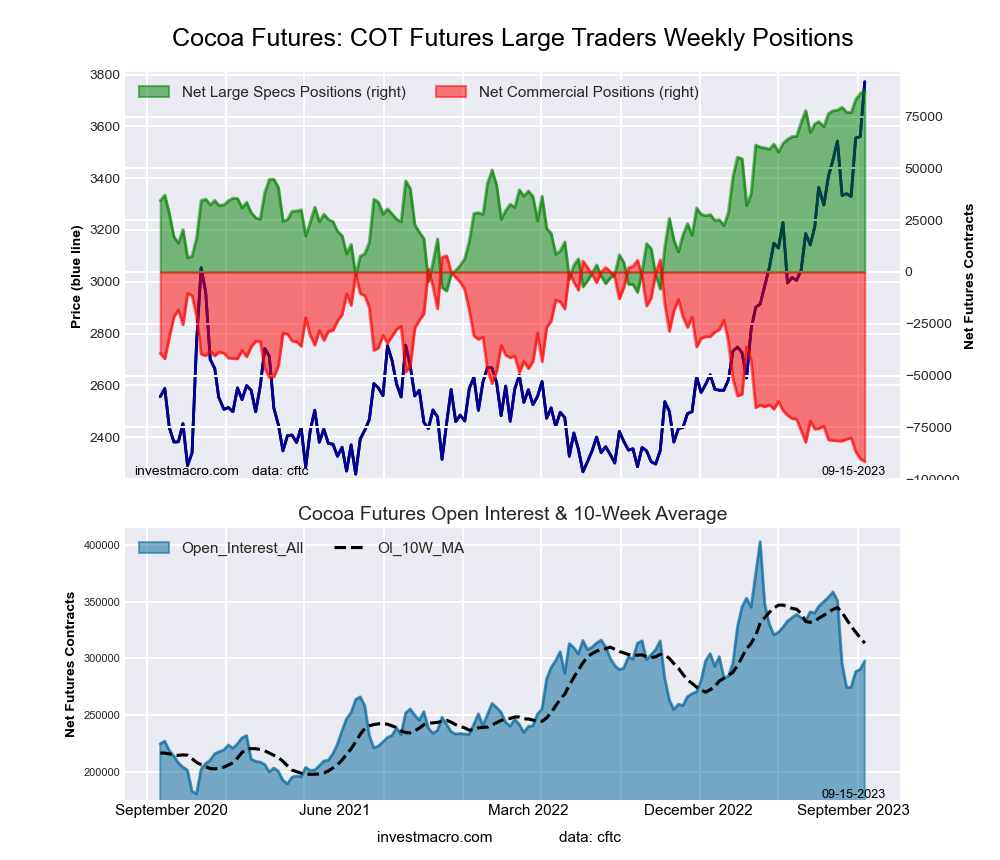 The COCOA large speculator standing this week reached a net position of 87,623 contracts in the data reported through Tuesday. This was a weekly gain of 1,403 contracts from the previous week which had a total of 86,220 net contracts.
This week’s current strength score (the trader positioning range over the past three years, measured from 0 to 100) shows the speculators are currently Bullish-Extreme with a score of 100.0 percent. The commercials are Bearish-Extreme with a score of 0.0 percent and the small traders (not shown in chart) are Bearish with a score of 35.2 percent.
Price Trend-Following Model: Strong Uptrend
Our weekly trend-following model classifies the current market price position as: Strong Uptrend. The current action for the model is considered to be: Hold – Maintain Long Position.
| COCOA Futures Statistics | SPECULATORS | COMMERCIALS | SMALL TRADERS |
| – Percent of Open Interest Longs: | 47.1 | 24.7 | 4.4 |
| – Percent of Open Interest Shorts: | 17.6 | 55.4 | 3.1 |
| – Net Position: | 87,623 | -91,493 | 3,870 |
| – Gross Longs: | 140,004 | 73,434 | 13,097 |
| – Gross Shorts: | 52,381 | 164,927 | 9,227 |
| – Long to Short Ratio: | 2.7 to 1 | 0.4 to 1 | 1.4 to 1 |
| NET POSITION TREND: | |||
| – Strength Index Score (3 Year Range Pct): | 100.0 | 0.0 | 35.2 |
| – Strength Index Reading (3 Year Range): | Bullish-Extreme | Bearish-Extreme | Bearish |
| NET POSITION MOVEMENT INDEX: | |||
| – 6-Week Change in Strength Index: | 9.7 | -10.1 | 5.8 |
WHEAT Futures:
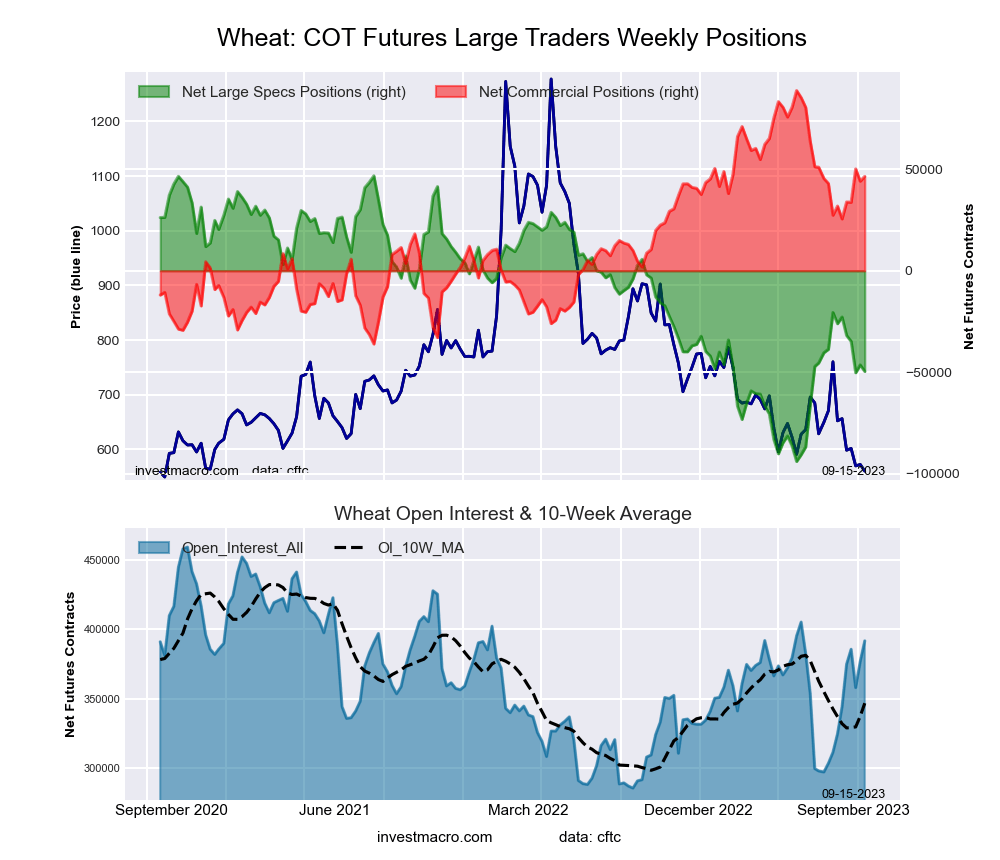 The WHEAT large speculator standing this week reached a net position of -49,619 contracts in the data reported through Tuesday. This was a weekly decrease of -3,209 contracts from the previous week which had a total of -46,410 net contracts.
This week’s current strength score (the trader positioning range over the past three years, measured from 0 to 100) shows the speculators are currently Bearish with a score of 31.5 percent. The commercials are Bullish with a score of 66.1 percent and the small traders (not shown in chart) are Bullish-Extreme with a score of 81.6 percent.
Price Trend-Following Model: Strong Downtrend
Our weekly trend-following model classifies the current market price position as: Strong Downtrend. The current action for the model is considered to be: Hold – Maintain Short Position.
| WHEAT Futures Statistics | SPECULATORS | COMMERCIALS | SMALL TRADERS |
| – Percent of Open Interest Longs: | 29.2 | 34.0 | 10.1 |
| – Percent of Open Interest Shorts: | 41.8 | 22.1 | 9.3 |
| – Net Position: | -49,619 | 46,521 | 3,098 |
| – Gross Longs: | 114,277 | 133,152 | 39,447 |
| – Gross Shorts: | 163,896 | 86,631 | 36,349 |
| – Long to Short Ratio: | 0.7 to 1 | 1.5 to 1 | 1.1 to 1 |
| NET POSITION TREND: | |||
| – Strength Index Score (3 Year Range Pct): | 31.5 | 66.1 | 81.6 |
| – Strength Index Reading (3 Year Range): | Bearish | Bullish | Bullish-Extreme |
| NET POSITION MOVEMENT INDEX: | |||
| – 6-Week Change in Strength Index: | -16.7 | 11.7 | 34.7 |
Article By InvestMacro – Receive our weekly COT Newsletter
*COT Report: The COT data, released weekly to the public each Friday, is updated through the most recent Tuesday (data is 3 days old) and shows a quick view of how large speculators or non-commercials (for-profit traders) were positioned in the futures markets.
The CFTC categorizes trader positions according to commercial hedgers (traders who use futures contracts for hedging as part of the business), non-commercials (large traders who speculate to realize trading profits) and nonreportable traders (usually small traders/speculators) as well as their open interest (contracts open in the market at time of reporting). See CFTC criteria here.

- The US introduces new import tariffs for 60 countries. Brent crude surpasses $100 per barrel Jul 24, 2026
- USD/JPY Breaks Records: Nothing Slows the Yen’s Decline Jul 24, 2026
- Oil prices reached a 6‑week high. The AUD strengthened on the back of a strong labor‑market report Jul 23, 2026
- EUR/USD Recovers as Dollar Weakens Jul 23, 2026
- Bitcoin rose to $66,000. The New Zealand dollar continues to strengthen Jul 22, 2026
- Inflationary pressure is easing in Canada. In New Zealand, on the contrary, inflation is rising Jul 21, 2026
- GBP/USD Falls After Cabinet Changes Jul 21, 2026
- Geopolitical and macroeconomic conditions continue to pressure market sentiment Jul 20, 2026
- USD/JPY Poised to Continue Gains as Expensive Oil and Lack of Support Weigh on Yen Jul 20, 2026
- COT Metals Charts: Weekly Speculator Bets led by Copper & Steel Jul 18, 2026