
By InvestMacro
Here are the latest charts and statistics for the Commitment of Traders (COT) reports data published by the Commodities Futures Trading Commission (CFTC).
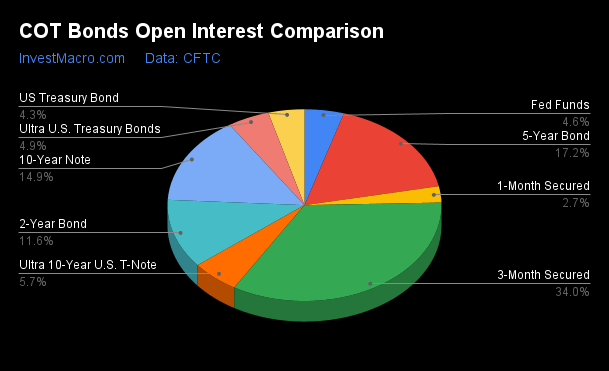
The latest COT data is updated through Tuesday September 12th and shows a quick view of how large traders (for-profit speculators and commercial hedgers) were positioned in the futures markets.
Weekly Speculator Changes led by 10-Year Bonds & SOFR 3-Months
The COT bond market speculator bets were higher this week as six out of the eight bond markets we cover had higher positioning while the other two markets had lower speculator contracts.
Free Reports:
 Sign Up for Our Stock Market Newsletter – Get updated on News, Charts & Rankings of Public Companies when you join our Stocks Newsletter
 Get our Weekly Commitment of Traders Reports - See where the biggest traders (Hedge Funds and Commercial Hedgers) are positioned in the futures markets on a weekly basis.
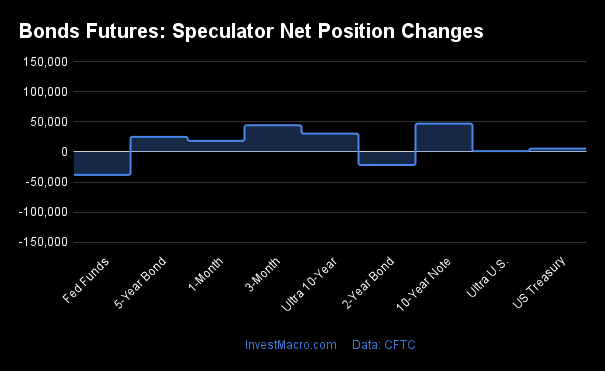
Leading the gains for the bond markets was the 10-Year Bonds (47,233 contracts) with SOFR 3-Months (44,439 contracts), the Ultra 10-Year Bonds (30,615 contracts), the 5-Year Bonds (25,238 contracts), the US Treasury Bonds (5,605 contracts) and the Ultra Treasury Bonds (1,346 contracts) also showing positive weeks.
The bond markets with declines in speculator bets for the week were the Fed Funds with a drop by -38,064 contracts and the 2-Year Bonds with a decline of -21,719 contracts on the week.
| Sep-12-2023 | OI | OI-Index | Spec-Net | Spec-Index | Com-Net | COM-Index | Smalls-Net | Smalls-Index |
|---|---|---|---|---|---|---|---|---|
| SOFR-3-Months | 10,667,873 | 100 | 316,511 | 99 | -313,438 | 0 | -3,073 | 86 |
| FedFunds | 1,458,261 | 43 | -184,954 | 25 | 195,040 | 75 | -10,086 | 71 |
| 2-Year | 3,653,520 | 85 | -1,239,609 | 2 | 1,128,539 | 99 | 111,070 | 93 |
| Long T-Bond | 1,339,675 | 72 | -192,687 | 22 | 152,663 | 65 | 40,024 | 78 |
| 10-Year | 4,681,032 | 87 | -744,302 | 10 | 720,210 | 95 | 24,092 | 79 |
| 5-Year | 5,391,830 | 85 | -1,031,030 | 17 | 954,444 | 79 | 76,586 | 90 |
Strength Scores led by SOFR 3-Months & Ultra Treasury Bonds
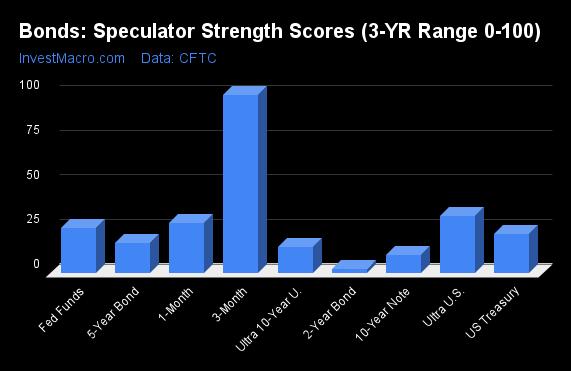
COT Strength Scores (a normalized measure of Speculator positions over a 3-Year range, from 0 to 100 where above 80 is Extreme-Bullish and below 20 is Extreme-Bearish) showed that the SOFR 3-Months (99 percent) leads the bond markets this week. The Ultra Treasury Bonds (32 percent) comes in as the next highest in the weekly strength scores.
On the downside, the 2-Year Bonds (2 percent), the 10-Year Bonds (10 percent), the Ultra 10-Year Bonds (15 percent) and the 5-Year Bonds (17 percent) come in at the lowest strength level currently and are in Extreme-Bearish territory (below 20 percent).
Strength Statistics:
Fed Funds (24.9 percent) vs Fed Funds previous week (31.9 percent)
2-Year Bond (2.3 percent) vs 2-Year Bond previous week (3.9 percent)
5-Year Bond (16.7 percent) vs 5-Year Bond previous week (14.8 percent)
10-Year Bond (10.3 percent) vs 10-Year Bond previous week (5.7 percent)
Ultra 10-Year Bond (14.6 percent) vs Ultra 10-Year Bond previous week (8.4 percent)
US Treasury Bond (21.9 percent) vs US Treasury Bond previous week (20.1 percent)
Ultra US Treasury Bond (32.1 percent) vs Ultra US Treasury Bond previous week (31.6 percent)
SOFR 3-Months (99.4 percent) vs SOFR 3-Months previous week (96.4 percent)
SOFR 3-Months & Ultra Treasury Bonds top the 6-Week Strength Trends
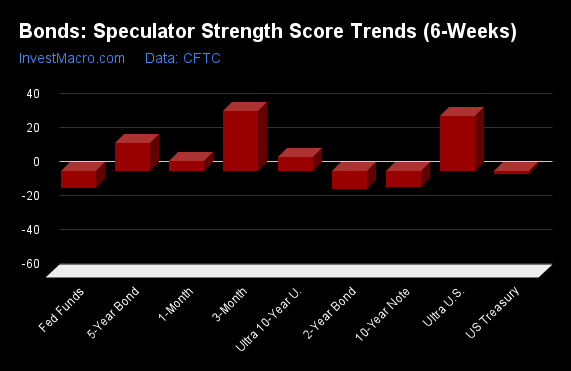
COT Strength Score Trends (or move index, calculates the 6-week changes in strength scores) showed that the SOFR 3-Months (35 percent) and the Ultra Treasury Bonds (32 percent) lead the past six weeks trends for bonds. The 5-Year Bonds (17 percent) and the are the next highest positive movers in the latest trends data.
The 2-Year Bonds (-11 percent), the 10-Year Bonds (-10 percent) and the Fed Funds (-10 percent) lead the downside trend scores currently.
Strength Trend Statistics:
Fed Funds (-9.8 percent) vs Fed Funds previous week (2.2 percent)
2-Year Bond (-10.6 percent) vs 2-Year Bond previous week (-5.3 percent)
5-Year Bond (16.7 percent) vs 5-Year Bond previous week (6.0 percent)
10-Year Bond (-9.6 percent) vs 10-Year Bond previous week (-16.3 percent)
Ultra 10-Year Bond (7.9 percent) vs Ultra 10-Year Bond previous week (4.3 percent)
US Treasury Bond (-2.0 percent) vs US Treasury Bond previous week (-17.1 percent)
Ultra US Treasury Bond (32.1 percent) vs Ultra US Treasury Bond previous week (26.8 percent)
SOFR 3-Months (35.2 percent) vs SOFR 3-Months previous week (18.2 percent)
Secured Overnight Financing Rate (3-Month) Futures:
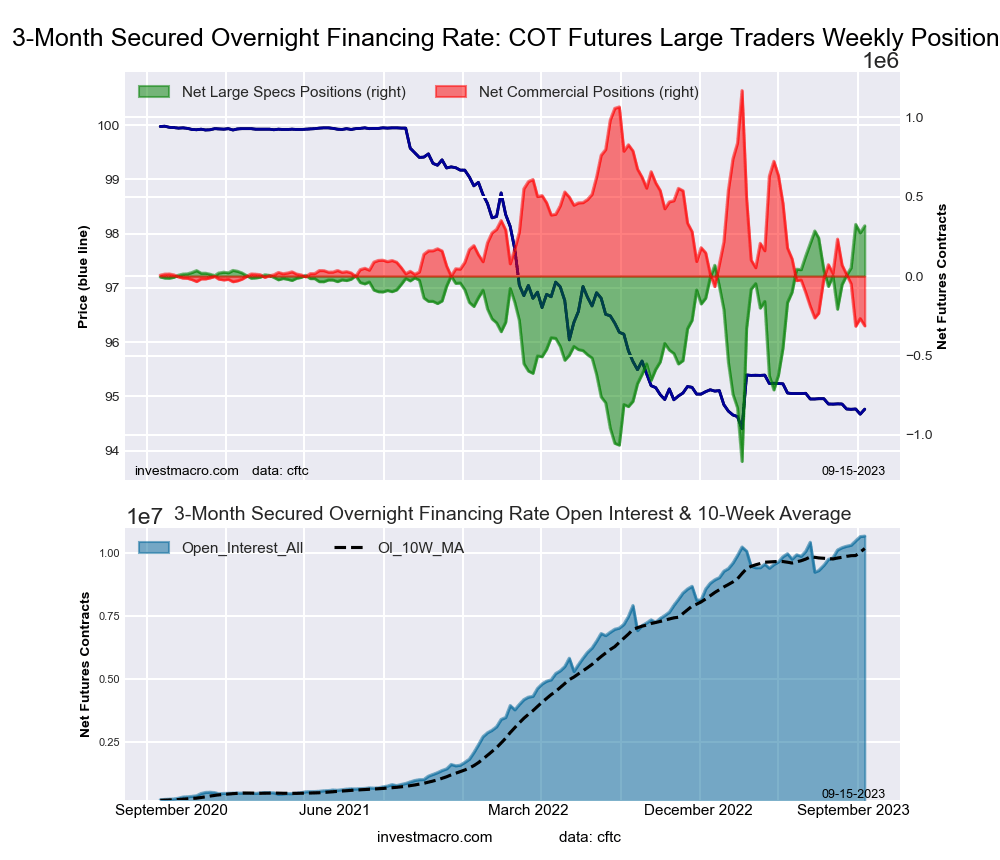 The Secured Overnight Financing Rate (3-Month) large speculator standing this week equaled a net position of 316,511 contracts in the data reported through Tuesday. This was a weekly boost of 44,439 contracts from the previous week which had a total of 272,072 net contracts.
This week’s current strength score (the trader positioning range over the past three years, measured from 0 to 100) shows the speculators are currently Bullish-Extreme with a score of 99.4 percent. The commercials are Bearish-Extreme with a score of 0.1 percent and the small traders (not shown in chart) are Bullish-Extreme with a score of 86.2 percent.
Price Trend-Following Model: Weak Uptrend
Our weekly trend-following model classifies the current market price position as: Weak Uptrend. The current action for the model is considered to be: Hold – Maintain Long Position.
| SOFR 3-Months Statistics | SPECULATORS | COMMERCIALS | SMALL TRADERS |
| – Percent of Open Interest Longs: | 17.9 | 58.2 | 0.3 |
| – Percent of Open Interest Shorts: | 14.9 | 61.1 | 0.4 |
| – Net Position: | 316,511 | -313,438 | -3,073 |
| – Gross Longs: | 1,910,702 | 6,204,626 | 37,259 |
| – Gross Shorts: | 1,594,191 | 6,518,064 | 40,332 |
| – Long to Short Ratio: | 1.2 to 1 | 1.0 to 1 | 0.9 to 1 |
| NET POSITION TREND: | |||
| – Strength Index Score (3 Year Range Pct): | 99.4 | 0.1 | 86.2 |
| – Strength Index Reading (3 Year Range): | Bullish-Extreme | Bearish-Extreme | Bullish-Extreme |
| NET POSITION MOVEMENT INDEX: | |||
| – 6-Week Change in Strength Index: | 35.2 | -36.8 | 11.6 |
30-Day Federal Funds Futures:
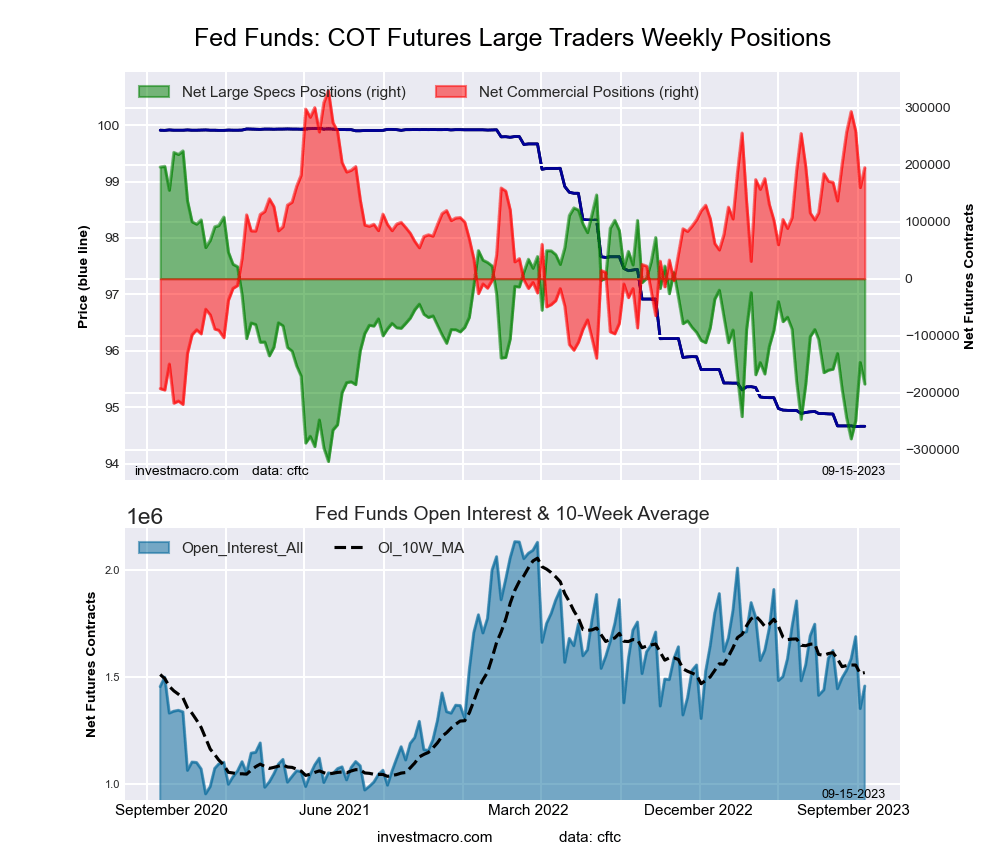 The 30-Day Federal Funds large speculator standing this week equaled a net position of -184,954 contracts in the data reported through Tuesday. This was a weekly reduction of -38,064 contracts from the previous week which had a total of -146,890 net contracts.
This week’s current strength score (the trader positioning range over the past three years, measured from 0 to 100) shows the speculators are currently Bearish with a score of 24.9 percent. The commercials are Bullish with a score of 75.4 percent and the small traders (not shown in chart) are Bullish with a score of 71.2 percent.
Price Trend-Following Model: Downtrend
Our weekly trend-following model classifies the current market price position as: Downtrend. The current action for the model is considered to be: Hold – Maintain Short Position.
| 30-Day Federal Funds Statistics | SPECULATORS | COMMERCIALS | SMALL TRADERS |
| – Percent of Open Interest Longs: | 7.2 | 74.8 | 2.4 |
| – Percent of Open Interest Shorts: | 19.9 | 61.4 | 3.1 |
| – Net Position: | -184,954 | 195,040 | -10,086 |
| – Gross Longs: | 104,572 | 1,091,054 | 35,676 |
| – Gross Shorts: | 289,526 | 896,014 | 45,762 |
| – Long to Short Ratio: | 0.4 to 1 | 1.2 to 1 | 0.8 to 1 |
| NET POSITION TREND: | |||
| – Strength Index Score (3 Year Range Pct): | 24.9 | 75.4 | 71.2 |
| – Strength Index Reading (3 Year Range): | Bearish | Bullish | Bullish |
| NET POSITION MOVEMENT INDEX: | |||
| – 6-Week Change in Strength Index: | -9.8 | 10.6 | -9.4 |
2-Year Treasury Note Futures:
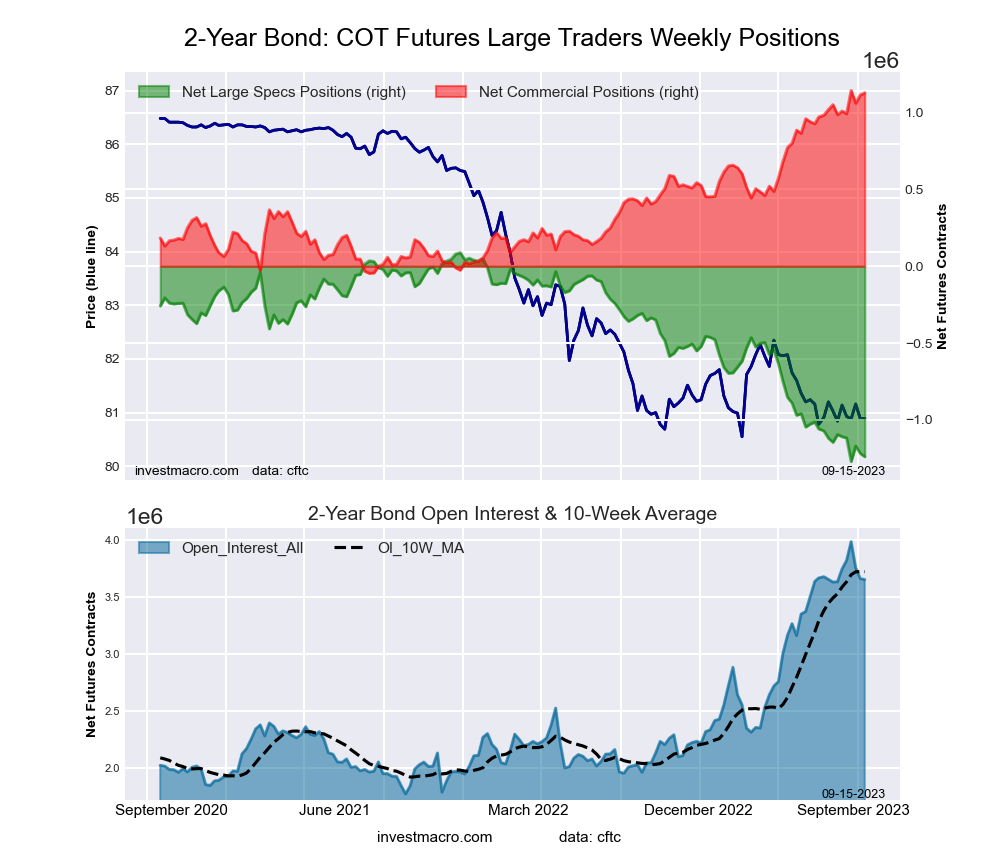 The 2-Year Treasury Note large speculator standing this week equaled a net position of -1,239,609 contracts in the data reported through Tuesday. This was a weekly lowering of -21,719 contracts from the previous week which had a total of -1,217,890 net contracts.
This week’s current strength score (the trader positioning range over the past three years, measured from 0 to 100) shows the speculators are currently Bearish-Extreme with a score of 2.3 percent. The commercials are Bullish-Extreme with a score of 98.8 percent and the small traders (not shown in chart) are Bullish-Extreme with a score of 93.2 percent.
Price Trend-Following Model: Downtrend
Our weekly trend-following model classifies the current market price position as: Downtrend. The current action for the model is considered to be: Hold – Maintain Short Position.
| 2-Year Treasury Note Statistics | SPECULATORS | COMMERCIALS | SMALL TRADERS |
| – Percent of Open Interest Longs: | 8.8 | 83.0 | 7.1 |
| – Percent of Open Interest Shorts: | 42.7 | 52.1 | 4.1 |
| – Net Position: | -1,239,609 | 1,128,539 | 111,070 |
| – Gross Longs: | 320,048 | 3,031,053 | 259,610 |
| – Gross Shorts: | 1,559,657 | 1,902,514 | 148,540 |
| – Long to Short Ratio: | 0.2 to 1 | 1.6 to 1 | 1.7 to 1 |
| NET POSITION TREND: | |||
| – Strength Index Score (3 Year Range Pct): | 2.3 | 98.8 | 93.2 |
| – Strength Index Reading (3 Year Range): | Bearish-Extreme | Bullish-Extreme | Bullish-Extreme |
| NET POSITION MOVEMENT INDEX: | |||
| – 6-Week Change in Strength Index: | -10.6 | 12.0 | 0.6 |
5-Year Treasury Note Futures:
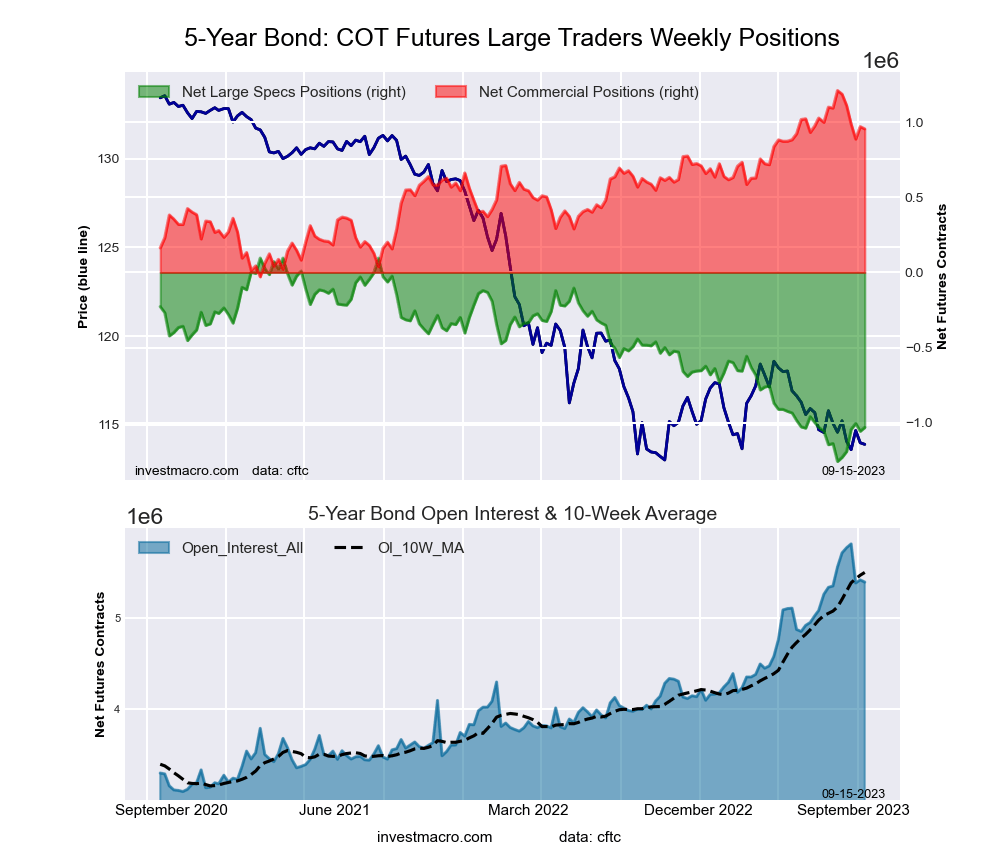 The 5-Year Treasury Note large speculator standing this week equaled a net position of -1,031,030 contracts in the data reported through Tuesday. This was a weekly increase of 25,238 contracts from the previous week which had a total of -1,056,268 net contracts.
This week’s current strength score (the trader positioning range over the past three years, measured from 0 to 100) shows the speculators are currently Bearish-Extreme with a score of 16.7 percent. The commercials are Bullish with a score of 79.4 percent and the small traders (not shown in chart) are Bullish-Extreme with a score of 90.0 percent.
Price Trend-Following Model: Downtrend
Our weekly trend-following model classifies the current market price position as: Downtrend. The current action for the model is considered to be: Hold – Maintain Short Position.
| 5-Year Treasury Note Statistics | SPECULATORS | COMMERCIALS | SMALL TRADERS |
| – Percent of Open Interest Longs: | 8.6 | 82.8 | 7.5 |
| – Percent of Open Interest Shorts: | 27.8 | 65.1 | 6.1 |
| – Net Position: | -1,031,030 | 954,444 | 76,586 |
| – Gross Longs: | 465,279 | 4,464,077 | 405,798 |
| – Gross Shorts: | 1,496,309 | 3,509,633 | 329,212 |
| – Long to Short Ratio: | 0.3 to 1 | 1.3 to 1 | 1.2 to 1 |
| NET POSITION TREND: | |||
| – Strength Index Score (3 Year Range Pct): | 16.7 | 79.4 | 90.0 |
| – Strength Index Reading (3 Year Range): | Bearish-Extreme | Bullish | Bullish-Extreme |
| NET POSITION MOVEMENT INDEX: | |||
| – 6-Week Change in Strength Index: | 16.7 | -20.6 | 7.1 |
10-Year Treasury Note Futures:
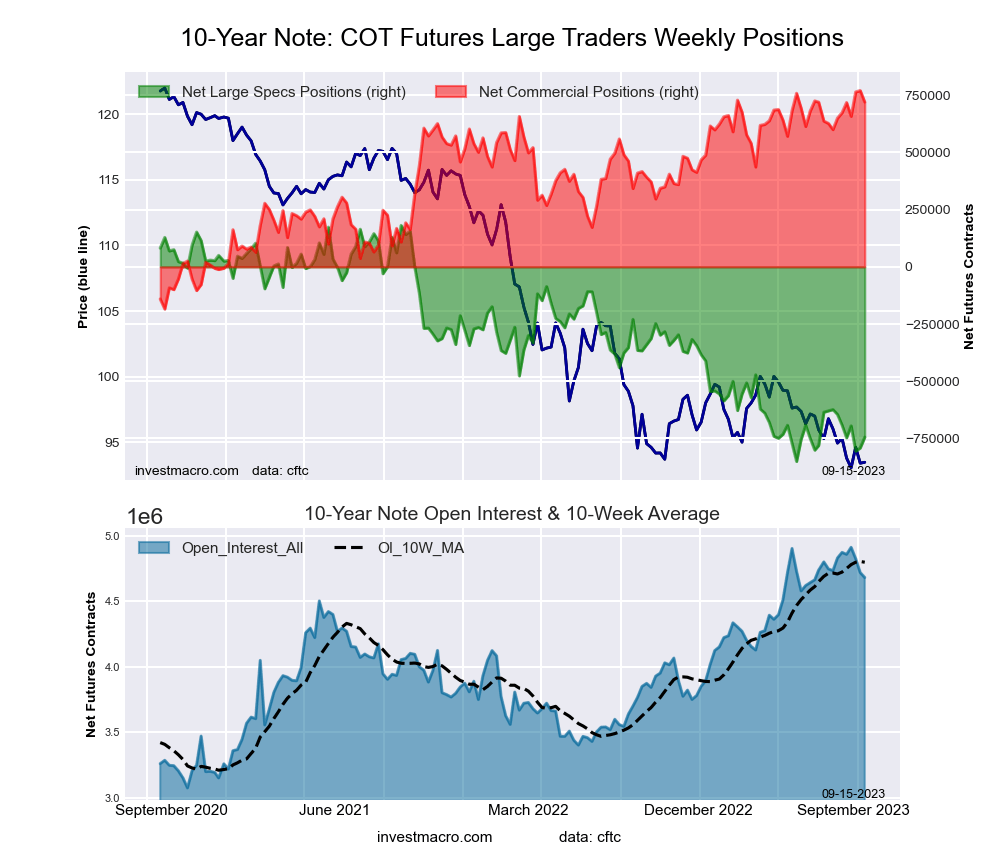 The 10-Year Treasury Note large speculator standing this week equaled a net position of -744,302 contracts in the data reported through Tuesday. This was a weekly rise of 47,233 contracts from the previous week which had a total of -791,535 net contracts.
This week’s current strength score (the trader positioning range over the past three years, measured from 0 to 100) shows the speculators are currently Bearish-Extreme with a score of 10.3 percent. The commercials are Bullish-Extreme with a score of 94.7 percent and the small traders (not shown in chart) are Bullish with a score of 78.8 percent.
Price Trend-Following Model: Downtrend
Our weekly trend-following model classifies the current market price position as: Downtrend. The current action for the model is considered to be: Hold – Maintain Short Position.
| 10-Year Treasury Note Statistics | SPECULATORS | COMMERCIALS | SMALL TRADERS |
| – Percent of Open Interest Longs: | 10.0 | 79.3 | 8.6 |
| – Percent of Open Interest Shorts: | 25.9 | 63.9 | 8.1 |
| – Net Position: | -744,302 | 720,210 | 24,092 |
| – Gross Longs: | 467,114 | 3,712,430 | 404,705 |
| – Gross Shorts: | 1,211,416 | 2,992,220 | 380,613 |
| – Long to Short Ratio: | 0.4 to 1 | 1.2 to 1 | 1.1 to 1 |
| NET POSITION TREND: | |||
| – Strength Index Score (3 Year Range Pct): | 10.3 | 94.7 | 78.8 |
| – Strength Index Reading (3 Year Range): | Bearish-Extreme | Bullish-Extreme | Bullish |
| NET POSITION MOVEMENT INDEX: | |||
| – 6-Week Change in Strength Index: | -9.6 | 7.3 | 6.3 |
Ultra 10-Year Notes Futures:
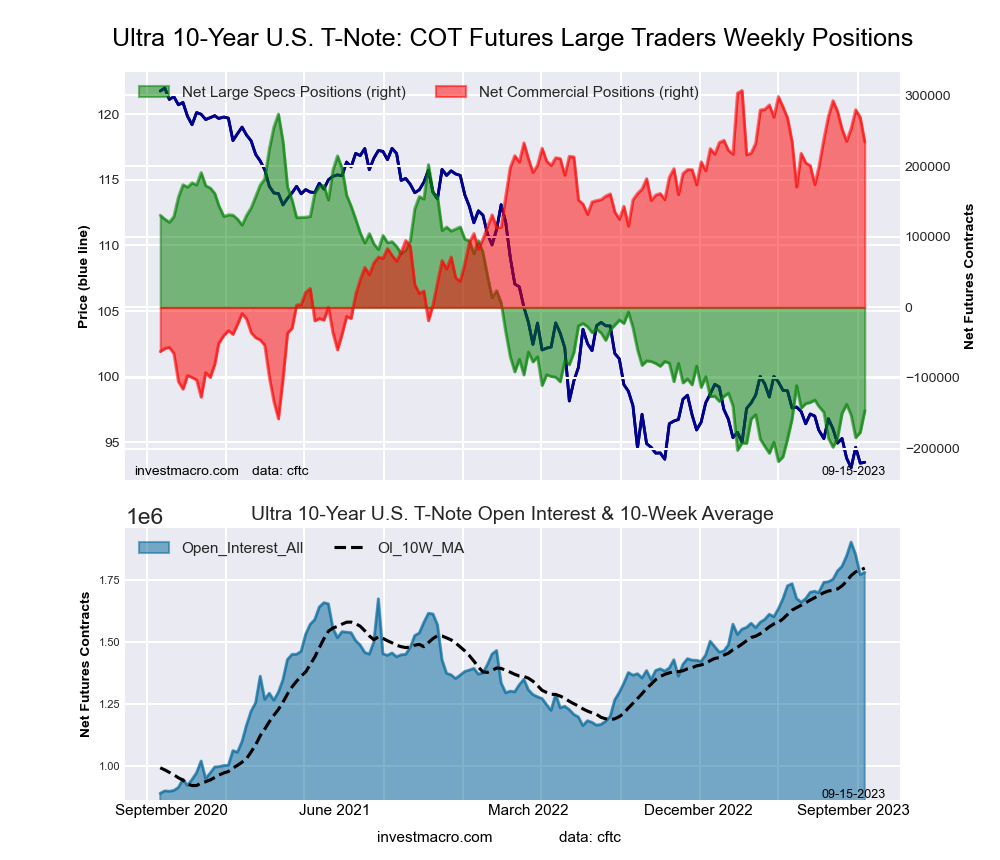 The Ultra 10-Year Notes large speculator standing this week equaled a net position of -146,433 contracts in the data reported through Tuesday. This was a weekly lift of 30,615 contracts from the previous week which had a total of -177,048 net contracts.
This week’s current strength score (the trader positioning range over the past three years, measured from 0 to 100) shows the speculators are currently Bearish-Extreme with a score of 14.6 percent. The commercials are Bullish-Extreme with a score of 84.3 percent and the small traders (not shown in chart) are Bullish with a score of 62.0 percent.
Price Trend-Following Model: Weak Uptrend
Our weekly trend-following model classifies the current market price position as: Weak Uptrend. The current action for the model is considered to be: Hold – Maintain Long Position.
| Ultra 10-Year Notes Statistics | SPECULATORS | COMMERCIALS | SMALL TRADERS |
| – Percent of Open Interest Longs: | 12.1 | 75.5 | 10.7 |
| – Percent of Open Interest Shorts: | 20.4 | 62.3 | 15.6 |
| – Net Position: | -146,433 | 233,935 | -87,502 |
| – Gross Longs: | 216,251 | 1,344,525 | 189,889 |
| – Gross Shorts: | 362,684 | 1,110,590 | 277,391 |
| – Long to Short Ratio: | 0.6 to 1 | 1.2 to 1 | 0.7 to 1 |
| NET POSITION TREND: | |||
| – Strength Index Score (3 Year Range Pct): | 14.6 | 84.3 | 62.0 |
| – Strength Index Reading (3 Year Range): | Bearish-Extreme | Bullish-Extreme | Bullish |
| NET POSITION MOVEMENT INDEX: | |||
| – 6-Week Change in Strength Index: | 7.9 | -9.4 | 2.9 |
US Treasury Bonds Futures:
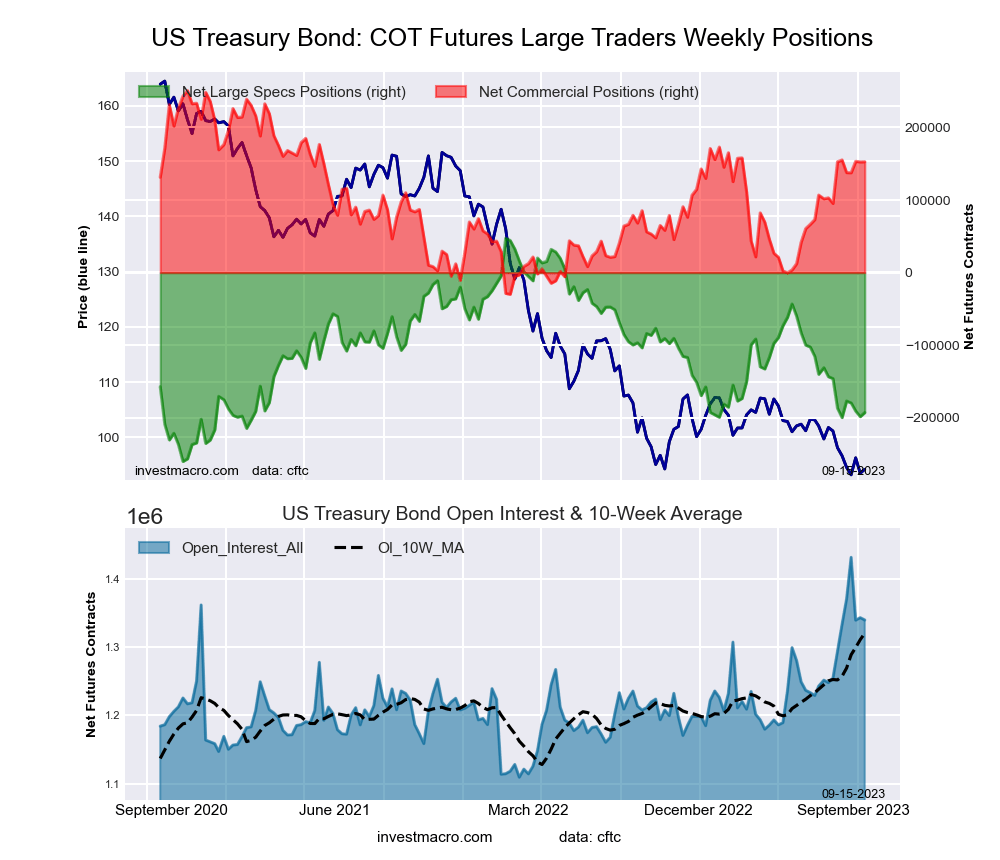 The US Treasury Bonds large speculator standing this week equaled a net position of -192,687 contracts in the data reported through Tuesday. This was a weekly increase of 5,605 contracts from the previous week which had a total of -198,292 net contracts.
This week’s current strength score (the trader positioning range over the past three years, measured from 0 to 100) shows the speculators are currently Bearish with a score of 21.9 percent. The commercials are Bullish with a score of 65.0 percent and the small traders (not shown in chart) are Bullish with a score of 77.6 percent.
Price Trend-Following Model: Strong Downtrend
Our weekly trend-following model classifies the current market price position as: Strong Downtrend. The current action for the model is considered to be: Hold – Maintain Short Position.
| US Treasury Bonds Statistics | SPECULATORS | COMMERCIALS | SMALL TRADERS |
| – Percent of Open Interest Longs: | 5.9 | 78.8 | 14.3 |
| – Percent of Open Interest Shorts: | 20.3 | 67.4 | 11.3 |
| – Net Position: | -192,687 | 152,663 | 40,024 |
| – Gross Longs: | 79,656 | 1,056,184 | 191,340 |
| – Gross Shorts: | 272,343 | 903,521 | 151,316 |
| – Long to Short Ratio: | 0.3 to 1 | 1.2 to 1 | 1.3 to 1 |
| NET POSITION TREND: | |||
| – Strength Index Score (3 Year Range Pct): | 21.9 | 65.0 | 77.6 |
| – Strength Index Reading (3 Year Range): | Bearish | Bullish | Bullish |
| NET POSITION MOVEMENT INDEX: | |||
| – 6-Week Change in Strength Index: | -2.0 | 0.0 | 4.3 |
Ultra US Treasury Bonds Futures:
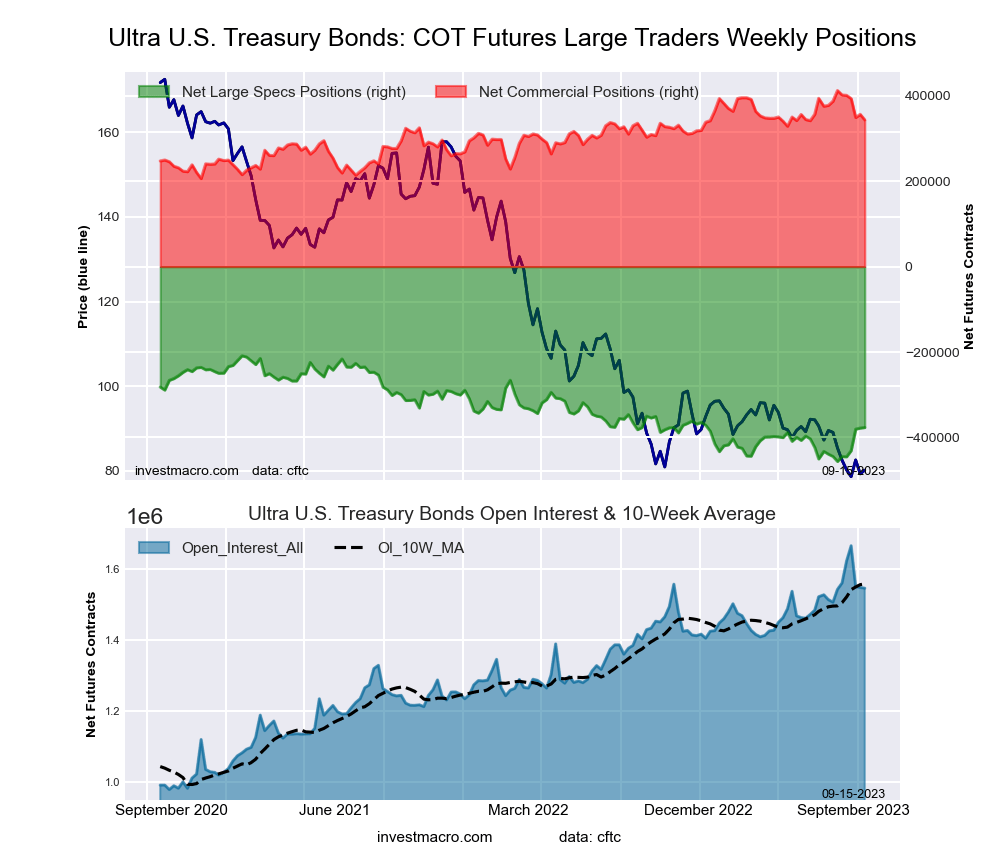 The Ultra US Treasury Bonds large speculator standing this week equaled a net position of -376,925 contracts in the data reported through Tuesday. This was a weekly boost of 1,346 contracts from the previous week which had a total of -378,271 net contracts.
This week’s current strength score (the trader positioning range over the past three years, measured from 0 to 100) shows the speculators are currently Bearish with a score of 32.1 percent. The commercials are Bullish with a score of 66.6 percent and the small traders (not shown in chart) are Bullish with a score of 68.5 percent.
Price Trend-Following Model: Strong Downtrend
Our weekly trend-following model classifies the current market price position as: Strong Downtrend. The current action for the model is considered to be: Hold – Maintain Short Position.
| Ultra US Treasury Bonds Statistics | SPECULATORS | COMMERCIALS | SMALL TRADERS |
| – Percent of Open Interest Longs: | 5.4 | 82.8 | 11.1 |
| – Percent of Open Interest Shorts: | 29.8 | 60.5 | 9.0 |
| – Net Position: | -376,925 | 343,799 | 33,126 |
| – Gross Longs: | 83,739 | 1,279,765 | 172,214 |
| – Gross Shorts: | 460,664 | 935,966 | 139,088 |
| – Long to Short Ratio: | 0.2 to 1 | 1.4 to 1 | 1.2 to 1 |
| NET POSITION TREND: | |||
| – Strength Index Score (3 Year Range Pct): | 32.1 | 66.6 | 68.5 |
| – Strength Index Reading (3 Year Range): | Bearish | Bullish | Bullish |
| NET POSITION MOVEMENT INDEX: | |||
| – 6-Week Change in Strength Index: | 32.1 | -33.4 | -10.1 |
Article By InvestMacro – Receive our weekly COT Newsletter
*COT Report: The COT data, released weekly to the public each Friday, is updated through the most recent Tuesday (data is 3 days old) and shows a quick view of how large speculators or non-commercials (for-profit traders) were positioned in the futures markets.
The CFTC categorizes trader positions according to commercial hedgers (traders who use futures contracts for hedging as part of the business), non-commercials (large traders who speculate to realize trading profits) and nonreportable traders (usually small traders/speculators) as well as their open interest (contracts open in the market at time of reporting). See CFTC criteria here.

- The US introduces new import tariffs for 60 countries. Brent crude surpasses $100 per barrel Jul 24, 2026
- USD/JPY Breaks Records: Nothing Slows the Yen’s Decline Jul 24, 2026
- Oil prices reached a 6‑week high. The AUD strengthened on the back of a strong labor‑market report Jul 23, 2026
- EUR/USD Recovers as Dollar Weakens Jul 23, 2026
- Bitcoin rose to $66,000. The New Zealand dollar continues to strengthen Jul 22, 2026
- Inflationary pressure is easing in Canada. In New Zealand, on the contrary, inflation is rising Jul 21, 2026
- GBP/USD Falls After Cabinet Changes Jul 21, 2026
- Geopolitical and macroeconomic conditions continue to pressure market sentiment Jul 20, 2026
- USD/JPY Poised to Continue Gains as Expensive Oil and Lack of Support Weigh on Yen Jul 20, 2026
- COT Metals Charts: Weekly Speculator Bets led by Copper & Steel Jul 18, 2026