
By InvestMacro
Here are the latest charts and statistics for the Commitment of Traders (COT) data published by the Commodities Futures Trading Commission (CFTC).
The latest COT data is updated through Tuesday September 12th and shows a quick view of how large traders (for-profit speculators and commercial entities) were positioned in the futures markets.
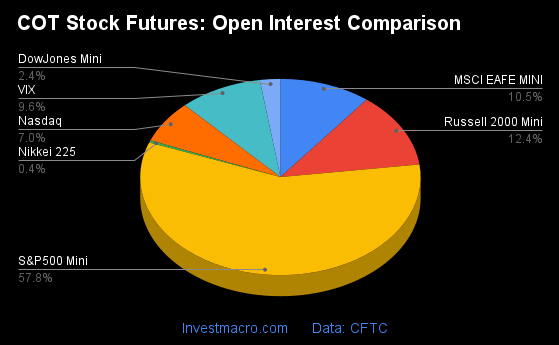
Weekly Speculator Changes led by S&P500-Mini & Russell-Mini
The COT stock markets speculator bets were higher this week as four out of the seven stock markets we cover had higher positioning while the other four markets had lower speculator contracts.
Free Reports:
 Get our Weekly Commitment of Traders Reports - See where the biggest traders (Hedge Funds and Commercial Hedgers) are positioned in the futures markets on a weekly basis.
 Download Our Metatrader 4 Indicators – Put Our Free MetaTrader 4 Custom Indicators on your charts when you join our Weekly Newsletter
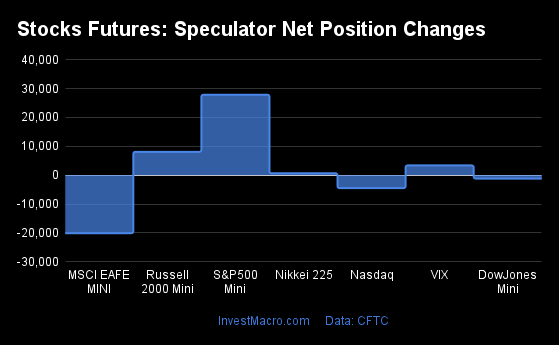
Leading the gains for the stock markets was the S&P500-Mini (27,878 contracts) with the Russell-Mini (8,096 contracts), the Nikkei 225 (656 contracts) and the VIX (3,384 contracts) also showing positive weeks.
The markets with the declines in speculator bets this week were the MSCI EAFE-Mini (-20,113 contracts) with the Nasdaq-Mini (-4,494 contracts) and the DowJones-Mini (-1,176 contracts) also registering lower bets on the week.
| Sep-12-2023 | OI | OI-Index | Spec-Net | Spec-Index | Com-Net | COM-Index | Smalls-Net | Smalls-Index |
|---|---|---|---|---|---|---|---|---|
| S&P500-Mini | 2,520,164 | 48 | -116,333 | 47 | 87,045 | 52 | 29,288 | 49 |
| Nikkei 225 | 16,425 | 17 | 514 | 72 | -918 | 30 | 404 | 33 |
| Nasdaq-Mini | 303,321 | 77 | 9,056 | 82 | -9,508 | 17 | 452 | 66 |
| DowJones-Mini | 102,910 | 69 | -12,900 | 37 | 12,437 | 59 | 463 | 46 |
| VIX | 418,072 | 81 | -39,342 | 90 | 40,099 | 6 | -757 | 92 |
| Nikkei 225 Yen | 46,463 | 29 | 3,889 | 46 | 6,646 | 29 | -10,535 | 73 |
Strength Scores led by VIX & Nasdaq-Mini
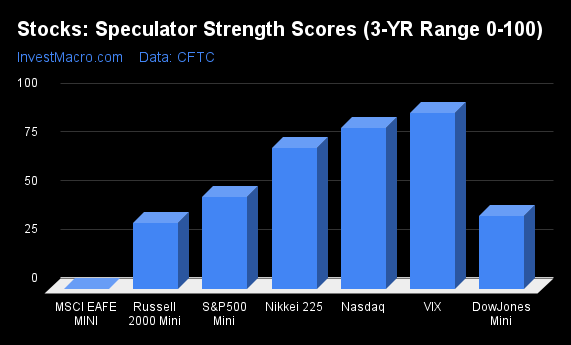
COT Strength Scores (a normalized measure of Speculator positions over a 3-Year range, from 0 to 100 where above 80 is Extreme-Bullish and below 20 is Extreme-Bearish) showed that the VIX (90 percent) and the Nasdaq-Mini (82 percent) lead the stock markets this week. The Nikkei 225 (72 percent) and S&P500-Mini (47 percent) come in as the next highest in the weekly strength scores.
On the downside, the MSCI EAFE-Mini (0 percent) comes in at the lowest strength level currently and is in Extreme-Bearish territory (below 20 percent). The next lowest strength score is the Russell-Mini (34 percent).
Strength Statistics:
VIX (90.3 percent) vs VIX previous week (87.8 percent)
S&P500-Mini (47.4 percent) vs S&P500-Mini previous week (43.2 percent)
DowJones-Mini (37.4 percent) vs DowJones-Mini previous week (40.7 percent)
Nasdaq-Mini (82.4 percent) vs Nasdaq-Mini previous week (85.0 percent)
Russell2000-Mini (33.8 percent) vs Russell2000-Mini previous week (28.9 percent)
Nikkei USD (72.4 percent) vs Nikkei USD previous week (68.2 percent)
EAFE-Mini (0.0 percent) vs EAFE-Mini previous week (19.4 percent)
S&P500-Mini & Nasdaq-Mini top the 6-Week Strength Trends

COT Strength Score Trends (or move index, calculates the 6-week changes in strength scores) showed that the S&P500-Mini (13 percent) leads the past six weeks trends for the stock markets. The Nasdaq-Mini (12 percent), the Nikkei 225 (9 percent) and the VIX (2 percent) are the next highest positive movers in the latest trends data.
The DowJones-Mini (-41 percent) leads the downside trend scores currently with the MSCI EAFE-Mini (-33 percent) coming in as the next market with lower trend scores.
Strength Trend Statistics:
VIX (2.1 percent) vs VIX previous week (-0.4 percent)
S&P500-Mini (12.5 percent) vs S&P500-Mini previous week (13.2 percent)
DowJones-Mini (-41.0 percent) vs DowJones-Mini previous week (-37.2 percent)
Nasdaq-Mini (11.8 percent) vs Nasdaq-Mini previous week (13.9 percent)
Russell2000-Mini (1.6 percent) vs Russell2000-Mini previous week (-1.8 percent)
Nikkei USD (8.9 percent) vs Nikkei USD previous week (16.0 percent)
EAFE-Mini (-32.8 percent) vs EAFE-Mini previous week (-6.9 percent)
Individual Stock Market Charts:
VIX Volatility Futures:
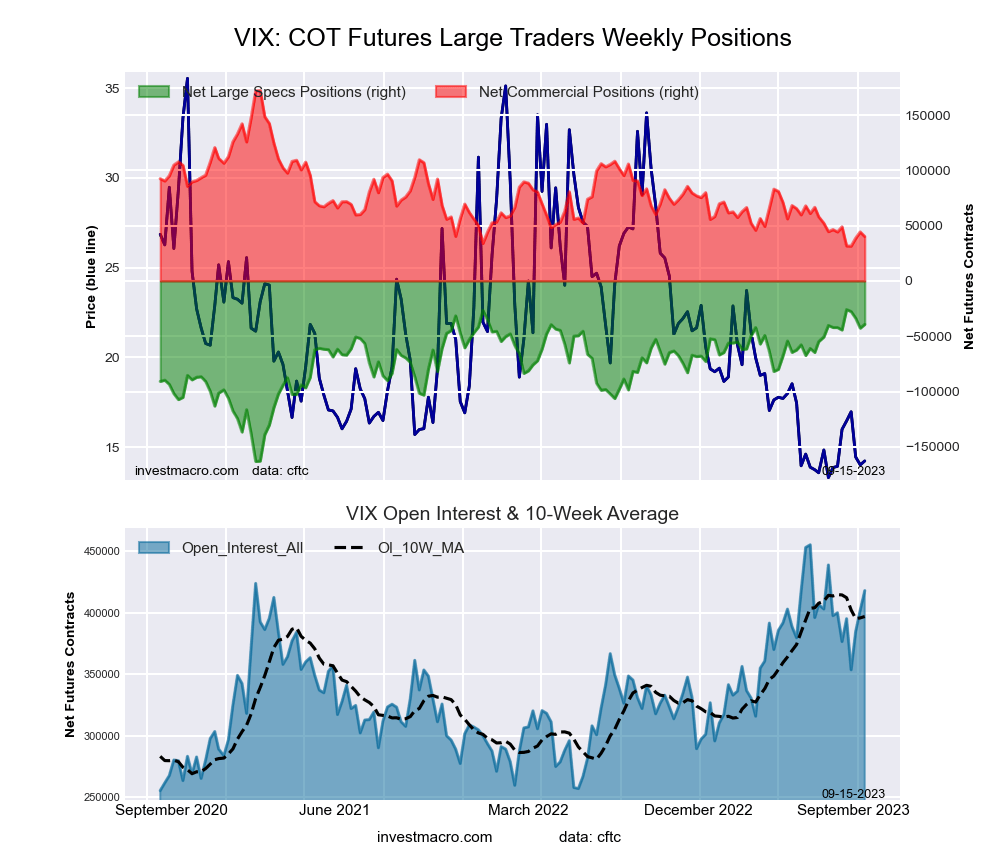 The VIX Volatility large speculator standing this week equaled a net position of -39,342 contracts in the data reported through Tuesday. This was a weekly boost of 3,384 contracts from the previous week which had a total of -42,726 net contracts.
This week’s current strength score (the trader positioning range over the past three years, measured from 0 to 100) shows the speculators are currently Bullish-Extreme with a score of 90.3 percent. The commercials are Bearish-Extreme with a score of 6.2 percent and the small traders (not shown in chart) are Bullish-Extreme with a score of 91.9 percent.
Price Trend-Following Model: Strong Downtrend
Our weekly trend-following model classifies the current market price position as: Strong Downtrend. The current action for the model is considered to be: Hold – Maintain Short Position.
| VIX Volatility Futures Statistics | SPECULATORS | COMMERCIALS | SMALL TRADERS |
| – Percent of Open Interest Longs: | 24.9 | 46.0 | 6.5 |
| – Percent of Open Interest Shorts: | 34.3 | 36.4 | 6.7 |
| – Net Position: | -39,342 | 40,099 | -757 |
| – Gross Longs: | 104,179 | 192,419 | 27,224 |
| – Gross Shorts: | 143,521 | 152,320 | 27,981 |
| – Long to Short Ratio: | 0.7 to 1 | 1.3 to 1 | 1.0 to 1 |
| NET POSITION TREND: | |||
| – Strength Index Score (3 Year Range Pct): | 90.3 | 6.2 | 91.9 |
| – Strength Index Reading (3 Year Range): | Bullish-Extreme | Bearish-Extreme | Bullish-Extreme |
| NET POSITION MOVEMENT INDEX: | |||
| – 6-Week Change in Strength Index: | 2.1 | -3.0 | 6.8 |
S&P500 Mini Futures:
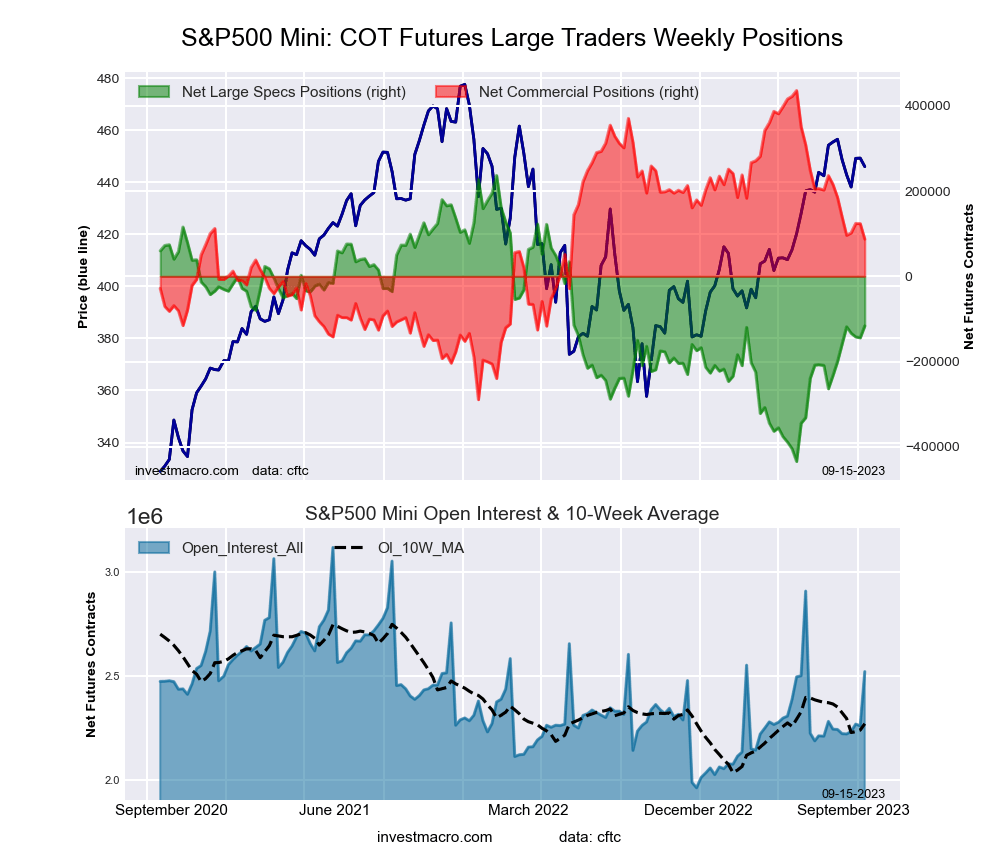 The S&P500 Mini large speculator standing this week equaled a net position of -116,333 contracts in the data reported through Tuesday. This was a weekly increase of 27,878 contracts from the previous week which had a total of -144,211 net contracts.
This week’s current strength score (the trader positioning range over the past three years, measured from 0 to 100) shows the speculators are currently Bearish with a score of 47.4 percent. The commercials are Bullish with a score of 51.9 percent and the small traders (not shown in chart) are Bearish with a score of 48.9 percent.
Price Trend-Following Model: Uptrend
Our weekly trend-following model classifies the current market price position as: Uptrend. The current action for the model is considered to be: Hold – Maintain Long Position.
| S&P500 Mini Futures Statistics | SPECULATORS | COMMERCIALS | SMALL TRADERS |
| – Percent of Open Interest Longs: | 11.1 | 72.3 | 11.4 |
| – Percent of Open Interest Shorts: | 15.7 | 68.8 | 10.2 |
| – Net Position: | -116,333 | 87,045 | 29,288 |
| – Gross Longs: | 279,471 | 1,821,412 | 286,894 |
| – Gross Shorts: | 395,804 | 1,734,367 | 257,606 |
| – Long to Short Ratio: | 0.7 to 1 | 1.1 to 1 | 1.1 to 1 |
| NET POSITION TREND: | |||
| – Strength Index Score (3 Year Range Pct): | 47.4 | 51.9 | 48.9 |
| – Strength Index Reading (3 Year Range): | Bearish | Bullish | Bearish |
| NET POSITION MOVEMENT INDEX: | |||
| – 6-Week Change in Strength Index: | 12.5 | -13.6 | 5.8 |
Dow Jones Mini Futures:
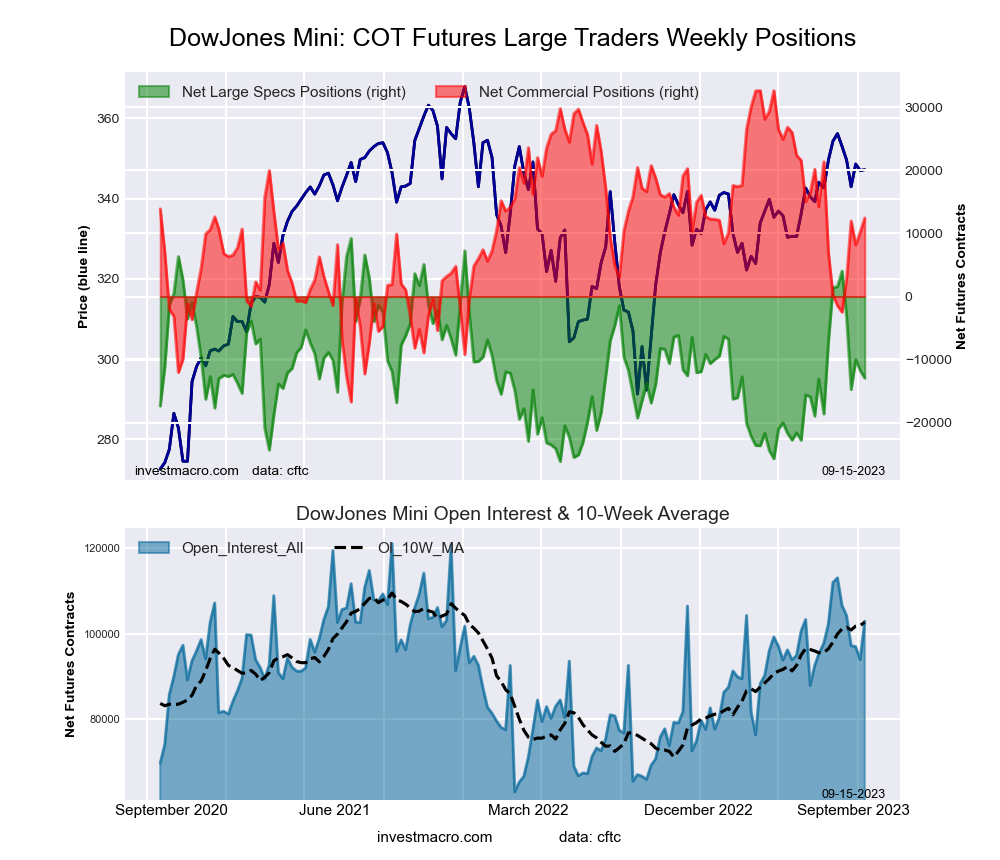 The Dow Jones Mini large speculator standing this week equaled a net position of -12,900 contracts in the data reported through Tuesday. This was a weekly fall of -1,176 contracts from the previous week which had a total of -11,724 net contracts.
This week’s current strength score (the trader positioning range over the past three years, measured from 0 to 100) shows the speculators are currently Bearish with a score of 37.4 percent. The commercials are Bullish with a score of 59.1 percent and the small traders (not shown in chart) are Bearish with a score of 46.1 percent.
Price Trend-Following Model: Uptrend
Our weekly trend-following model classifies the current market price position as: Uptrend. The current action for the model is considered to be: Hold – Maintain Long Position.
| Dow Jones Mini Futures Statistics | SPECULATORS | COMMERCIALS | SMALL TRADERS |
| – Percent of Open Interest Longs: | 22.1 | 58.9 | 14.2 |
| – Percent of Open Interest Shorts: | 34.7 | 46.8 | 13.7 |
| – Net Position: | -12,900 | 12,437 | 463 |
| – Gross Longs: | 22,788 | 60,631 | 14,578 |
| – Gross Shorts: | 35,688 | 48,194 | 14,115 |
| – Long to Short Ratio: | 0.6 to 1 | 1.3 to 1 | 1.0 to 1 |
| NET POSITION TREND: | |||
| – Strength Index Score (3 Year Range Pct): | 37.4 | 59.1 | 46.1 |
| – Strength Index Reading (3 Year Range): | Bearish | Bullish | Bearish |
| NET POSITION MOVEMENT INDEX: | |||
| – 6-Week Change in Strength Index: | -41.0 | 28.2 | 2.9 |
Nasdaq Mini Futures:
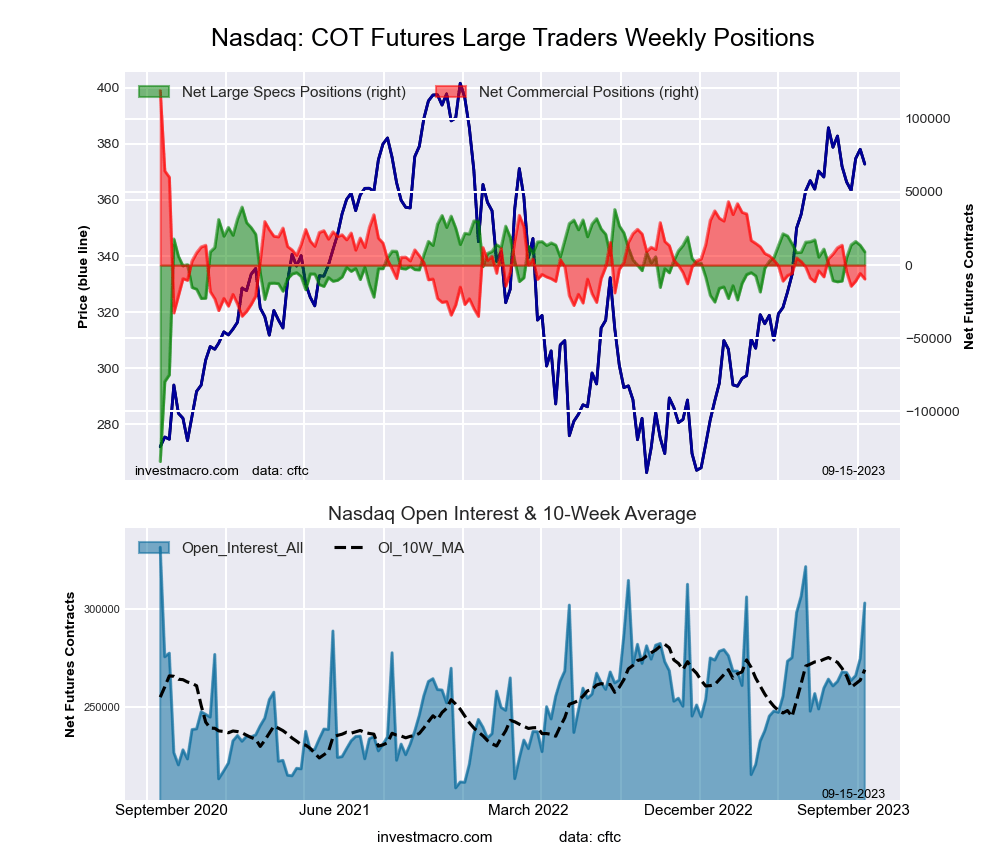 The Nasdaq Mini large speculator standing this week equaled a net position of 9,056 contracts in the data reported through Tuesday. This was a weekly decline of -4,494 contracts from the previous week which had a total of 13,550 net contracts.
This week’s current strength score (the trader positioning range over the past three years, measured from 0 to 100) shows the speculators are currently Bullish-Extreme with a score of 82.4 percent. The commercials are Bearish-Extreme with a score of 16.5 percent and the small traders (not shown in chart) are Bullish with a score of 66.2 percent.
Price Trend-Following Model: Uptrend
Our weekly trend-following model classifies the current market price position as: Uptrend. The current action for the model is considered to be: Hold – Maintain Long Position.
| Nasdaq Mini Futures Statistics | SPECULATORS | COMMERCIALS | SMALL TRADERS |
| – Percent of Open Interest Longs: | 22.6 | 56.6 | 14.8 |
| – Percent of Open Interest Shorts: | 19.7 | 59.7 | 14.7 |
| – Net Position: | 9,056 | -9,508 | 452 |
| – Gross Longs: | 68,674 | 171,570 | 44,891 |
| – Gross Shorts: | 59,618 | 181,078 | 44,439 |
| – Long to Short Ratio: | 1.2 to 1 | 0.9 to 1 | 1.0 to 1 |
| NET POSITION TREND: | |||
| – Strength Index Score (3 Year Range Pct): | 82.4 | 16.5 | 66.2 |
| – Strength Index Reading (3 Year Range): | Bullish-Extreme | Bearish-Extreme | Bullish |
| NET POSITION MOVEMENT INDEX: | |||
| – 6-Week Change in Strength Index: | 11.8 | -13.8 | 2.1 |
Russell 2000 Mini Futures:
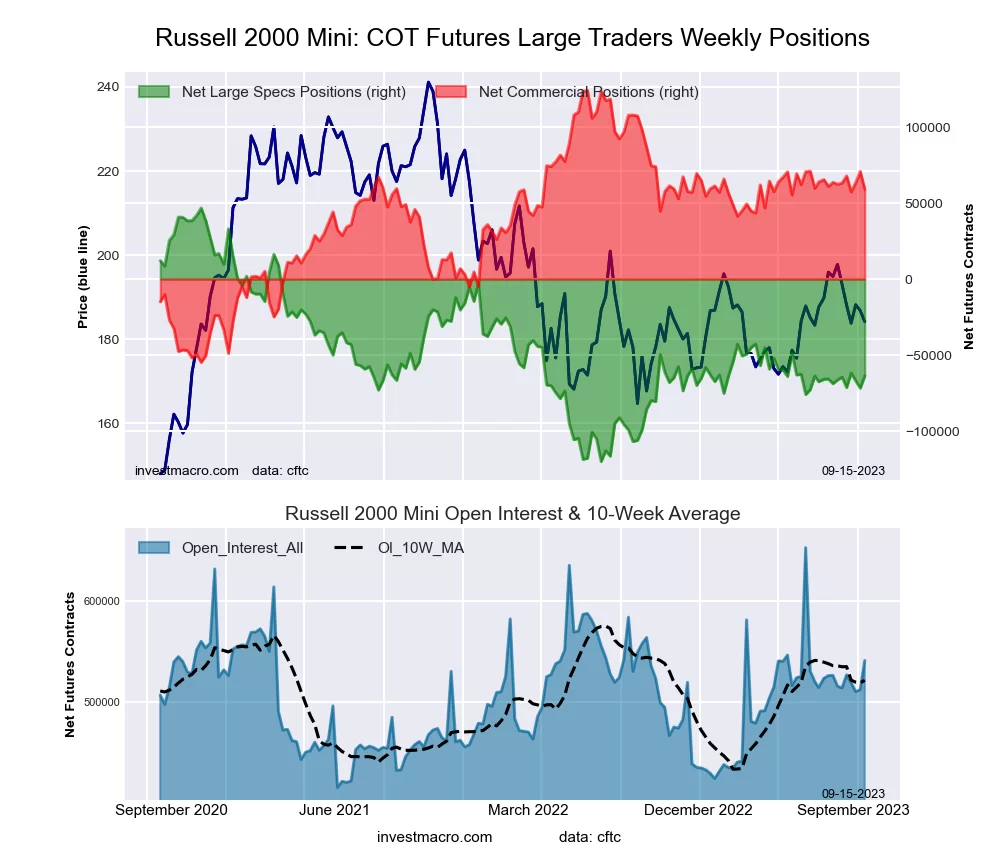 The Russell 2000 Mini large speculator standing this week equaled a net position of -63,615 contracts in the data reported through Tuesday. This was a weekly rise of 8,096 contracts from the previous week which had a total of -71,711 net contracts.
This week’s current strength score (the trader positioning range over the past three years, measured from 0 to 100) shows the speculators are currently Bearish with a score of 33.8 percent. The commercials are Bullish with a score of 63.7 percent and the small traders (not shown in chart) are Bearish with a score of 40.7 percent.
Price Trend-Following Model: Uptrend
Our weekly trend-following model classifies the current market price position as: Uptrend. The current action for the model is considered to be: Hold – Maintain Long Position.
| Russell 2000 Mini Futures Statistics | SPECULATORS | COMMERCIALS | SMALL TRADERS |
| – Percent of Open Interest Longs: | 8.7 | 81.9 | 5.8 |
| – Percent of Open Interest Shorts: | 20.5 | 71.0 | 4.9 |
| – Net Position: | -63,615 | 59,033 | 4,582 |
| – Gross Longs: | 47,088 | 443,198 | 31,308 |
| – Gross Shorts: | 110,703 | 384,165 | 26,726 |
| – Long to Short Ratio: | 0.4 to 1 | 1.2 to 1 | 1.2 to 1 |
| NET POSITION TREND: | |||
| – Strength Index Score (3 Year Range Pct): | 33.8 | 63.7 | 40.7 |
| – Strength Index Reading (3 Year Range): | Bearish | Bullish | Bearish |
| NET POSITION MOVEMENT INDEX: | |||
| – 6-Week Change in Strength Index: | 1.6 | -1.8 | 1.8 |
Nikkei Stock Average (USD) Futures:
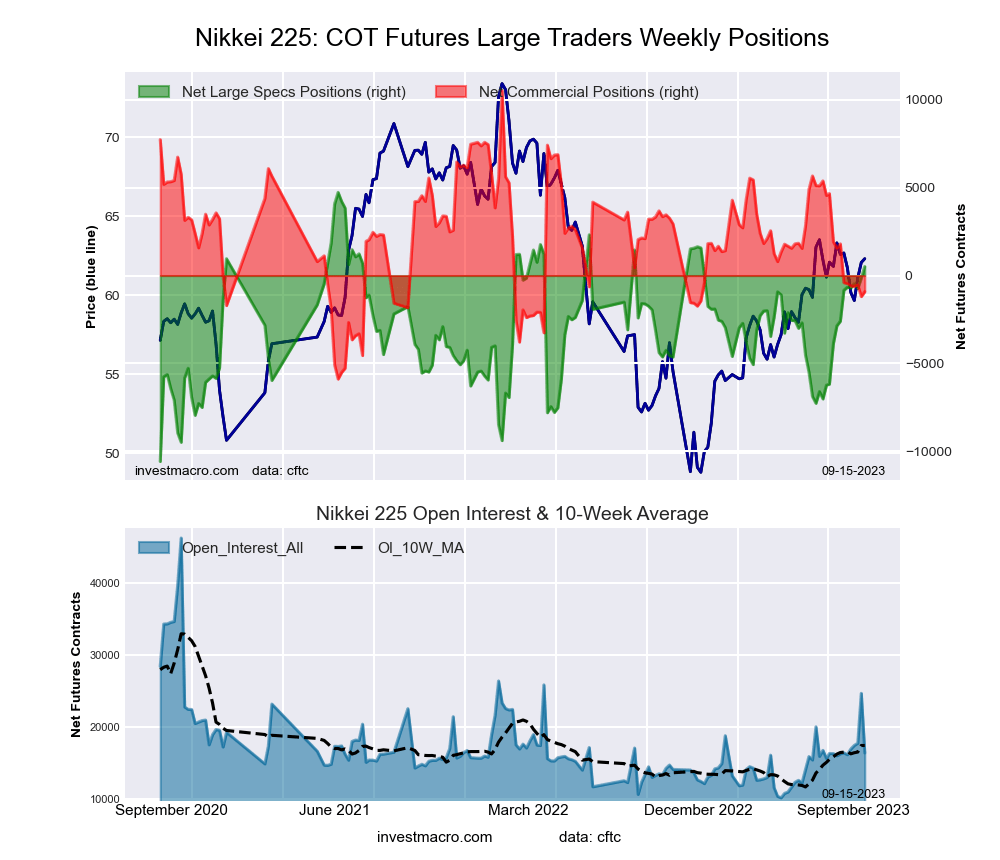 The Nikkei Stock Average (USD) large speculator standing this week equaled a net position of 514 contracts in the data reported through Tuesday. This was a weekly rise of 656 contracts from the previous week which had a total of -142 net contracts.
This week’s current strength score (the trader positioning range over the past three years, measured from 0 to 100) shows the speculators are currently Bullish with a score of 72.4 percent. The commercials are Bearish with a score of 30.3 percent and the small traders (not shown in chart) are Bearish with a score of 33.4 percent.
Price Trend-Following Model: Strong Uptrend
Our weekly trend-following model classifies the current market price position as: Strong Uptrend. The current action for the model is considered to be: Hold – Maintain Long Position.
| Nikkei Stock Average Futures Statistics | SPECULATORS | COMMERCIALS | SMALL TRADERS |
| – Percent of Open Interest Longs: | 10.9 | 68.5 | 20.6 |
| – Percent of Open Interest Shorts: | 7.8 | 74.1 | 18.1 |
| – Net Position: | 514 | -918 | 404 |
| – Gross Longs: | 1,793 | 11,249 | 3,383 |
| – Gross Shorts: | 1,279 | 12,167 | 2,979 |
| – Long to Short Ratio: | 1.4 to 1 | 0.9 to 1 | 1.1 to 1 |
| NET POSITION TREND: | |||
| – Strength Index Score (3 Year Range Pct): | 72.4 | 30.3 | 33.4 |
| – Strength Index Reading (3 Year Range): | Bullish | Bearish | Bearish |
| NET POSITION MOVEMENT INDEX: | |||
| – 6-Week Change in Strength Index: | 8.9 | -3.1 | -10.6 |
MSCI EAFE Mini Futures:
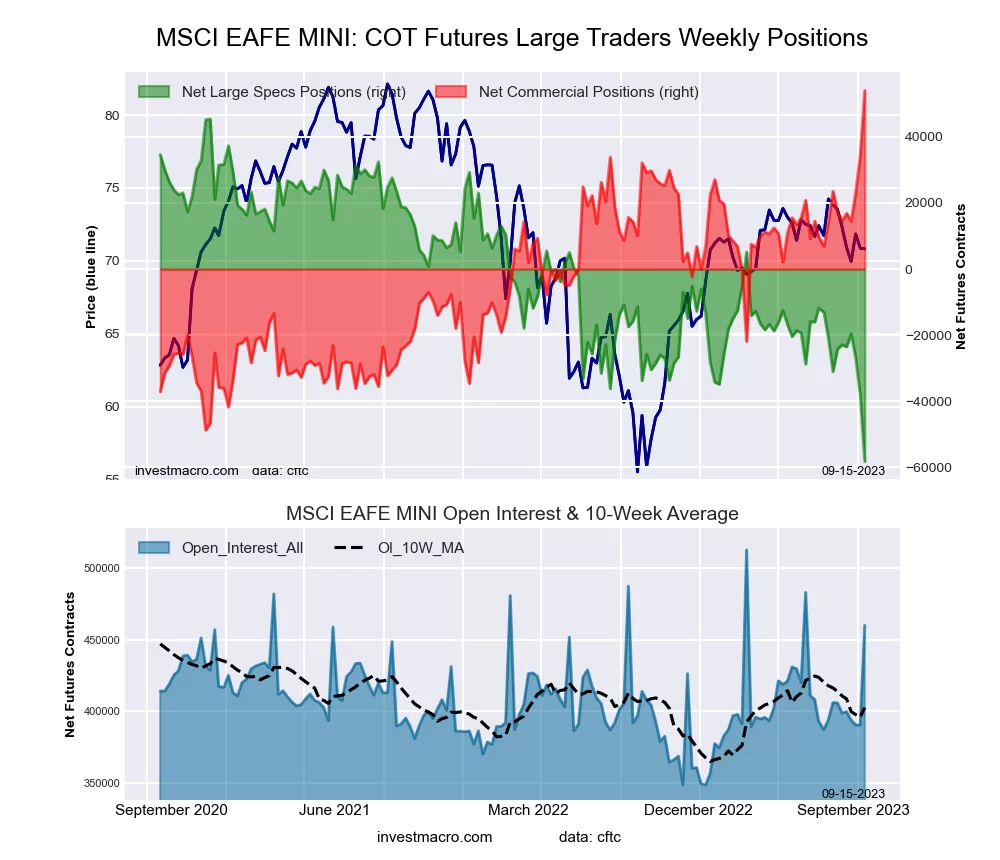 The MSCI EAFE Mini large speculator standing this week equaled a net position of -58,192 contracts in the data reported through Tuesday. This was a weekly lowering of -20,113 contracts from the previous week which had a total of -38,079 net contracts.
This week’s current strength score (the trader positioning range over the past three years, measured from 0 to 100) shows the speculators are currently Bearish-Extreme with a score of 0.0 percent. The commercials are Bullish-Extreme with a score of 100.0 percent and the small traders (not shown in chart) are Bearish with a score of 37.9 percent.
Price Trend-Following Model: Downtrend
Our weekly trend-following model classifies the current market price position as: Downtrend. The current action for the model is considered to be: Hold – Maintain Short Position.
| MSCI EAFE Mini Futures Statistics | SPECULATORS | COMMERCIALS | SMALL TRADERS |
| – Percent of Open Interest Longs: | 4.9 | 90.3 | 2.8 |
| – Percent of Open Interest Shorts: | 17.6 | 78.6 | 1.9 |
| – Net Position: | -58,192 | 54,008 | 4,184 |
| – Gross Longs: | 22,550 | 415,412 | 12,927 |
| – Gross Shorts: | 80,742 | 361,404 | 8,743 |
| – Long to Short Ratio: | 0.3 to 1 | 1.1 to 1 | 1.5 to 1 |
| NET POSITION TREND: | |||
| – Strength Index Score (3 Year Range Pct): | 0.0 | 100.0 | 37.9 |
| – Strength Index Reading (3 Year Range): | Bearish-Extreme | Bullish-Extreme | Bearish |
| NET POSITION MOVEMENT INDEX: | |||
| – 6-Week Change in Strength Index: | -32.8 | 35.7 | -13.4 |
Article By InvestMacro – Receive our weekly COT Newsletter
*COT Report: The COT data, released weekly to the public each Friday, is updated through the most recent Tuesday (data is 3 days old) and shows a quick view of how large speculators or non-commercials (for-profit traders) were positioned in the futures markets.
The CFTC categorizes trader positions according to commercial hedgers (traders who use futures contracts for hedging as part of the business), non-commercials (large traders who speculate to realize trading profits) and nonreportable traders (usually small traders/speculators) as well as their open interest (contracts open in the market at time of reporting). See CFTC criteria here.

- The US introduces new import tariffs for 60 countries. Brent crude surpasses $100 per barrel Jul 24, 2026
- USD/JPY Breaks Records: Nothing Slows the Yen’s Decline Jul 24, 2026
- Oil prices reached a 6‑week high. The AUD strengthened on the back of a strong labor‑market report Jul 23, 2026
- EUR/USD Recovers as Dollar Weakens Jul 23, 2026
- Bitcoin rose to $66,000. The New Zealand dollar continues to strengthen Jul 22, 2026
- Inflationary pressure is easing in Canada. In New Zealand, on the contrary, inflation is rising Jul 21, 2026
- GBP/USD Falls After Cabinet Changes Jul 21, 2026
- Geopolitical and macroeconomic conditions continue to pressure market sentiment Jul 20, 2026
- USD/JPY Poised to Continue Gains as Expensive Oil and Lack of Support Weigh on Yen Jul 20, 2026
- COT Metals Charts: Weekly Speculator Bets led by Copper & Steel Jul 18, 2026