By InvestMacro
Here are the latest charts and statistics for the Commitment of Traders (COT) data published by the Commodities Futures Trading Commission (CFTC).
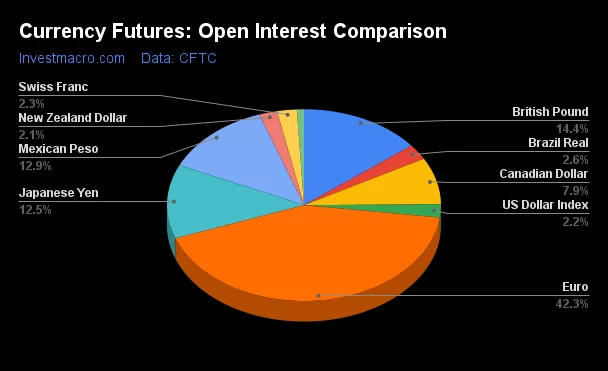
The latest COT data is updated through Tuesday July 18th and shows a quick view of how large market participants (for-profit speculators and commercial traders) were positioned in the futures markets. All currency positions are in direct relation to the US dollar where, for example, a bet for the euro is a bet that the euro will rise versus the dollar while a bet against the euro will be a bet that the euro will decline versus the dollar.
The COT currency market speculator bets were a bit lower this week as five out of the eleven currency markets we cover had higher positioning while the other six markets had lower speculator contracts.
Free Reports:
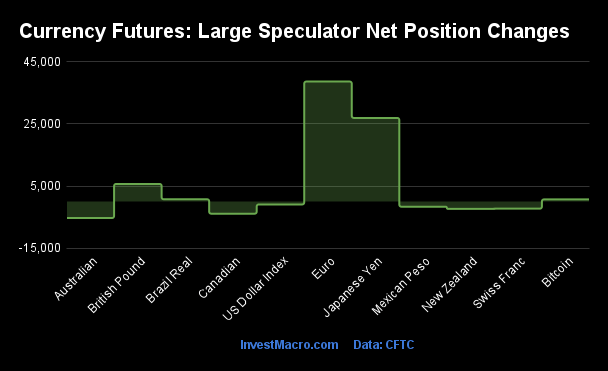
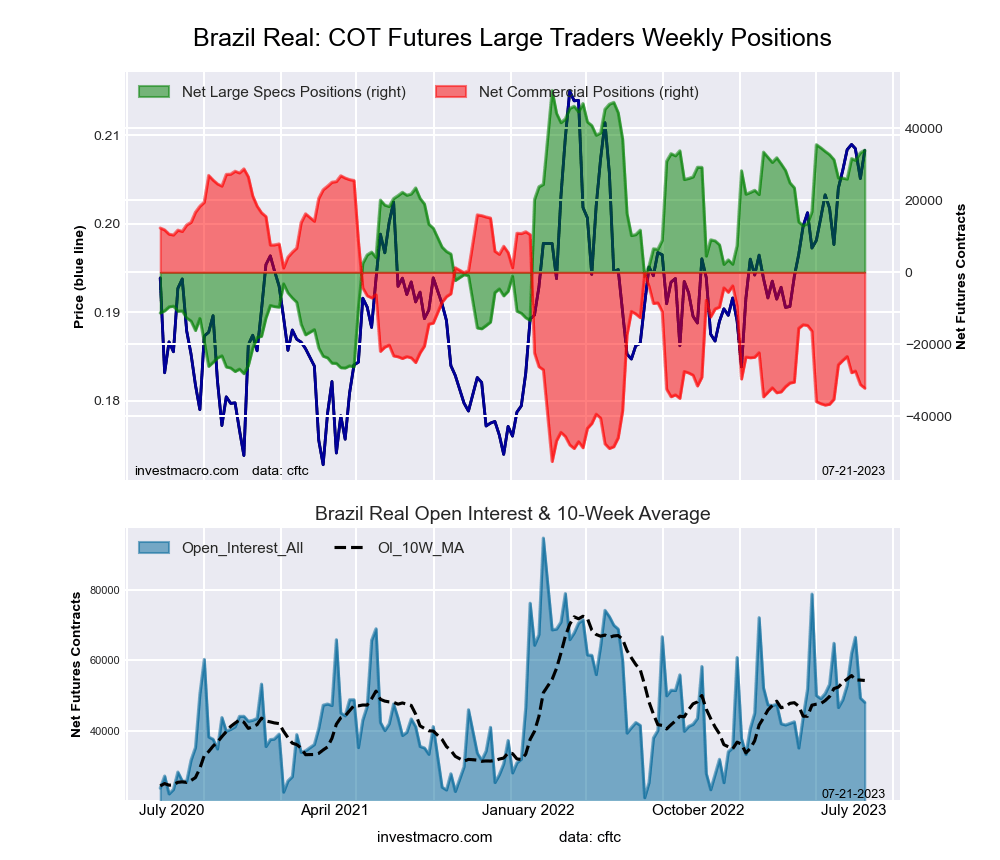
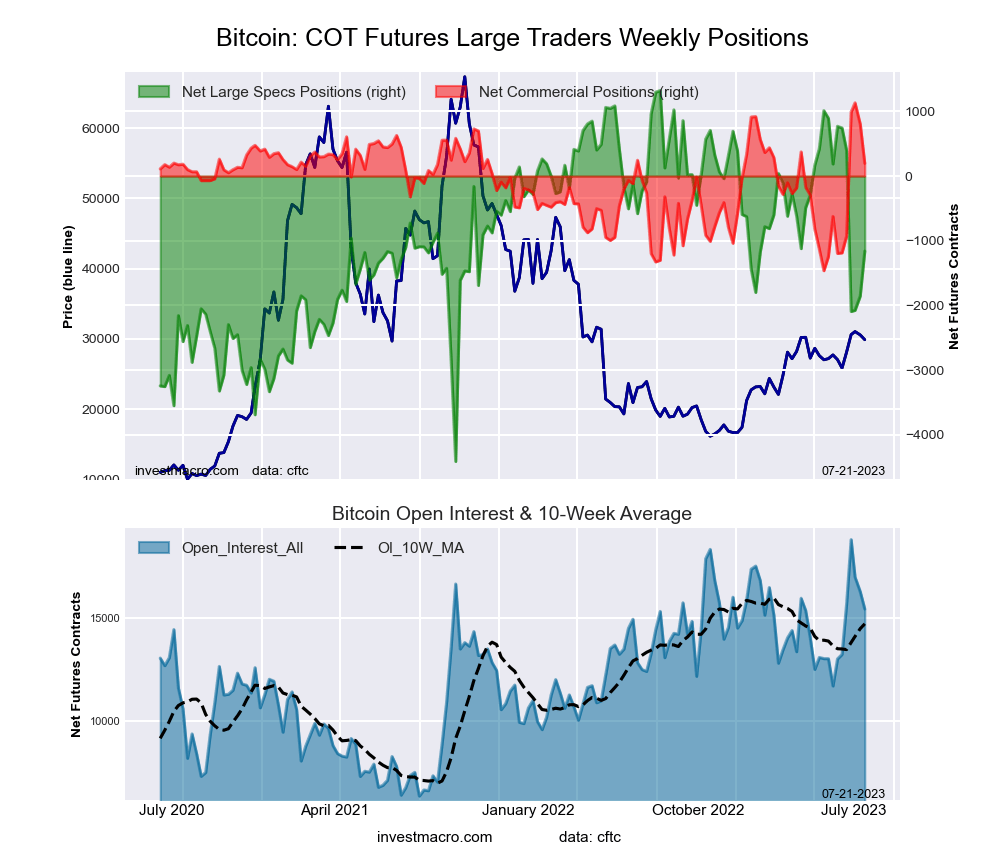
Leading the gains for the currency markets was the EuroFX (38,670 contracts) with the Japanese Yen (26,943 contracts), the British Pound (5,666 contracts), the Brazilian Real (735 contracts) and Bitcoin (694 contracts) also showing positive weeks.
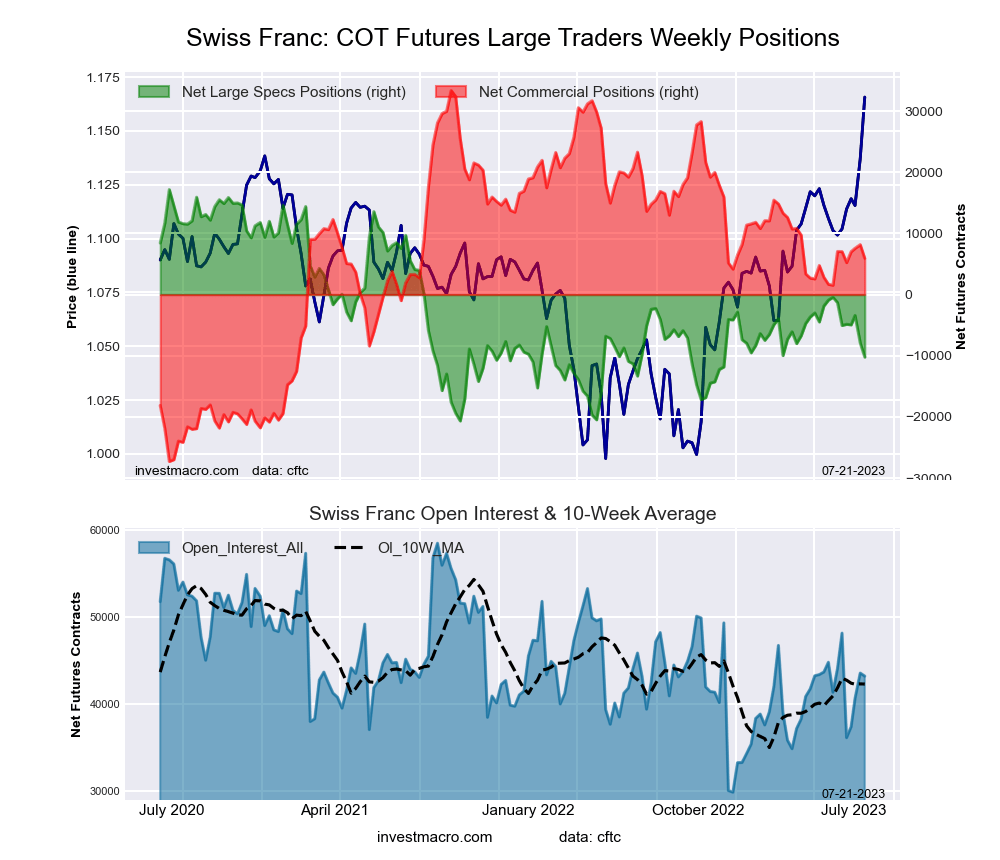
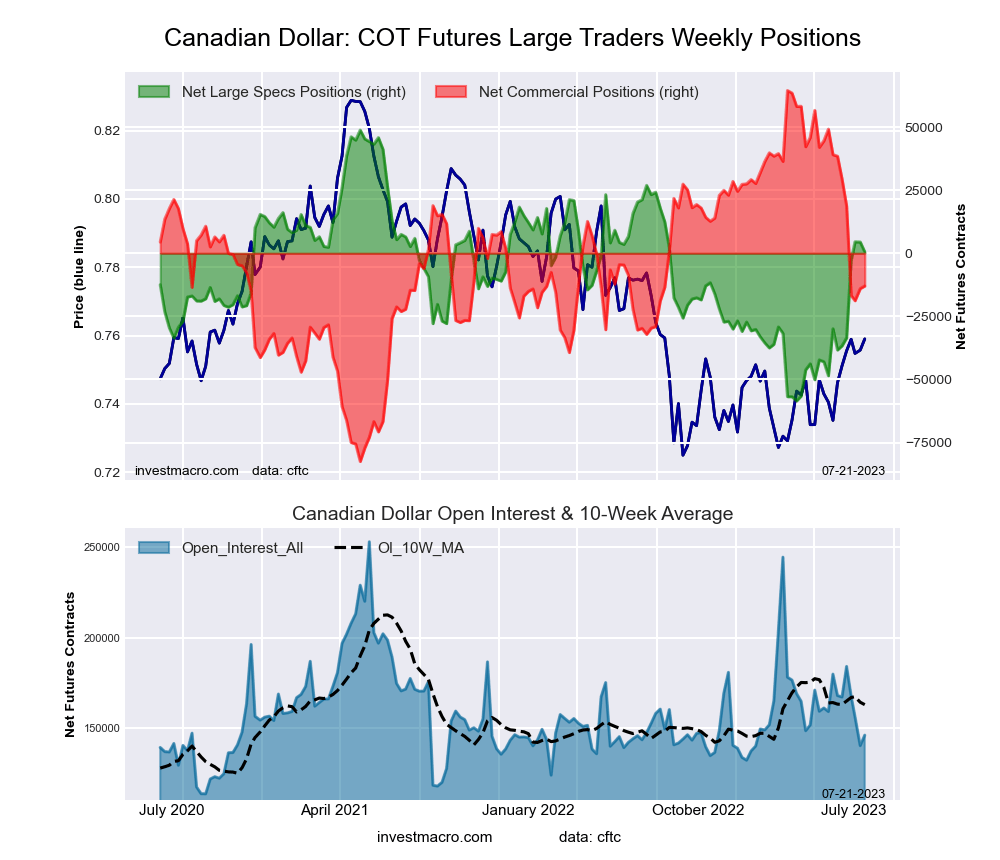
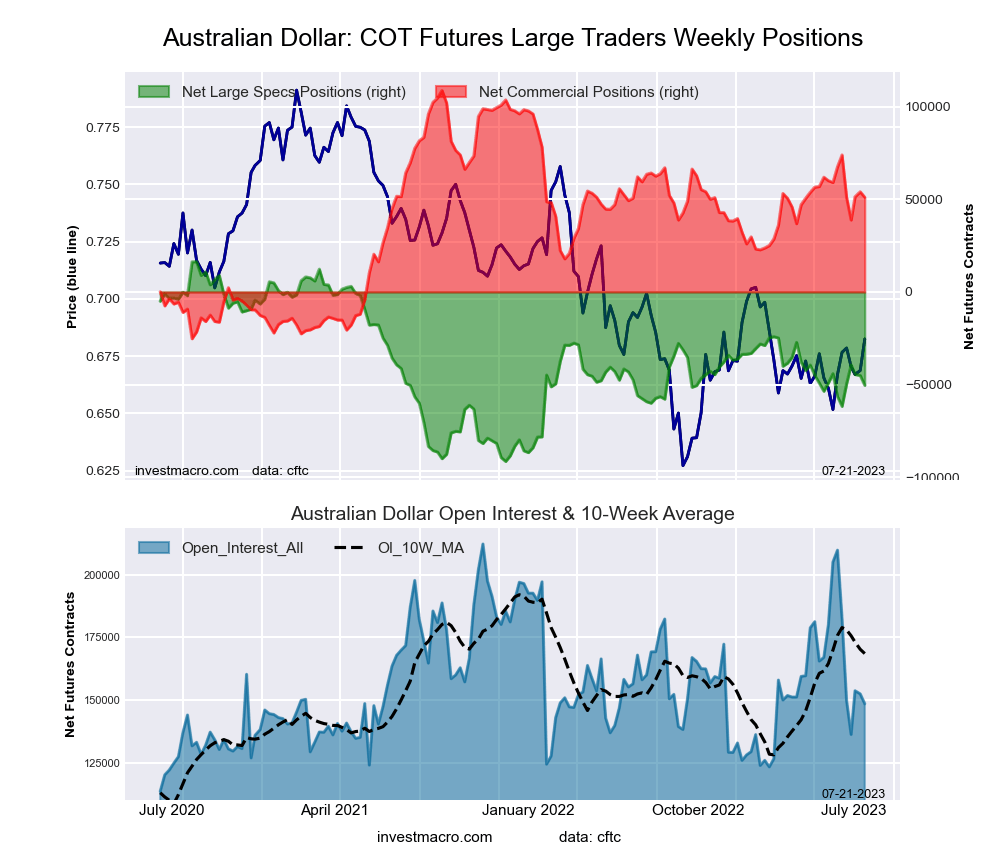
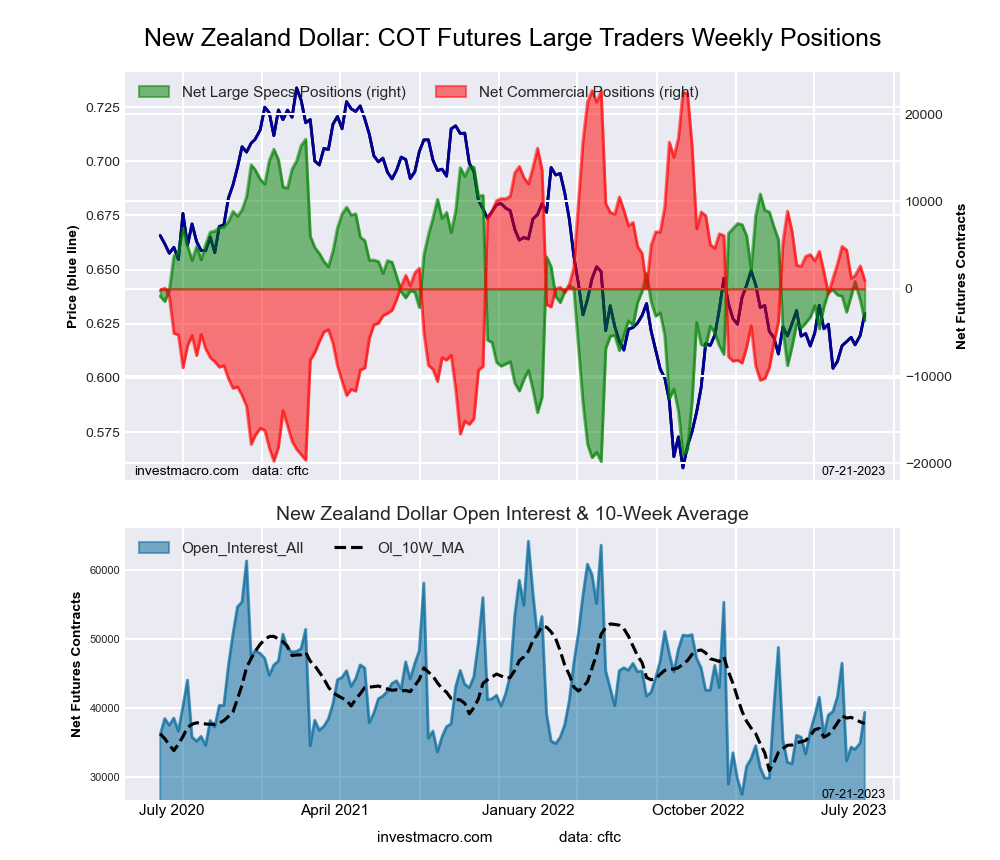
The currencies seeing declines in speculator bets on the week were the Australian Dollar (-5,317 contracts), the Canadian Dollar (-3,923 contracts), the New Zealand Dollar (-2,375 contracts), the Swiss Franc (-2,304 contracts), the Mexican Peso (-1,674 contracts) and the US Dollar Index (-944 contracts) also registering lower bets on the week.
Highlighting the COT currency’s data is the strength of this week’s moves in the speculator’s positioning of the Euro and Japanese Yen.
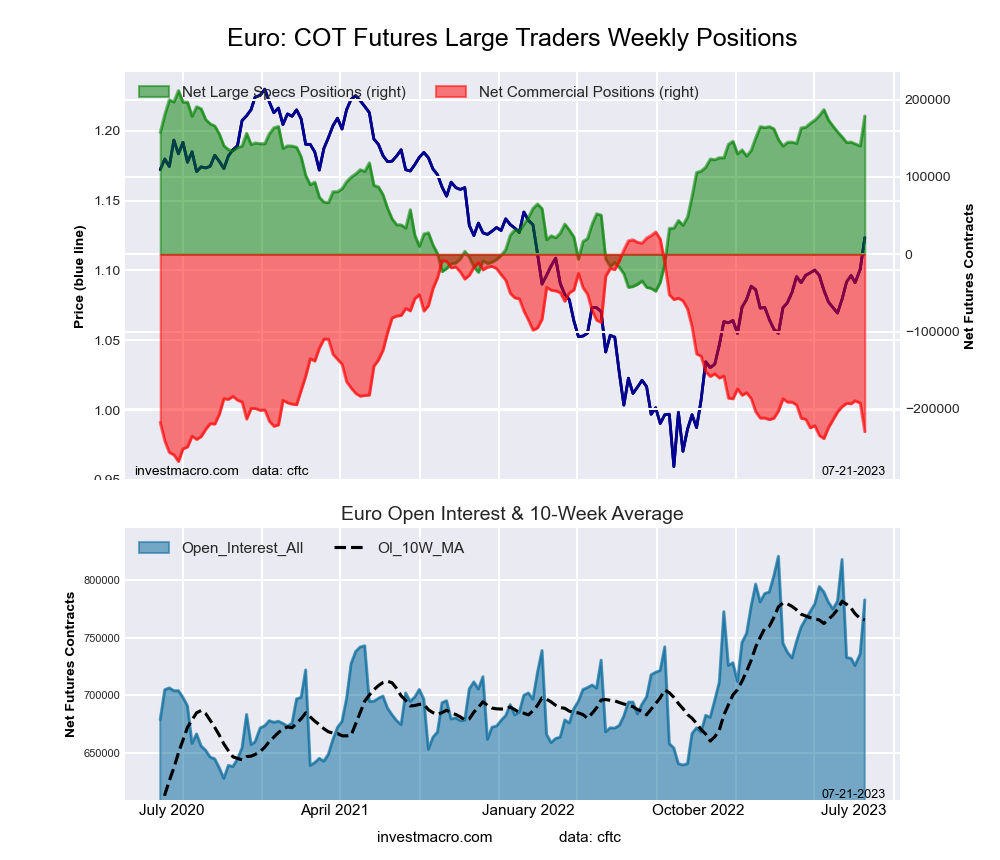
Large speculative Euro positions jumped this week by over +38,000 contracts and reversed a recent decline for the Euro positions in seven out of the previous eight weeks. This gain in bullish bets has pushed the overall net speculator position to the most bullish level of the past nine weeks at a total of +178,832 contracts.
The Euro currency’s strength has been on display over the past few months as the EURUSD exchange rate touched a one-year high this week at over the 1.1300 level. The EURUSD did close the week lower after hitting the one-year high but is now quite a ways off the 2022 low of 0.9508 that was touched in September.
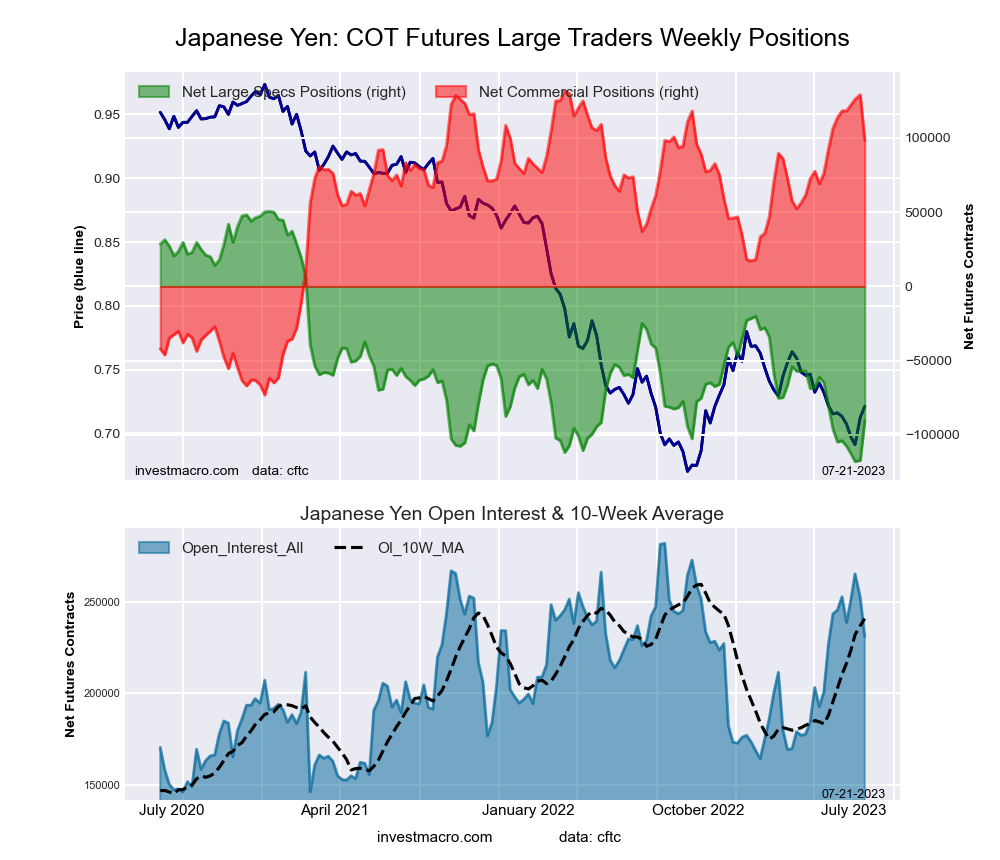
The large speculative yen positions also surged this week by over +26,000 net contracts and gained for the second week in a row. The yen speculator positioning has been quite the opposite of the Euro as the Bank of Japan has maintained a policy of no interest rate increases which has prompted speculators to have large bearish positions in the yen. The speculator position on July 3rd marked the most bearish level since January of 2018 at a total of -117,920 contracts.
The yen positions in the past two weeks have improved though and this week’s gain brings the current bearish position (at -90,239 contracts) under the -100,000 contract threshold for the first time since May.
The yen’s exchange rate versus the US Dollar remains historically weak and in a downtrend in our trend model. The USDJPY exchange rate rose back over the 140.00 threshold this week (US Dollar strength/Japanese Yen weakness) after dipping below that level last week.
This upcoming week will be a potentially volatile week in currencies as the Bank of Japan and the US Federal Reserve will have central bank meetings and announce their respective policy outlooks.
| Jul-18-2023 | OI | OI-Index | Spec-Net | Spec-Index | Com-Net | COM-Index | Smalls-Net | Smalls-Index |
|---|---|---|---|---|---|---|---|---|
| USD Index | 41,045 | 37 | 11,067 | 43 | -11,617 | 57 | 550 | 23 |
| EUR | 783,132 | 80 | 178,832 | 87 | -229,343 | 13 | 50,511 | 60 |
| GBP | 265,766 | 77 | 63,729 | 100 | -81,606 | 0 | 17,877 | 93 |
| JPY | 230,932 | 63 | -90,239 | 16 | 98,195 | 84 | -7,956 | 37 |
| CHF | 43,213 | 47 | -10,211 | 28 | 5,927 | 55 | 4,284 | 72 |
| CAD | 146,171 | 23 | 521 | 55 | -12,991 | 47 | 12,470 | 50 |
| AUD | 148,592 | 35 | -50,401 | 38 | 51,045 | 57 | -644 | 51 |
| NZD | 39,402 | 32 | -3,626 | 44 | 938 | 49 | 2,688 | 82 |
| MXN | 238,006 | 51 | 94,492 | 97 | -98,239 | 3 | 3,747 | 35 |
| RUB | 20,930 | 4 | 7,543 | 31 | -7,150 | 69 | -393 | 24 |
| BRL | 48,146 | 37 | 33,933 | 79 | -32,196 | 25 | -1,737 | 30 |
| Bitcoin | 15,455 | 73 | -1,161 | 57 | 196 | 0 | 965 | 35 |
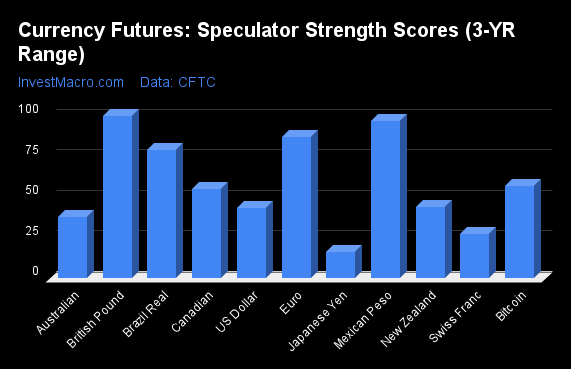
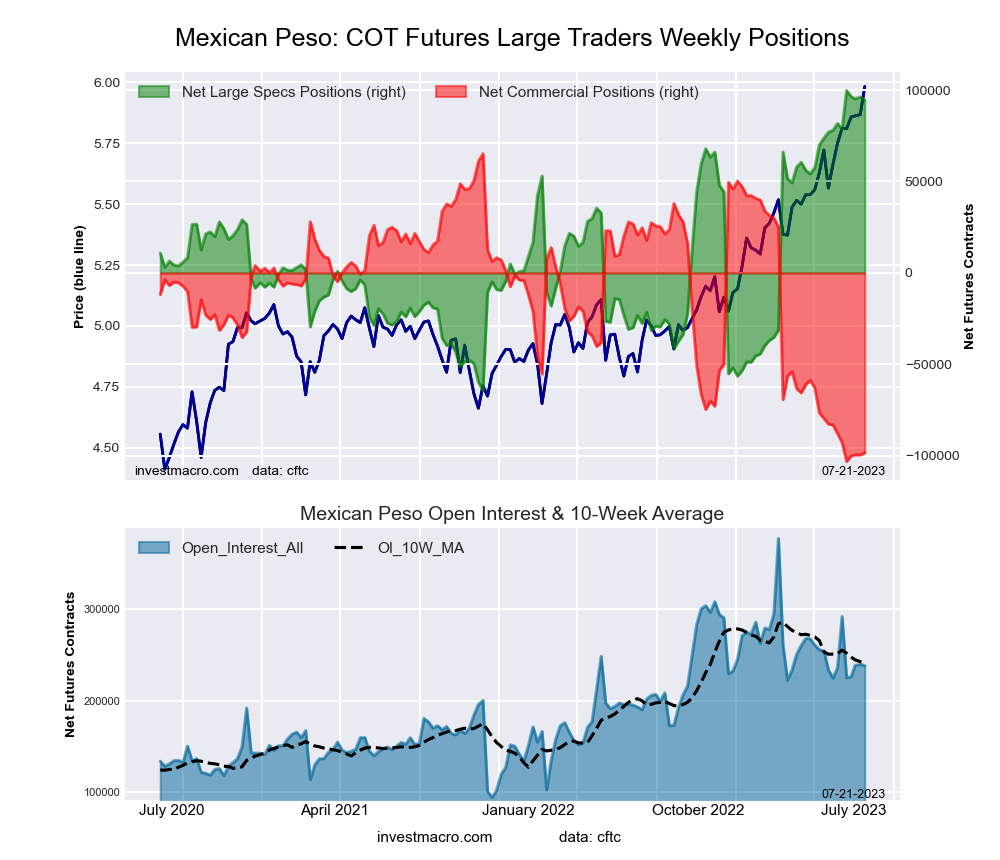
COT Strength Scores (a normalized measure of Speculator positions over a 3-Year range, from 0 to 100 where above 80 is Extreme-Bullish and below 20 is Extreme-Bearish) showed that the British Pound (100 percent) and the Mexican Peso (97 percent) lead the currency markets this week. The EuroFX (87 percent), Brazilian Real (79 percent) and the Bitcoin (57 percent) come in as the next highest in the weekly strength scores.
On the downside, the Japanese Yen (16 percent) and the Swiss Franc (28 percent) come in at the lowest strength levels currently. The next lowest strength scores are the Australian Dollar (38 percent) and the US Dollar Index (43 percent).
Strength Statistics:
US Dollar Index (43.4 percent) vs US Dollar Index previous week (45.0 percent)
EuroFX (87.3 percent) vs EuroFX previous week (72.4 percent)
British Pound Sterling (100.0 percent) vs British Pound Sterling previous week (96.1 percent)
Japanese Yen (16.4 percent) vs Japanese Yen previous week (0.4 percent)
Swiss Franc (27.6 percent) vs Swiss Franc previous week (33.7 percent)
Canadian Dollar (55.0 percent) vs Canadian Dollar previous week (58.7 percent)
Australian Dollar (38.1 percent) vs Australian Dollar previous week (43.0 percent)
New Zealand Dollar (43.8 percent) vs New Zealand Dollar previous week (50.2 percent)
Mexican Peso (96.8 percent) vs Mexican Peso previous week (97.8 percent)
Brazilian Real (78.9 percent) vs Brazilian Real previous week (78.0 percent)
Bitcoin (56.7 percent) vs Bitcoin previous week (44.6 percent)
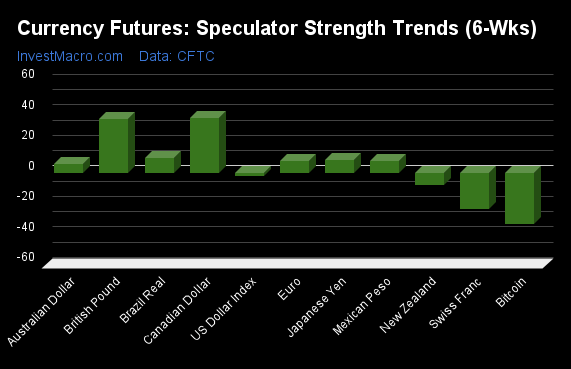
COT Strength Score Trends (or move index, calculates the 6-week changes in strength scores) showed that the British Pound (36 percent) and the Canadian Dollar (36 percent) lead the past six weeks trends for the currencies. The Brazilian Real (10 percent), the Japanese Yen (9 percent) and the EuroFX (8 percent) are the next highest positive movers in the latest trends data.
Bitcoin (-34 percent) leads the downside trend scores currently with the Swiss Franc (-24 percent), New Zealand Dollar (-8 percent) and the US Dollar Index (-2 percent) following next with lower trend scores.
Strength Trend Statistics:
US Dollar Index (-1.9 percent) vs US Dollar Index previous week (-1.3 percent)
EuroFX (7.9 percent) vs EuroFX previous week (-9.9 percent)
British Pound Sterling (35.6 percent) vs British Pound Sterling previous week (31.1 percent)
Japanese Yen (8.7 percent) vs Japanese Yen previous week (-12.5 percent)
Swiss Franc (-23.5 percent) vs Swiss Franc previous week (-19.8 percent)
Canadian Dollar (36.2 percent) vs Canadian Dollar previous week (32.0 percent)
Australian Dollar (5.6 percent) vs Australian Dollar previous week (-0.9 percent)
New Zealand Dollar (-7.9 percent) vs New Zealand Dollar previous week (-3.0 percent)
Mexican Peso (7.8 percent) vs Mexican Peso previous week (11.1 percent)
Brazilian Real (9.9 percent) vs Brazilian Real previous week (2.4 percent)
Bitcoin (-33.7 percent) vs Bitcoin previous week (-35.6 percent)
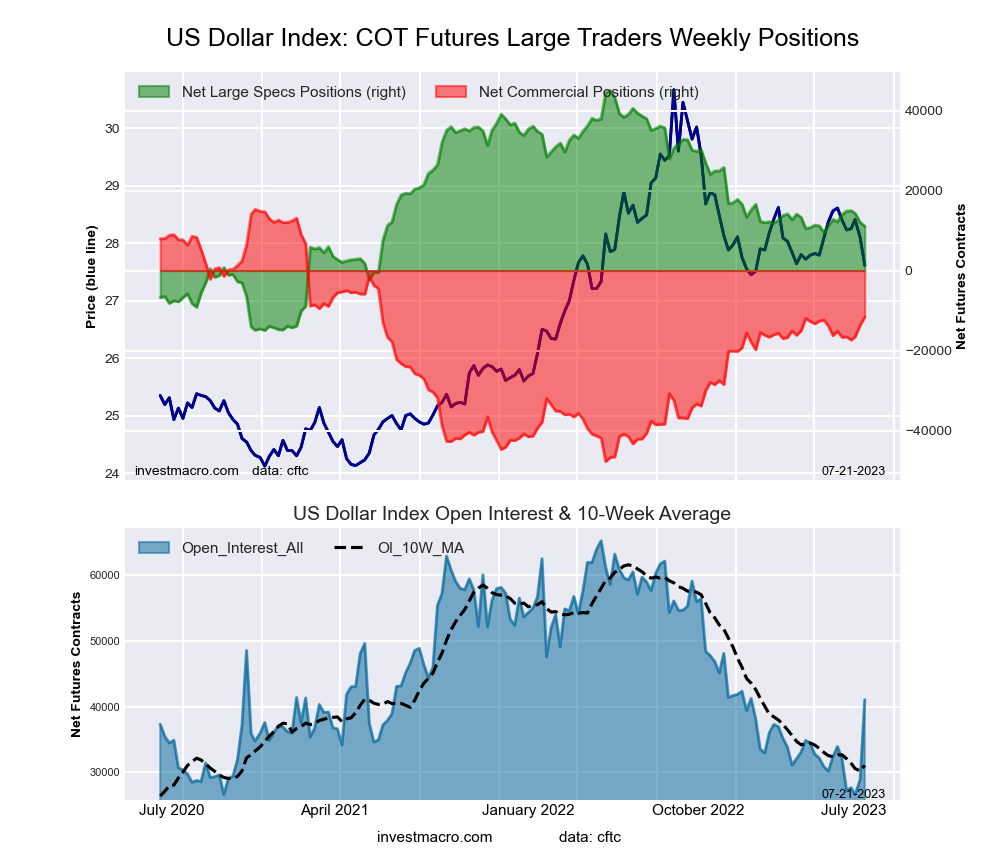
This week’s current strength score (the trader positioning range over the past three years, measured from 0 to 100) shows the speculators are currently Bearish with a score of 43.4 percent. The commercials are Bullish with a score of 57.3 percent and the small traders (not shown in chart) are Bearish with a score of 22.5 percent.
Our weekly trend-following model classifies the current market price position as: Weak Uptrend. The current action for the model is considered to be: Hold – Maintain Long Position.
| US DOLLAR INDEX Statistics | SPECULATORS | COMMERCIALS | SMALL TRADERS |
| – Percent of Open Interest Longs: | 66.8 | 19.5 | 10.2 |
| – Percent of Open Interest Shorts: | 39.8 | 47.8 | 8.9 |
| – Net Position: | 11,067 | -11,617 | 550 |
| – Gross Longs: | 27,410 | 7,994 | 4,193 |
| – Gross Shorts: | 16,343 | 19,611 | 3,643 |
| – Long to Short Ratio: | 1.7 to 1 | 0.4 to 1 | 1.2 to 1 |
| NET POSITION TREND: | |||
| – Strength Index Score (3 Year Range Pct): | 43.4 | 57.3 | 22.5 |
| – Strength Index Reading (3 Year Range): | Bearish | Bullish | Bearish |
| NET POSITION MOVEMENT INDEX: | |||
| – 6-Week Change in Strength Index: | -1.9 | 5.6 | -26.2 |
This week’s current strength score (the trader positioning range over the past three years, measured from 0 to 100) shows the speculators are currently Bullish-Extreme with a score of 87.3 percent. The commercials are Bearish-Extreme with a score of 13.0 percent and the small traders (not shown in chart) are Bullish with a score of 59.6 percent.
Our weekly trend-following model classifies the current market price position as: Strong Uptrend. The current action for the model is considered to be: Hold – Maintain Long Position.
| EURO Currency Statistics | SPECULATORS | COMMERCIALS | SMALL TRADERS |
| – Percent of Open Interest Longs: | 33.8 | 51.9 | 12.4 |
| – Percent of Open Interest Shorts: | 10.9 | 81.2 | 5.9 |
| – Net Position: | 178,832 | -229,343 | 50,511 |
| – Gross Longs: | 264,514 | 406,328 | 97,050 |
| – Gross Shorts: | 85,682 | 635,671 | 46,539 |
| – Long to Short Ratio: | 3.1 to 1 | 0.6 to 1 | 2.1 to 1 |
| NET POSITION TREND: | |||
| – Strength Index Score (3 Year Range Pct): | 87.3 | 13.0 | 59.6 |
| – Strength Index Reading (3 Year Range): | Bullish-Extreme | Bearish-Extreme | Bullish |
| NET POSITION MOVEMENT INDEX: | |||
| – 6-Week Change in Strength Index: | 7.9 | -8.6 | 8.0 |
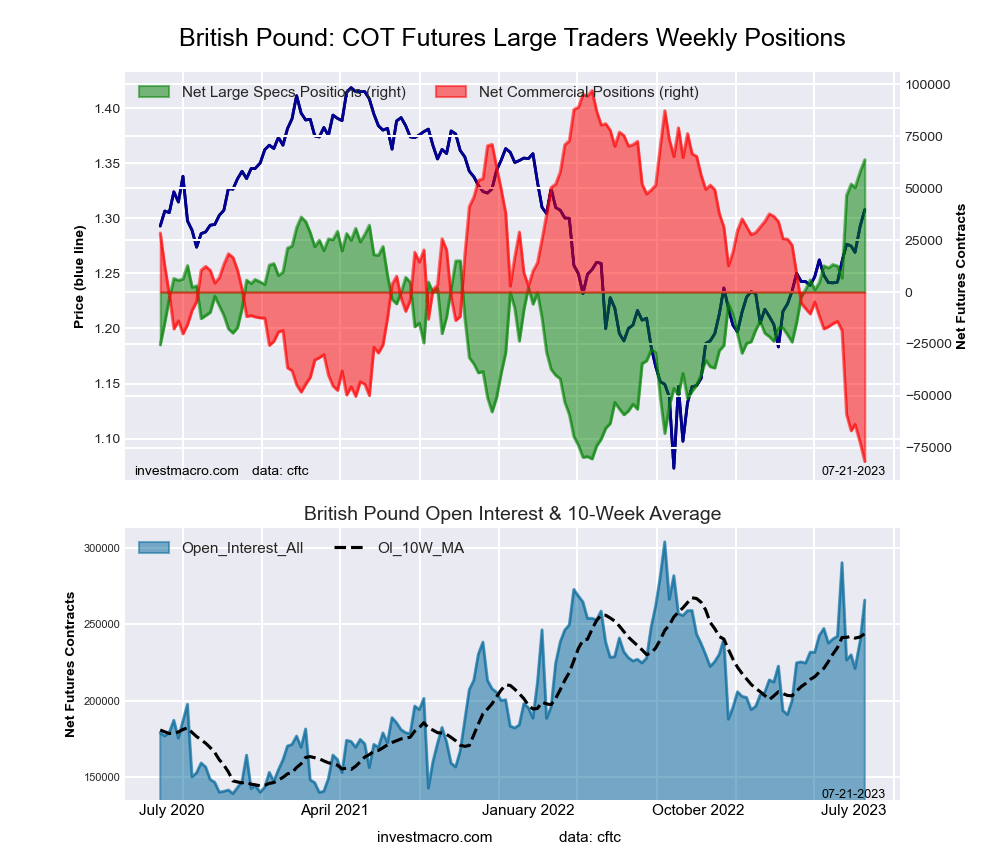
This week’s current strength score (the trader positioning range over the past three years, measured from 0 to 100) shows the speculators are currently Bullish-Extreme with a score of 100.0 percent. The commercials are Bearish-Extreme with a score of 0.0 percent and the small traders (not shown in chart) are Bullish-Extreme with a score of 93.1 percent.
Our weekly trend-following model classifies the current market price position as: Uptrend. The current action for the model is considered to be: Hold – Maintain Long Position.
| BRITISH POUND Statistics | SPECULATORS | COMMERCIALS | SMALL TRADERS |
| – Percent of Open Interest Longs: | 50.9 | 28.7 | 15.0 |
| – Percent of Open Interest Shorts: | 26.9 | 59.4 | 8.2 |
| – Net Position: | 63,729 | -81,606 | 17,877 |
| – Gross Longs: | 135,269 | 76,229 | 39,762 |
| – Gross Shorts: | 71,540 | 157,835 | 21,885 |
| – Long to Short Ratio: | 1.9 to 1 | 0.5 to 1 | 1.8 to 1 |
| NET POSITION TREND: | |||
| – Strength Index Score (3 Year Range Pct): | 100.0 | 0.0 | 93.1 |
| – Strength Index Reading (3 Year Range): | Bullish-Extreme | Bearish-Extreme | Bullish-Extreme |
| NET POSITION MOVEMENT INDEX: | |||
| – 6-Week Change in Strength Index: | 35.6 | -37.8 | 31.9 |
This week’s current strength score (the trader positioning range over the past three years, measured from 0 to 100) shows the speculators are currently Bearish-Extreme with a score of 16.4 percent. The commercials are Bullish-Extreme with a score of 83.6 percent and the small traders (not shown in chart) are Bearish with a score of 37.3 percent.
Our weekly trend-following model classifies the current market price position as: Downtrend. The current action for the model is considered to be: Hold – Maintain Short Position.
| JAPANESE YEN Statistics | SPECULATORS | COMMERCIALS | SMALL TRADERS |
| – Percent of Open Interest Longs: | 12.9 | 73.8 | 12.2 |
| – Percent of Open Interest Shorts: | 52.0 | 31.3 | 15.6 |
| – Net Position: | -90,239 | 98,195 | -7,956 |
| – Gross Longs: | 29,776 | 170,491 | 28,148 |
| – Gross Shorts: | 120,015 | 72,296 | 36,104 |
| – Long to Short Ratio: | 0.2 to 1 | 2.4 to 1 | 0.8 to 1 |
| NET POSITION TREND: | |||
| – Strength Index Score (3 Year Range Pct): | 16.4 | 83.6 | 37.3 |
| – Strength Index Reading (3 Year Range): | Bearish-Extreme | Bullish-Extreme | Bearish |
| NET POSITION MOVEMENT INDEX: | |||
| – 6-Week Change in Strength Index: | 8.7 | -7.6 | 2.0 |
This week’s current strength score (the trader positioning range over the past three years, measured from 0 to 100) shows the speculators are currently Bearish with a score of 27.6 percent. The commercials are Bullish with a score of 54.8 percent and the small traders (not shown in chart) are Bullish with a score of 72.0 percent.
Our weekly trend-following model classifies the current market price position as: Strong Uptrend. The current action for the model is considered to be: Hold – Maintain Long Position.
| SWISS FRANC Statistics | SPECULATORS | COMMERCIALS | SMALL TRADERS |
| – Percent of Open Interest Longs: | 15.7 | 42.1 | 42.0 |
| – Percent of Open Interest Shorts: | 39.3 | 28.4 | 32.1 |
| – Net Position: | -10,211 | 5,927 | 4,284 |
| – Gross Longs: | 6,772 | 18,183 | 18,158 |
| – Gross Shorts: | 16,983 | 12,256 | 13,874 |
| – Long to Short Ratio: | 0.4 to 1 | 1.5 to 1 | 1.3 to 1 |
| NET POSITION TREND: | |||
| – Strength Index Score (3 Year Range Pct): | 27.6 | 54.8 | 72.0 |
| – Strength Index Reading (3 Year Range): | Bearish | Bullish | Bullish |
| NET POSITION MOVEMENT INDEX: | |||
| – 6-Week Change in Strength Index: | -23.5 | -1.8 | 33.9 |
This week’s current strength score (the trader positioning range over the past three years, measured from 0 to 100) shows the speculators are currently Bullish with a score of 55.0 percent. The commercials are Bearish with a score of 47.3 percent and the small traders (not shown in chart) are Bullish with a score of 50.5 percent.
Our weekly trend-following model classifies the current market price position as: Uptrend. The current action for the model is considered to be: Hold – Maintain Long Position.
| CANADIAN DOLLAR Statistics | SPECULATORS | COMMERCIALS | SMALL TRADERS |
| – Percent of Open Interest Longs: | 23.2 | 50.5 | 24.6 |
| – Percent of Open Interest Shorts: | 22.8 | 59.4 | 16.0 |
| – Net Position: | 521 | -12,991 | 12,470 |
| – Gross Longs: | 33,877 | 73,833 | 35,907 |
| – Gross Shorts: | 33,356 | 86,824 | 23,437 |
| – Long to Short Ratio: | 1.0 to 1 | 0.9 to 1 | 1.5 to 1 |
| NET POSITION TREND: | |||
| – Strength Index Score (3 Year Range Pct): | 55.0 | 47.3 | 50.5 |
| – Strength Index Reading (3 Year Range): | Bullish | Bearish | Bullish |
| NET POSITION MOVEMENT INDEX: | |||
| – 6-Week Change in Strength Index: | 36.2 | -35.0 | 28.0 |
This week’s current strength score (the trader positioning range over the past three years, measured from 0 to 100) shows the speculators are currently Bearish with a score of 38.1 percent. The commercials are Bullish with a score of 57.0 percent and the small traders (not shown in chart) are Bullish with a score of 50.9 percent.
Our weekly trend-following model classifies the current market price position as: Strong Uptrend. The current action for the model is considered to be: Hold – Maintain Long Position.
| AUSTRALIAN DOLLAR Statistics | SPECULATORS | COMMERCIALS | SMALL TRADERS |
| – Percent of Open Interest Longs: | 25.7 | 57.2 | 14.5 |
| – Percent of Open Interest Shorts: | 59.7 | 22.8 | 14.9 |
| – Net Position: | -50,401 | 51,045 | -644 |
| – Gross Longs: | 38,252 | 84,937 | 21,539 |
| – Gross Shorts: | 88,653 | 33,892 | 22,183 |
| – Long to Short Ratio: | 0.4 to 1 | 2.5 to 1 | 1.0 to 1 |
| NET POSITION TREND: | |||
| – Strength Index Score (3 Year Range Pct): | 38.1 | 57.0 | 50.9 |
| – Strength Index Reading (3 Year Range): | Bearish | Bullish | Bullish |
| NET POSITION MOVEMENT INDEX: | |||
| – 6-Week Change in Strength Index: | 5.6 | -12.3 | 25.3 |
This week’s current strength score (the trader positioning range over the past three years, measured from 0 to 100) shows the speculators are currently Bearish with a score of 43.8 percent. The commercials are Bearish with a score of 48.7 percent and the small traders (not shown in chart) are Bullish-Extreme with a score of 81.9 percent.
Our weekly trend-following model classifies the current market price position as: Strong Downtrend. The current action for the model is considered to be: Hold – Maintain Short Position.
| NEW ZEALAND DOLLAR Statistics | SPECULATORS | COMMERCIALS | SMALL TRADERS |
| – Percent of Open Interest Longs: | 33.5 | 52.4 | 13.0 |
| – Percent of Open Interest Shorts: | 42.7 | 50.0 | 6.2 |
| – Net Position: | -3,626 | 938 | 2,688 |
| – Gross Longs: | 13,193 | 20,654 | 5,117 |
| – Gross Shorts: | 16,819 | 19,716 | 2,429 |
| – Long to Short Ratio: | 0.8 to 1 | 1.0 to 1 | 2.1 to 1 |
| NET POSITION TREND: | |||
| – Strength Index Score (3 Year Range Pct): | 43.8 | 48.7 | 81.9 |
| – Strength Index Reading (3 Year Range): | Bearish | Bearish | Bullish-Extreme |
| NET POSITION MOVEMENT INDEX: | |||
| – 6-Week Change in Strength Index: | -7.9 | -4.5 | 57.6 |
This week’s current strength score (the trader positioning range over the past three years, measured from 0 to 100) shows the speculators are currently Bullish-Extreme with a score of 96.8 percent. The commercials are Bearish-Extreme with a score of 2.9 percent and the small traders (not shown in chart) are Bearish with a score of 35.1 percent.
Our weekly trend-following model classifies the current market price position as: Uptrend. The current action for the model is considered to be: Hold – Maintain Long Position.
| MEXICAN PESO Statistics | SPECULATORS | COMMERCIALS | SMALL TRADERS |
| – Percent of Open Interest Longs: | 51.6 | 44.0 | 3.6 |
| – Percent of Open Interest Shorts: | 11.9 | 85.2 | 2.1 |
| – Net Position: | 94,492 | -98,239 | 3,747 |
| – Gross Longs: | 122,811 | 104,617 | 8,638 |
| – Gross Shorts: | 28,319 | 202,856 | 4,891 |
| – Long to Short Ratio: | 4.3 to 1 | 0.5 to 1 | 1.8 to 1 |
| NET POSITION TREND: | |||
| – Strength Index Score (3 Year Range Pct): | 96.8 | 2.9 | 35.1 |
| – Strength Index Reading (3 Year Range): | Bullish-Extreme | Bearish-Extreme | Bearish |
| NET POSITION MOVEMENT INDEX: | |||
| – 6-Week Change in Strength Index: | 7.8 | -6.2 | -15.1 |
This week’s current strength score (the trader positioning range over the past three years, measured from 0 to 100) shows the speculators are currently Bullish with a score of 78.9 percent. The commercials are Bearish with a score of 25.1 percent and the small traders (not shown in chart) are Bearish with a score of 30.2 percent.
Our weekly trend-following model classifies the current market price position as: Uptrend. The current action for the model is considered to be: Hold – Maintain Long Position.
| BRAZIL REAL Statistics | SPECULATORS | COMMERCIALS | SMALL TRADERS |
| – Percent of Open Interest Longs: | 76.3 | 14.1 | 9.2 |
| – Percent of Open Interest Shorts: | 5.8 | 81.0 | 12.8 |
| – Net Position: | 33,933 | -32,196 | -1,737 |
| – Gross Longs: | 36,730 | 6,793 | 4,429 |
| – Gross Shorts: | 2,797 | 38,989 | 6,166 |
| – Long to Short Ratio: | 13.1 to 1 | 0.2 to 1 | 0.7 to 1 |
| NET POSITION TREND: | |||
| – Strength Index Score (3 Year Range Pct): | 78.9 | 25.1 | 30.2 |
| – Strength Index Reading (3 Year Range): | Bullish | Bearish | Bearish |
| NET POSITION MOVEMENT INDEX: | |||
| – 6-Week Change in Strength Index: | 9.9 | -8.0 | -10.2 |
This week’s current strength score (the trader positioning range over the past three years, measured from 0 to 100) shows the speculators are currently Bullish with a score of 56.7 percent. The commercials are Bullish with a score of 63.9 percent and the small traders (not shown in chart) are Bearish with a score of 34.9 percent.
Our weekly trend-following model classifies the current market price position as: Uptrend. The current action for the model is considered to be: Hold – Maintain Long Position.
| BITCOIN Statistics | SPECULATORS | COMMERCIALS | SMALL TRADERS |
| – Percent of Open Interest Longs: | 76.6 | 4.7 | 10.7 |
| – Percent of Open Interest Shorts: | 84.2 | 3.4 | 4.5 |
| – Net Position: | -1,161 | 196 | 965 |
| – Gross Longs: | 11,846 | 722 | 1,657 |
| – Gross Shorts: | 13,007 | 526 | 692 |
| – Long to Short Ratio: | 0.9 to 1 | 1.4 to 1 | 2.4 to 1 |
| NET POSITION TREND: | |||
| – Strength Index Score (3 Year Range Pct): | 56.7 | 63.9 | 34.9 |
| – Strength Index Reading (3 Year Range): | Bullish | Bullish | Bearish |
| NET POSITION MOVEMENT INDEX: | |||
| – 6-Week Change in Strength Index: | -33.7 | 53.6 | 12.2 |
Article By InvestMacro – Receive our weekly COT Newsletter
*COT Report: The COT data, released weekly to the public each Friday, is updated through the most recent Tuesday (data is 3 days old) and shows a quick view of how large speculators or non-commercials (for-profit traders) were positioned in the futures markets.
The CFTC categorizes trader positions according to commercial hedgers (traders who use futures contracts for hedging as part of the business), non-commercials (large traders who speculate to realize trading profits) and nonreportable traders (usually small traders/speculators) as well as their open interest (contracts open in the market at time of reporting). See CFTC criteria here.
By InvestMacro Here are the latest charts and statistics for the Commitment of Traders (COT)…
By InvestMacro Here are the latest charts and statistics for the Commitment of Traders (COT)…
By ForexTime FXTM’s USDInd ↑ 2% MTD Dollar best performing G10 currency MTD Geopolitical risk…
By JustMarkets The US stock market concluded Thursday’s session in the red as the escalating…
By Analytical Department RoboForex EUR/USD is holding near 1.1620 on Friday, with the US dollar…
By JustMarkets The US stock market rose on Wednesday. By the end of the day,…
This website uses cookies.