By RoboForex Analytical Department
The most heavily traded currency pair, EUR/USD, experienced a rebound to 1.0720 following a significant downturn.
The concerns about U.S. public debt subsided after the proposal to increase the debt limit was endorsed first by the House of Representatives, followed by the Senate and the White House. This resolution was widely anticipated and successfully prevented a halt to federal government operations.
U.S. employment statistics for May presented a mixed picture. Non-farm payrolls (NFP) rose more than expected, surging by 339 thousand, which was welcome news. However, the average wage increase was modest, ticking up by a mere 0.3% month on month. This modest wage growth served to limit market dynamics.
Currency markets are now focusing their attention on the upcoming Federal Reserve meeting scheduled for next week. Investors are eager to know the Fed’s stance: Will it pause its interest rate hike, or will the cycle continue? The market consensus on this matter remains divided.
Technical Analysis:
Free Reports:
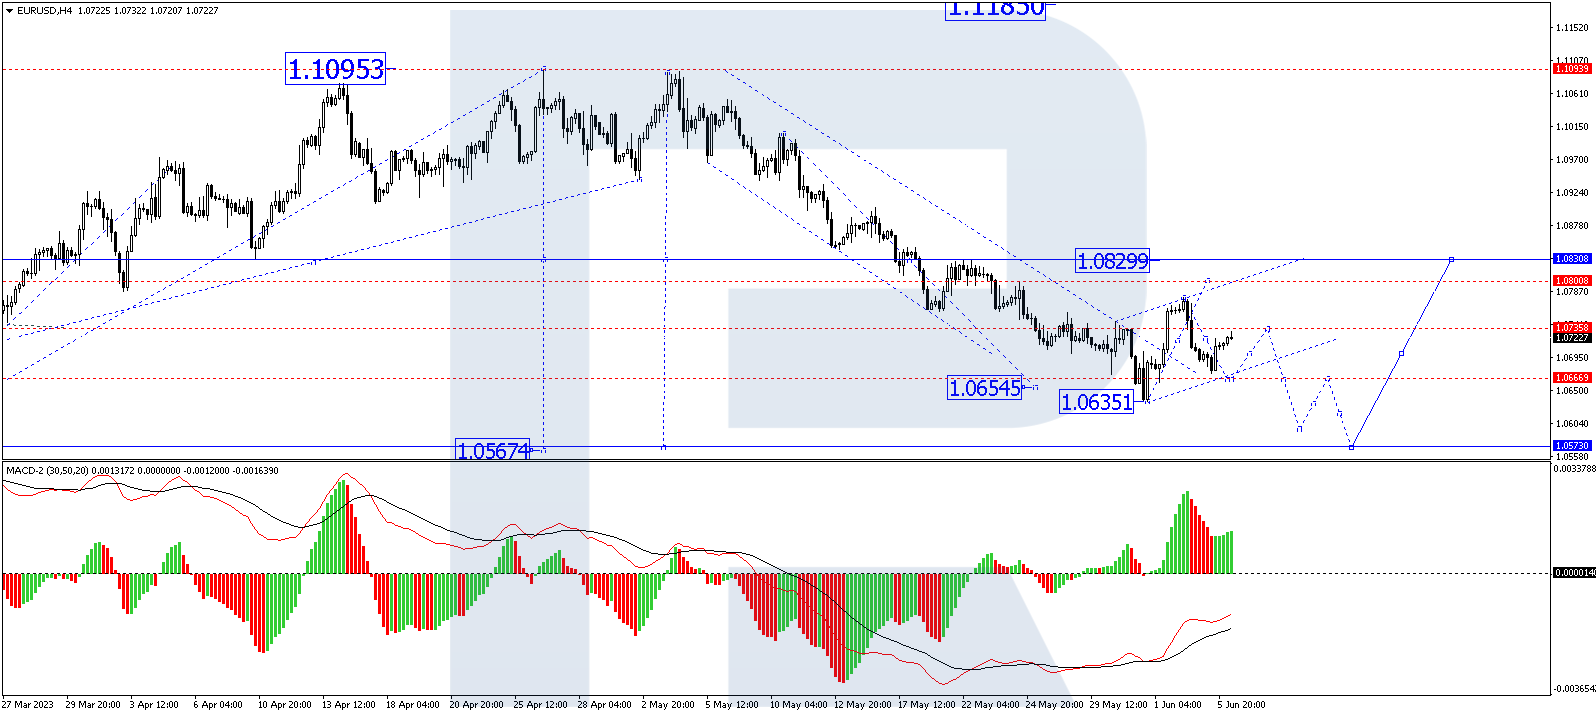
On a 4-hour chart (H4), EUR/USD corrected to 1.0762. The market is currently forming a downward impulse to 1.0666. Once this level is reached, an uptick towards 1.0735 may occur. Essentially, a consolidation range could form above 1.0666. An upward breakout from this range could trigger a correction towards 1.0830. Alternatively, a downward breakout could continue the bearish trend down to 1.0596. This technical scenario is supported by the Moving Average Convergence Divergence (MACD) indicator. Its signal line is below zero and poised for an upward move to test from below, followed by a potential drop to new lows.
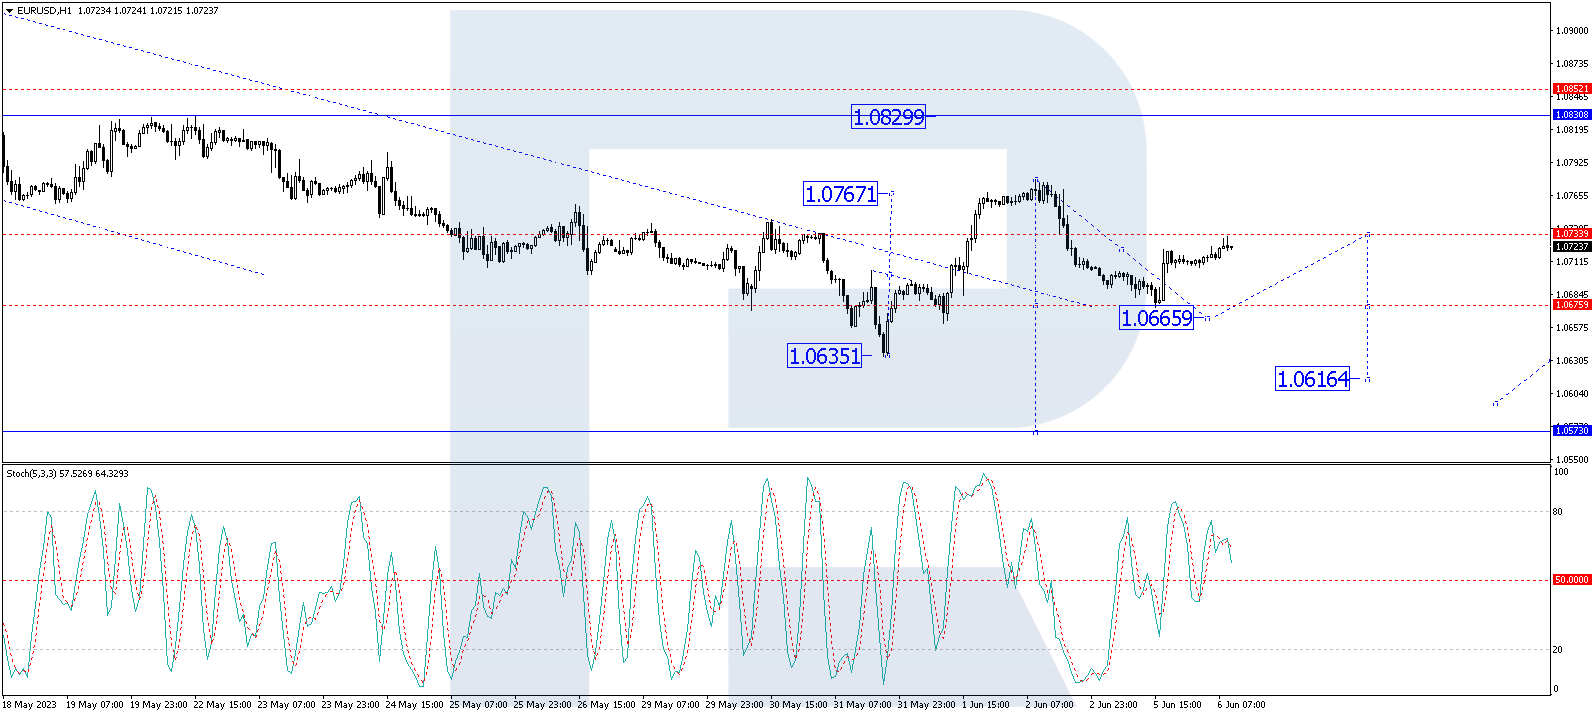
On the 1-hour chart (H1), EUR/USD is forming a downward wave structure towards 1.0666. Upon reaching this level, a corrective move towards 1.0700 may occur, followed by a drop to 1.0616. From this point, the bearish trend could persist down to 1.0573. This technical scenario is validated by the Stochastic oscillator. Its signal line is currently near the 50 level and could break lower, potentially declining to 20.
Disclaimer
Any forecasts contained herein are based on the author’s particular opinion. This analysis may not be treated as trading advice. RoboForex bears no responsibility for trading results based on trading recommendations and reviews contained herein.
By JustMarkets The US stock indices ended Friday’s session in the red. By the end…
By Analytical Department RoboForex USD/JPY opens the week at 162.36 on Monday. The Japanese yen…
By InvestMacro Here are the latest charts and statistics for the Commitment of Traders (COT)…
By InvestMacro The latest update for the weekly Commitment of Traders (COT) report was released…
By InvestMacro Here are the latest charts and statistics for the Commitment of Traders (COT)…
By InvestMacro Here are the latest charts and statistics for the Commitment of Traders (COT)…
This website uses cookies.