By InvestMacro.com | #stocks #TSLA #tesla
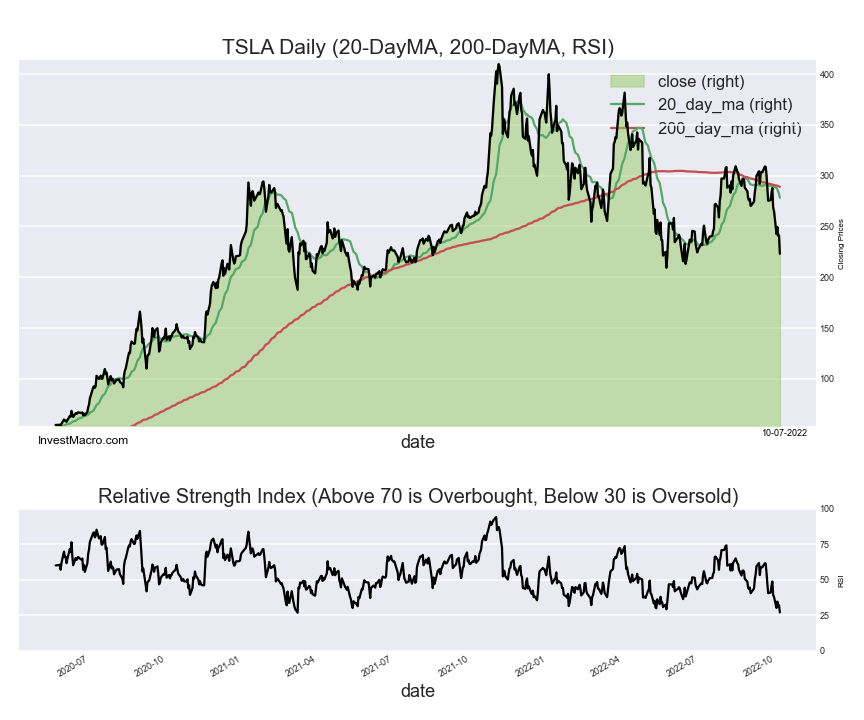
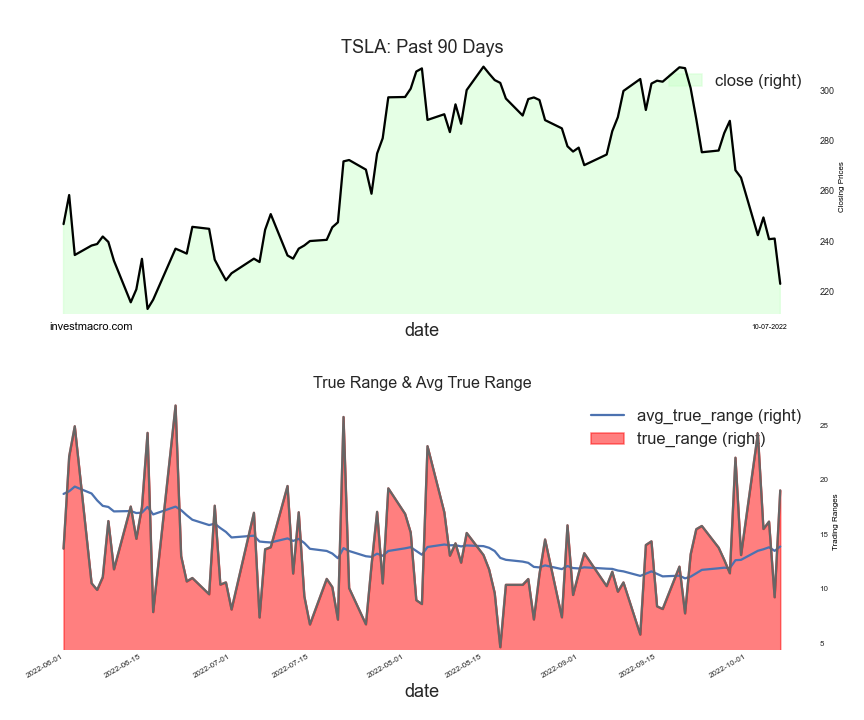
The Tesla, Inc. (TSLA) stock finished the day with a decline of -7.46 percent and closed the day around the 223.07 price level, according to unofficial data at the New York close.
TSLA opened the day trading at 233.93 with the high of the day being 234.57 and the low bottoming for the day at 222.02.
TSLA is below both the 20-day and 200-day moving averages currently after the stock dropped below the $300 price level and both moving averages in late September.
The Relative Strength Index, an indicator that can indicate overbought (above 70) and oversold levels (below 30), shows that the current RSI score is at 27.0 for a Bearish-Oversold reading on the daily time-frame.
The TSLA has declined by -18.98 percent over the past 10 days while seeing a step lower by -24.66 over the past 30 days. The 90-day change is -11.74 while the 180-day return and the 365-day return are -32.83 and -3.63, respectively.
Free Reports:
By investmacro.com
By Analytical Department RoboForex GBP/USD enters the week of 10–14 August near 1.3500 – its…
By JustMarkets On Friday, US stock indices closed higher after labor‑market data came in worse…
By InvestMacro Here are the latest charts and statistics for the Commitment of Traders (COT)…
By InvestMacro The latest update for the weekly Commitment of Traders (COT) report was released…
By InvestMacro Here are the latest charts and statistics for the Commitment of Traders (COT)…
By InvestMacro Here are the latest charts and statistics for the Commitment of Traders (COT)…
This website uses cookies.