By InvestMacro
Here are the latest charts and statistics for the Commitment of Traders (COT) data published by the Commodities Futures Trading Commission (CFTC).
The latest COT data is updated through Tuesday September 20th and shows a quick view of how large traders (for-profit speculators and commercial entities) were positioned in the futures markets.
The COT data this week is from the day before the US Federal Reserve raised the benchmark interest rate 75 basis points to the 3 to 3.25 percent range. This data shows the trader positioning prior to the rate hike and considering the way the stock markets have gone since Wednesday, positions could have been reversed shortly after.
Free Reports:
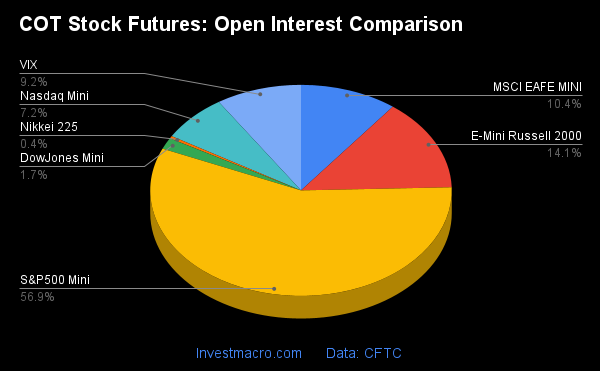
The COT stock market speculator bets were slightly lower through Tuesday as three out of the seven stock markets we cover had higher positioning this week while the other four markets had lower contracts.
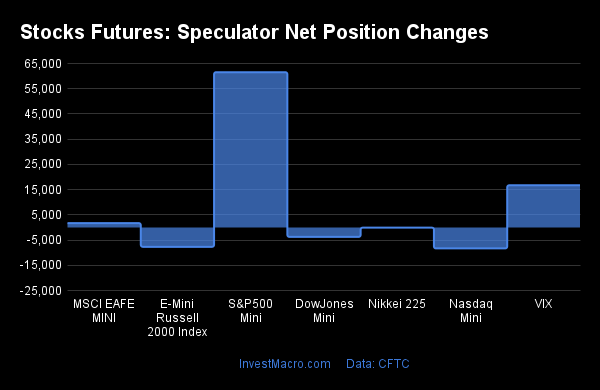
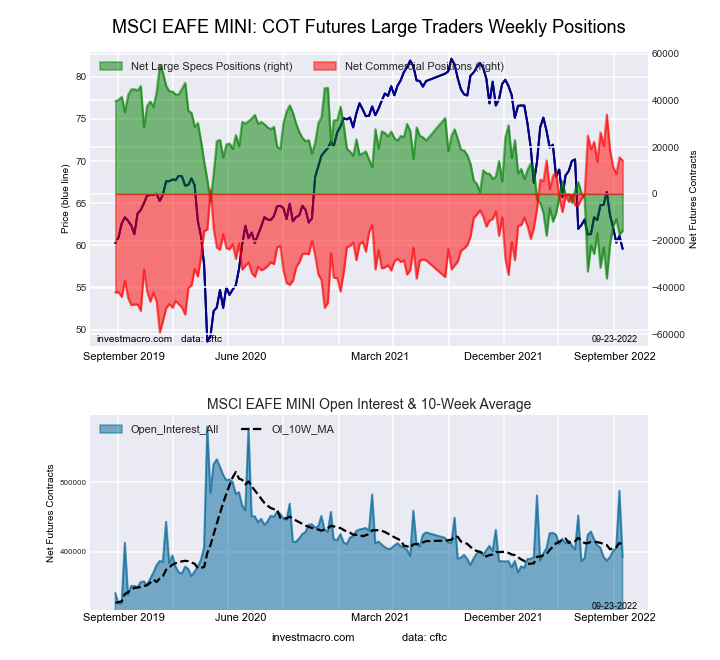
Leading the gains for stock markets was the S&P500 Mini (61,553 contracts) with the VIX (16,728 contracts) and MSCI EAFE Mini (1,723 contracts) also showing positive weeks.
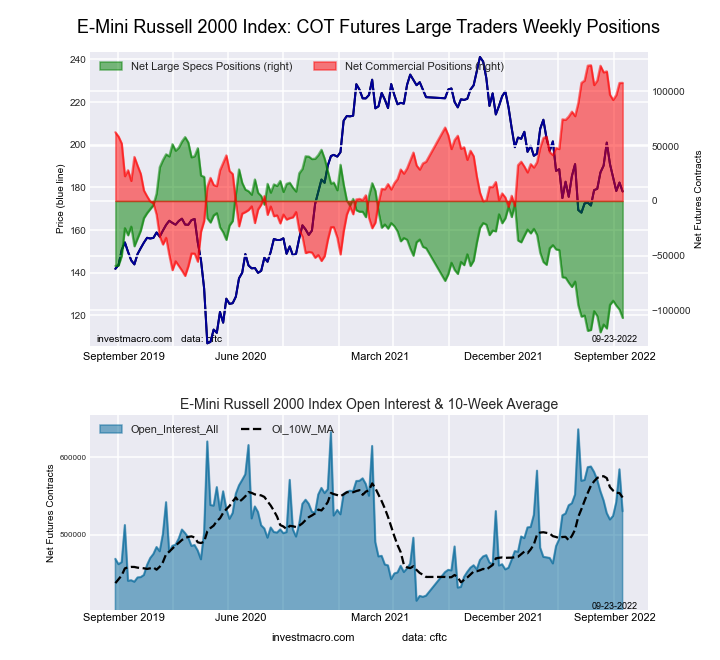
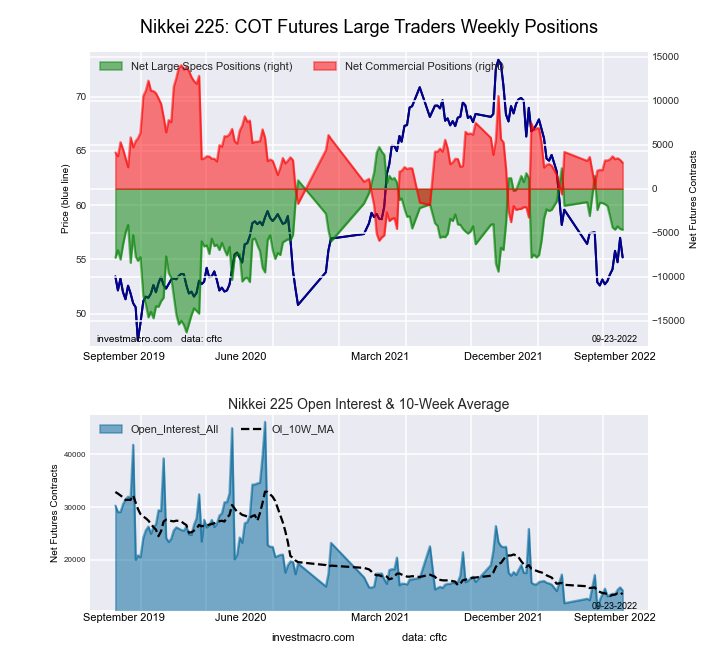
The stock markets with declines in speculator bets this week were the Nasdaq Mini (-8,321 contracts), Russell 2000 Mini (-7,686 contracts), Dow Jones Industrial Average Mini (-3,748 contracts) and the Nikkei 225 USD (-78 contracts) also registering lower bets on the week.
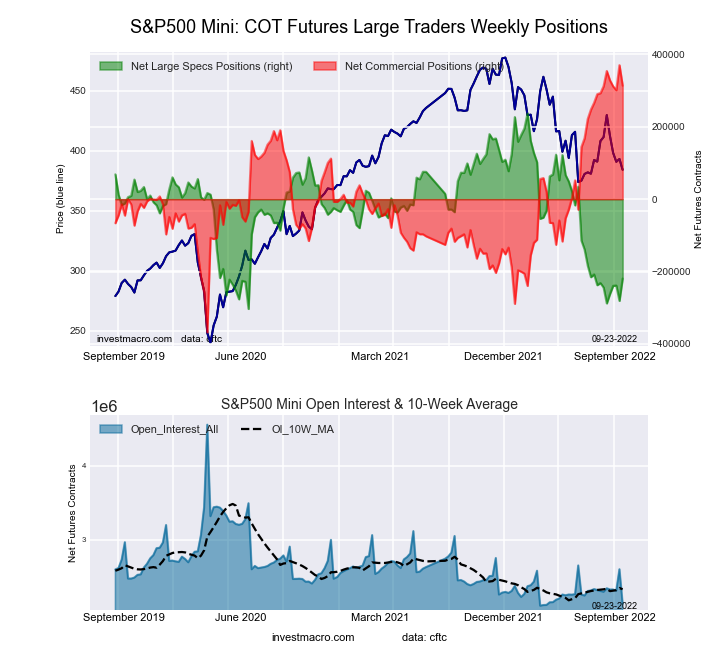
Highlighting the COT stocks data was the SP500 Mini speculator bets that jumped this week by over +60,000 contracts. This was the fourth week in the past five weeks that bets had improved for the SP-Mini. The positioning was likely heavily influenced by the Fed interest rate decision coming the day after (Wednesday) the data was collected. Digging into the data showed that the positive result for the SP500 Mini net positioning was due to a large number of traders reducing their gross short positions (by -75,190 contracts) on Tuesday. Speculators also reduced their gross long positions but by a much smaller number for the week (by -13,637 contracts). Overall, the SP500 Mini net position at -219,451 contracts remains extremely bearish and has been in a negative bearish position for the past fourteen straight weeks, dating back to June 21st.
| Sep-20-2022 | OI | OI-Index | Spec-Net | Spec-Index | Com-Net | COM-Index | Smalls-Net | Smalls-Index |
|---|---|---|---|---|---|---|---|---|
| S&P500-Mini | 2,141,022 | 1 | -219,451 | 16 | 313,698 | 92 | -94,247 | 7 |
| Nikkei 225 | 14,151 | 10 | -4,641 | 55 | 2,949 | 44 | 1,692 | 50 |
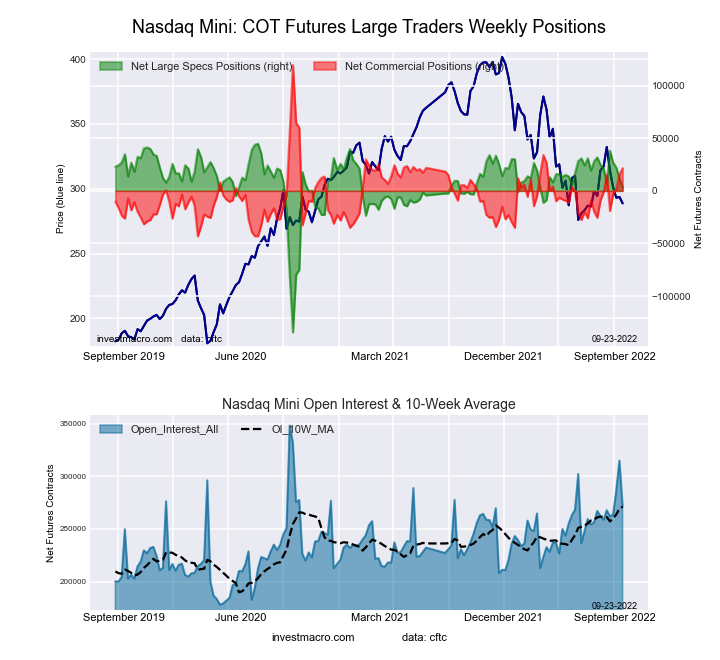
| Nasdaq-Mini | 271,815 | 55 | 3,485 | 77 | 21,582 | 40 | -25,067 | 4 |
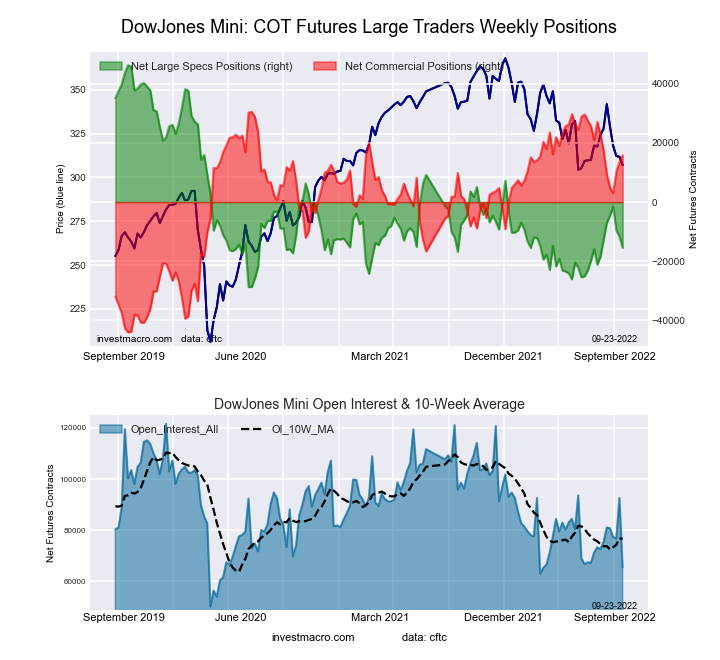
| DowJones-Mini | 65,490 | 21 | -15,434 | 18 | 15,840 | 80 | -406 | 36 |
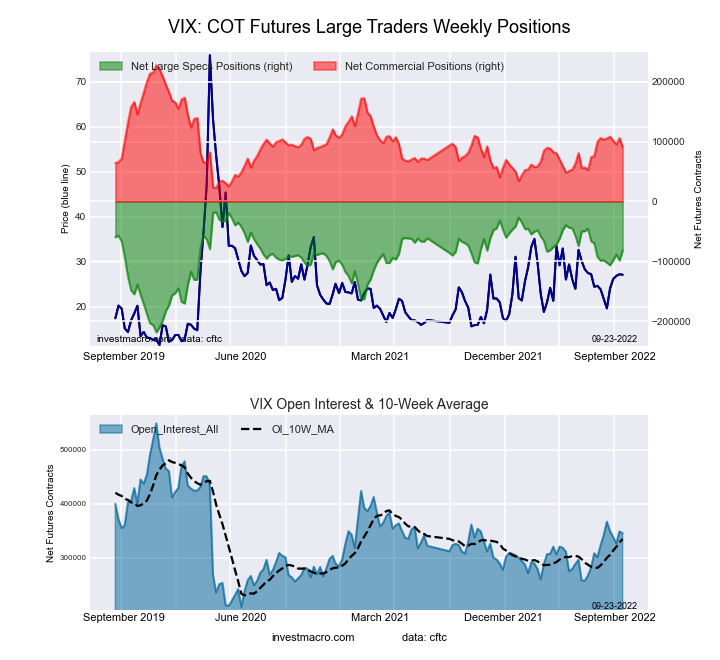
| VIX | 345,341 | 40 | -81,798 | 68 | 90,842 | 33 | -9,044 | 48 |
| Nikkei 225 Yen | 42,355 | 18 | 104 | 34 | 18,611 | 74 | -18,715 | 36 |
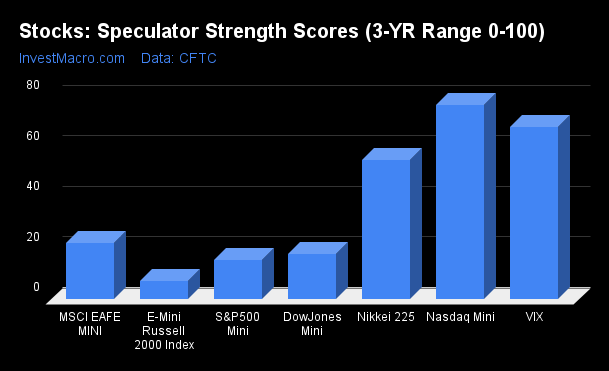
Strength Scores (a normalized measure of Speculator positions over a 3-Year range, from 0 to 100 where above 80 is extreme bullish and below 20 is extreme bearish) showed that the Nasdaq-Mini (77.0 percent) and the VIX (68.3 percent) lead the stock markets for the week. The Nikkei USD (55.4 percent) comes in as the next highest stocks market in strength scores.
On the downside, the Russell2000-Mini (7.4 percent), the S&P500-Mini (15.5 percent) and the DowJones-Mini (17.8 percent) come in at the lowest strength levels and are all in extreme bearish territory (below 20 percent).
Strength Statistics:
VIX (68.3 percent) vs VIX previous week (59.9 percent)
S&P500-Mini (15.5 percent) vs S&P500-Mini previous week (4.1 percent)
DowJones-Mini (17.8 percent) vs DowJones-Mini previous week (22.9 percent)
Nasdaq-Mini (77.0 percent) vs Nasdaq-Mini previous week (81.6 percent)
Russell2000-Mini (7.4 percent) vs Russell2000-Mini previous week (11.7 percent)
Nikkei USD (55.4 percent) vs Nikkei USD previous week (55.8 percent)
EAFE-Mini (22.4 percent) vs EAFE-Mini previous week (20.5 percent)
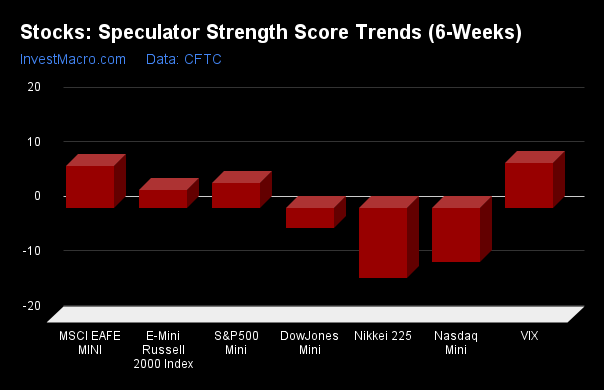
Strength Score Trends (or move index, calculates the 6-week changes in strength scores) showed that the VIX (8.2 percent) and the EAFE-Mini (7.8 percent) lead the past six weeks trends for stocks this week. The S&P500-Mini (4.6 percent) and the Russell2000-Mini (3.4 percent) fill out the other positive movers in the latest trends data.
The Nikkei USD (-12.8 percent) leads the downside trend scores currently while the next market with lower trend scores were the Nasdaq-Mini (-9.8 percent) followed by the DowJones-Mini (-3.6 percent).
Strength Trend Statistics:
VIX (8.2 percent) vs VIX previous week (0.2 percent)
S&P500-Mini (4.6 percent) vs S&P500-Mini previous week (-9.1 percent)
DowJones-Mini (-3.6 percent) vs DowJones-Mini previous week (9.0 percent)
Nasdaq-Mini (-9.8 percent) vs Nasdaq-Mini previous week (-7.2 percent)
Russell2000-Mini (3.4 percent) vs Russell2000-Mini previous week (11.7 percent)
Nikkei USD (-12.8 percent) vs Nikkei USD previous week (-13.4 percent)
EAFE-Mini (7.8 percent) vs EAFE-Mini previous week (15.4 percent)
This week’s current strength score (the trader positioning range over the past three years, measured from 0 to 100) shows the speculators are currently Bullish with a score of 68.3 percent. The commercials are Bearish with a score of 33.3 percent and the small traders (not shown in chart) are Bearish with a score of 47.5 percent.
| VIX Volatility Futures Statistics | SPECULATORS | COMMERCIALS | SMALL TRADERS |
| – Percent of Open Interest Longs: | 13.0 | 56.6 | 6.3 |
| – Percent of Open Interest Shorts: | 36.7 | 30.3 | 8.9 |
| – Net Position: | -81,798 | 90,842 | -9,044 |
| – Gross Longs: | 45,066 | 195,413 | 21,807 |
| – Gross Shorts: | 126,864 | 104,571 | 30,851 |
| – Long to Short Ratio: | 0.4 to 1 | 1.9 to 1 | 0.7 to 1 |
| NET POSITION TREND: | |||
| – Strength Index Score (3 Year Range Pct): | 68.3 | 33.3 | 47.5 |
| – Strength Index Reading (3 Year Range): | Bullish | Bearish | Bearish |
| NET POSITION MOVEMENT INDEX: | |||
| – 6-Week Change in Strength Index: | 8.2 | -6.0 | -20.0 |
This week’s current strength score (the trader positioning range over the past three years, measured from 0 to 100) shows the speculators are currently Bearish-Extreme with a score of 15.5 percent. The commercials are Bullish-Extreme with a score of 92.3 percent and the small traders (not shown in chart) are Bearish-Extreme with a score of 6.6 percent.
| S&P500 Mini Futures Statistics | SPECULATORS | COMMERCIALS | SMALL TRADERS |
| – Percent of Open Interest Longs: | 10.3 | 78.6 | 8.6 |
| – Percent of Open Interest Shorts: | 20.6 | 63.9 | 13.0 |
| – Net Position: | -219,451 | 313,698 | -94,247 |
| – Gross Longs: | 221,158 | 1,681,942 | 184,903 |
| – Gross Shorts: | 440,609 | 1,368,244 | 279,150 |
| – Long to Short Ratio: | 0.5 to 1 | 1.2 to 1 | 0.7 to 1 |
| NET POSITION TREND: | |||
| – Strength Index Score (3 Year Range Pct): | 15.5 | 92.3 | 6.6 |
| – Strength Index Reading (3 Year Range): | Bearish-Extreme | Bullish-Extreme | Bearish-Extreme |
| NET POSITION MOVEMENT INDEX: | |||
| – 6-Week Change in Strength Index: | 4.6 | 0.2 | -5.5 |
This week’s current strength score (the trader positioning range over the past three years, measured from 0 to 100) shows the speculators are currently Bearish-Extreme with a score of 17.8 percent. The commercials are Bullish-Extreme with a score of 80.2 percent and the small traders (not shown in chart) are Bearish with a score of 36.3 percent.
| Dow Jones Mini Futures Statistics | SPECULATORS | COMMERCIALS | SMALL TRADERS |
| – Percent of Open Interest Longs: | 23.4 | 58.4 | 17.8 |
| – Percent of Open Interest Shorts: | 47.0 | 34.2 | 18.5 |
| – Net Position: | -15,434 | 15,840 | -406 |
| – Gross Longs: | 15,316 | 38,240 | 11,687 |
| – Gross Shorts: | 30,750 | 22,400 | 12,093 |
| – Long to Short Ratio: | 0.5 to 1 | 1.7 to 1 | 1.0 to 1 |
| NET POSITION TREND: | |||
| – Strength Index Score (3 Year Range Pct): | 17.8 | 80.2 | 36.3 |
| – Strength Index Reading (3 Year Range): | Bearish-Extreme | Bullish-Extreme | Bearish |
| NET POSITION MOVEMENT INDEX: | |||
| – 6-Week Change in Strength Index: | -3.6 | -1.8 | 21.7 |
This week’s current strength score (the trader positioning range over the past three years, measured from 0 to 100) shows the speculators are currently Bullish with a score of 77.0 percent. The commercials are Bearish with a score of 39.8 percent and the small traders (not shown in chart) are Bearish-Extreme with a score of 4.4 percent.
| Nasdaq Mini Futures Statistics | SPECULATORS | COMMERCIALS | SMALL TRADERS |
| – Percent of Open Interest Longs: | 27.1 | 60.9 | 10.5 |
| – Percent of Open Interest Shorts: | 25.8 | 53.0 | 19.7 |
| – Net Position: | 3,485 | 21,582 | -25,067 |
| – Gross Longs: | 73,741 | 165,619 | 28,531 |
| – Gross Shorts: | 70,256 | 144,037 | 53,598 |
| – Long to Short Ratio: | 1.0 to 1 | 1.1 to 1 | 0.5 to 1 |
| NET POSITION TREND: | |||
| – Strength Index Score (3 Year Range Pct): | 77.0 | 39.8 | 4.4 |
| – Strength Index Reading (3 Year Range): | Bullish | Bearish | Bearish-Extreme |
| NET POSITION MOVEMENT INDEX: | |||
| – 6-Week Change in Strength Index: | -9.8 | 14.0 | -9.9 |
This week’s current strength score (the trader positioning range over the past three years, measured from 0 to 100) shows the speculators are currently Bearish-Extreme with a score of 7.4 percent. The commercials are Bullish-Extreme with a score of 91.6 percent and the small traders (not shown in chart) are Bearish with a score of 24.2 percent.
| Russell 2000 Mini Futures Statistics | SPECULATORS | COMMERCIALS | SMALL TRADERS |
| – Percent of Open Interest Longs: | 6.1 | 88.7 | 4.1 |
| – Percent of Open Interest Shorts: | 26.3 | 68.3 | 4.3 |
| – Net Position: | -106,838 | 107,880 | -1,042 |
| – Gross Longs: | 32,486 | 470,319 | 21,997 |
| – Gross Shorts: | 139,324 | 362,439 | 23,039 |
| – Long to Short Ratio: | 0.2 to 1 | 1.3 to 1 | 1.0 to 1 |
| NET POSITION TREND: | |||
| – Strength Index Score (3 Year Range Pct): | 7.4 | 91.6 | 24.2 |
| – Strength Index Reading (3 Year Range): | Bearish-Extreme | Bullish-Extreme | Bearish |
| NET POSITION MOVEMENT INDEX: | |||
| – 6-Week Change in Strength Index: | 3.4 | -5.0 | 10.9 |
This week’s current strength score (the trader positioning range over the past three years, measured from 0 to 100) shows the speculators are currently Bullish with a score of 55.4 percent. The commercials are Bearish with a score of 44.4 percent and the small traders (not shown in chart) are Bearish with a score of 49.6 percent.
| Nikkei Stock Average Futures Statistics | SPECULATORS | COMMERCIALS | SMALL TRADERS |
| – Percent of Open Interest Longs: | 12.2 | 53.3 | 34.2 |
| – Percent of Open Interest Shorts: | 45.0 | 32.5 | 22.3 |
| – Net Position: | -4,641 | 2,949 | 1,692 |
| – Gross Longs: | 1,729 | 7,548 | 4,844 |
| – Gross Shorts: | 6,370 | 4,599 | 3,152 |
| – Long to Short Ratio: | 0.3 to 1 | 1.6 to 1 | 1.5 to 1 |
| NET POSITION TREND: | |||
| – Strength Index Score (3 Year Range Pct): | 55.4 | 44.4 | 49.6 |
| – Strength Index Reading (3 Year Range): | Bullish | Bearish | Bearish |
| NET POSITION MOVEMENT INDEX: | |||
| – 6-Week Change in Strength Index: | -12.8 | -1.3 | 37.0 |
This week’s current strength score (the trader positioning range over the past three years, measured from 0 to 100) shows the speculators are currently Bearish with a score of 22.4 percent. The commercials are Bullish with a score of 78.9 percent and the small traders (not shown in chart) are Bearish with a score of 31.5 percent.
| MSCI EAFE Mini Futures Statistics | SPECULATORS | COMMERCIALS | SMALL TRADERS |
| – Percent of Open Interest Longs: | 5.3 | 92.1 | 2.0 |
| – Percent of Open Interest Shorts: | 9.3 | 88.5 | 1.7 |
| – Net Position: | -15,709 | 14,260 | 1,449 |
| – Gross Longs: | 20,659 | 360,939 | 8,009 |
| – Gross Shorts: | 36,368 | 346,679 | 6,560 |
| – Long to Short Ratio: | 0.6 to 1 | 1.0 to 1 | 1.2 to 1 |
| NET POSITION TREND: | |||
| – Strength Index Score (3 Year Range Pct): | 22.4 | 78.9 | 31.5 |
| – Strength Index Reading (3 Year Range): | Bearish | Bullish | Bearish |
| NET POSITION MOVEMENT INDEX: | |||
| – 6-Week Change in Strength Index: | 7.8 | -6.7 | -7.9 |
Article By InvestMacro – Receive our weekly COT Newsletter
*COT Report: The COT data, released weekly to the public each Friday, is updated through the most recent Tuesday (data is 3 days old) and shows a quick view of how large speculators or non-commercials (for-profit traders) were positioned in the futures markets.
The CFTC categorizes trader positions according to commercial hedgers (traders who use futures contracts for hedging as part of the business), non-commercials (large traders who speculate to realize trading profits) and nonreportable traders (usually small traders/speculators) as well as their open interest (contracts open in the market at time of reporting). See CFTC criteria here.
By JustMarkets The US stock indices ended Friday’s session in the red. By the end…
By Analytical Department RoboForex USD/JPY opens the week at 162.36 on Monday. The Japanese yen…
By InvestMacro Here are the latest charts and statistics for the Commitment of Traders (COT)…
By InvestMacro The latest update for the weekly Commitment of Traders (COT) report was released…
By InvestMacro Here are the latest charts and statistics for the Commitment of Traders (COT)…
By InvestMacro Here are the latest charts and statistics for the Commitment of Traders (COT)…
This website uses cookies.