By InvestMacro | COT | Data Tables | COT Leaders | Downloads | COT Newsletter
Here are the latest charts and statistics for the Commitment of Traders (COT) data published by the Commodities Futures Trading Commission (CFTC).
The latest COT data is updated through Tuesday August 9nd and shows a quick view of how large traders (for-profit speculators and commercial entities) were positioned in the futures markets.
COT energy market speculator bets were lower this week as just one out of the six energy markets we cover had higher positioning this week while the other five markets had lower contracts.
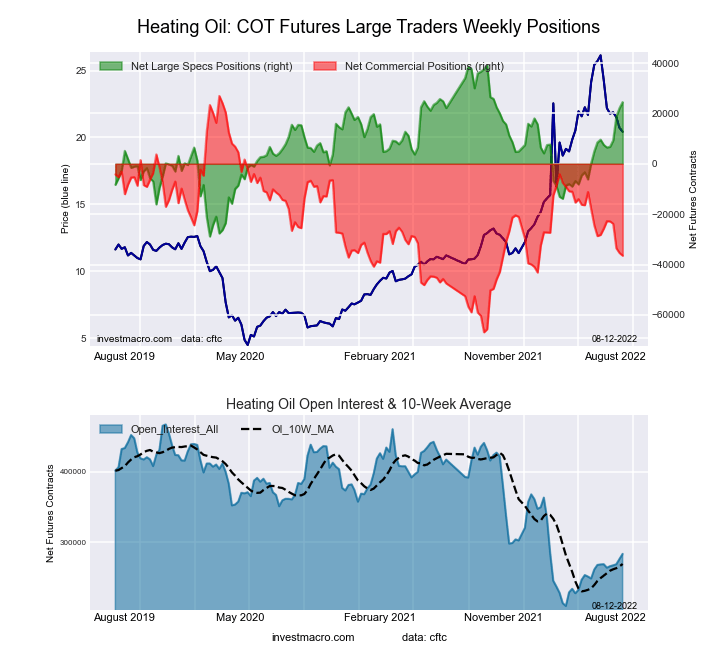
Leading the gains for energy markets was Heating Oil (2,396 contracts) which was the only market this week showing increasing speculator bets.
Free Reports:
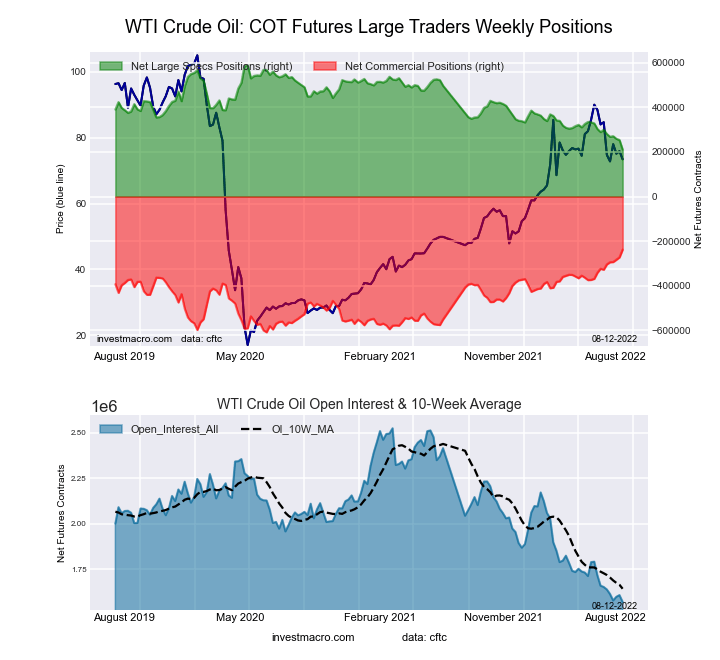
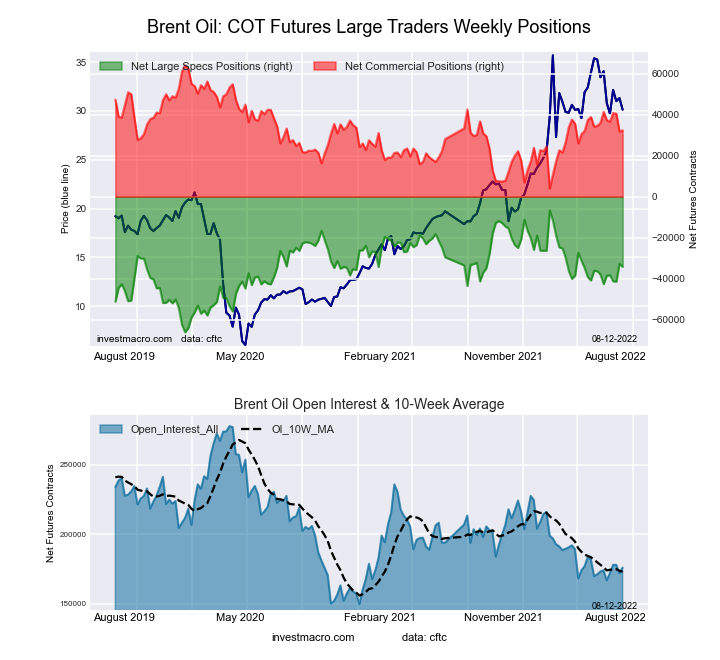
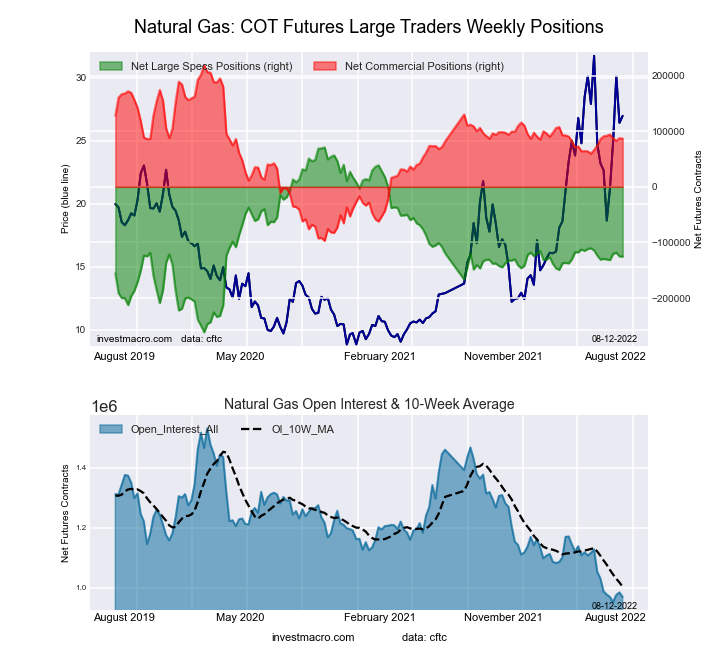
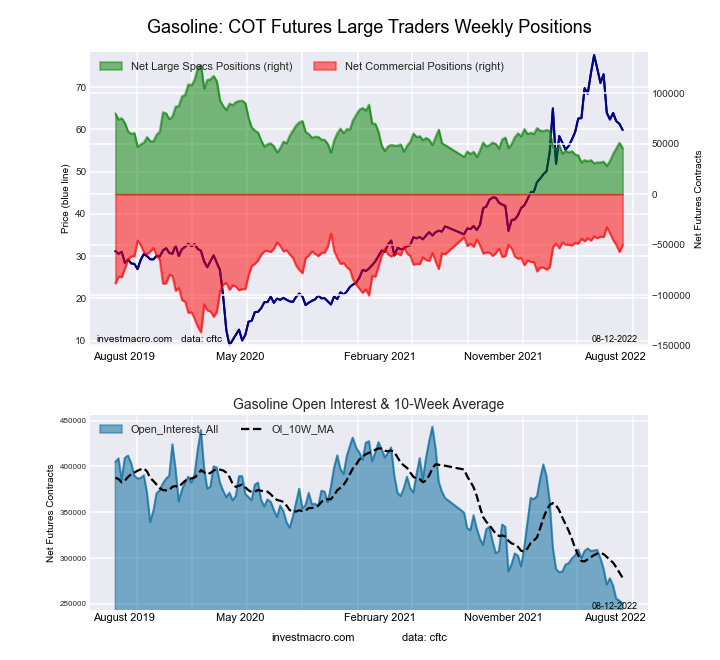
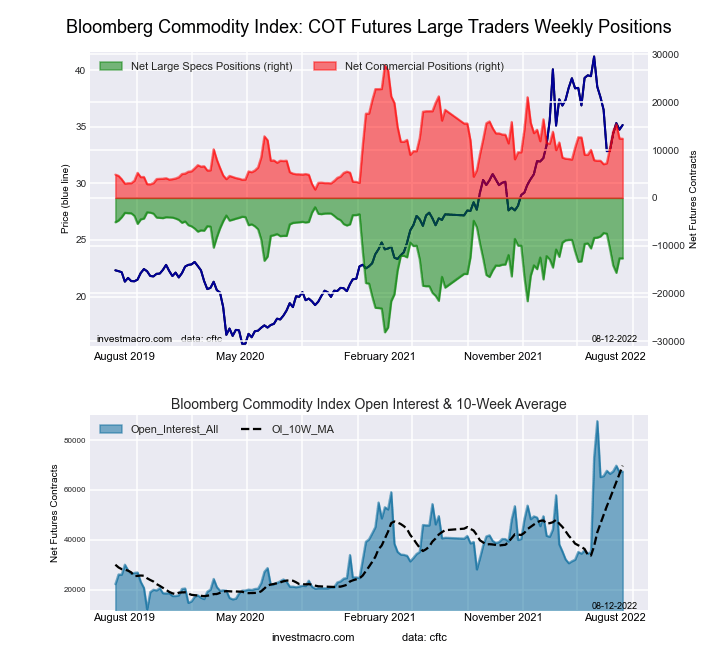
The energy markets leading the declines in speculator bets this week were WTI Crude Oil (-43,101 contracts) and Gasoline (-5,312 contracts) with Brent Crude Oil (-1,429 contracts), Natural Gas (-446 contracts) and the Bloomberg Commodity Index (-33 contracts) also registering lower bets on the week.
| Aug-09-2022 | OI | OI-Index | Spec-Net | Spec-Index | Com-Net | COM-Index | Smalls-Net | Smalls-Index |
|---|---|---|---|---|---|---|---|---|
| WTI Crude | 1,570,131 | 0 | 210,651 | 0 | -238,073 | 100 | 27,422 | 53 |
| Gold | 453,540 | 0 | 142,851 | 19 | -154,554 | 83 | 11,703 | 1 |
| Silver | 141,093 | 8 | 2,879 | 9 | -13,574 | 89 | 10,695 | 21 |
| Copper | 187,988 | 21 | -28,477 | 22 | 27,700 | 78 | 777 | 30 |
| Palladium | 7,619 | 6 | -1,970 | 12 | 2,044 | 86 | -74 | 40 |
| Platinum | 62,782 | 26 | 846 | 9 | -4,055 | 93 | 3,209 | 7 |
| Natural Gas | 969,582 | 3 | -125,419 | 41 | 86,734 | 58 | 38,685 | 72 |
| Brent | 175,896 | 21 | -34,211 | 54 | 32,411 | 47 | 1,800 | 34 |
| Heating Oil | 283,749 | 29 | 24,464 | 78 | -36,472 | 32 | 12,008 | 40 |
| Soybeans | 583,208 | 2 | 88,901 | 41 | -62,971 | 65 | -25,930 | 27 |
| Corn | 1,317,913 | 1 | 210,786 | 57 | -160,654 | 49 | -50,132 | 14 |
| Coffee | 209,446 | 13 | 30,453 | 65 | -31,268 | 41 | 815 | 7 |
| Sugar | 765,669 | 12 | 26,065 | 42 | -30,608 | 62 | 4,543 | 13 |
| Wheat | 320,767 | 14 | -3,426 | 15 | 9,939 | 74 | -6,513 | 77 |
Strength Scores (a normalized measure of Speculator positions over a 3-Year range, from 0 to 100 where above 80 is extreme bullish and below 20 is extreme bearish) showed that Heating Oil (78.4 percent) remains the leader in energy market strength scores. The Bloomberg Commodity Index (59.1 percent) and Brent Crude Oil (53.8 percent) come in as the next highest energy markets in strength scores and both are above 50 percent or the midpoint of their 3-year ranges. On the downside, WTI Crude Oil (0.0 percent) comes in at the lowest strength level currently and is at the bottom of its 3-year range. Joining WTI in a bearish extreme position (below 20 percent) is Gasoline at a 17.5 percent score.
Strength Statistics:
WTI Crude Oil (0.0 percent) vs WTI Crude Oil previous week (11.4 percent)
Brent Crude Oil (53.8 percent) vs Brent Crude Oil previous week (56.2 percent)
Natural Gas (40.9 percent) vs Natural Gas previous week (41.1 percent)
Gasoline (17.5 percent) vs Gasoline previous week (22.9 percent)
Heating Oil (78.4 percent) vs Heating Oil previous week (74.9 percent)
Bloomberg Commodity Index (59.1 percent) vs Bloomberg Commodity Index previous week (59.2 percent)
Strength Score Trends (or move index, calculates the 6-week changes in strength scores) show that Heating Oil (24.9 percent) leads the past six weeks trends for energy this week. Brent Crude Oil (14.2 percent) and Gasoline (13.4 percent) fill out the next top movers in the latest trends data. WTI Crude Oil (-23.5 percent) leads the downside trend scores currently while the next market with lower trend scores is the Bloomberg Commodity Index (-20.3 percent).
Strength Trend Statistics:
WTI Crude Oil (-23.5 percent) vs WTI Crude Oil previous week (-9.4 percent)
Brent Crude Oil (14.2 percent) vs Brent Crude Oil previous week (8.8 percent)
Natural Gas (1.2 percent) vs Natural Gas previous week (1.8 percent)
Gasoline (13.4 percent) vs Gasoline previous week (19.5 percent)
Heating Oil (24.9 percent) vs Heating Oil previous week (18.4 percent)
Bloomberg Commodity Index (-20.3 percent) vs Bloomberg Commodity Index previous week (-17.5 percent)
This week’s current strength score (the trader positioning range over the past three years, measured from 0 to 100) shows the speculators are currently Bearish-Extreme with a score of 0.0 percent. The commercials are Bullish-Extreme with a score of 100.0 percent and the small traders (not shown in chart) are Bullish with a score of 52.7 percent.
| WTI Crude Oil Futures Statistics | SPECULATORS | COMMERCIALS | SMALL TRADERS |
| – Percent of Open Interest Longs: | 21.5 | 40.6 | 4.9 |
| – Percent of Open Interest Shorts: | 8.1 | 55.7 | 3.2 |
| – Net Position: | 210,651 | -238,073 | 27,422 |
| – Gross Longs: | 338,172 | 636,980 | 76,995 |
| – Gross Shorts: | 127,521 | 875,053 | 49,573 |
| – Long to Short Ratio: | 2.7 to 1 | 0.7 to 1 | 1.6 to 1 |
| NET POSITION TREND: | |||
| – Strength Index Score (3 Year Range Pct): | 0.0 | 100.0 | 52.7 |
| – Strength Index Reading (3 Year Range): | Bearish-Extreme | Bullish-Extreme | Bullish |
| NET POSITION MOVEMENT INDEX: | |||
| – 6-Week Change in Strength Index: | -23.5 | 24.3 | -1.2 |
This week’s current strength score (the trader positioning range over the past three years, measured from 0 to 100) shows the speculators are currently Bullish with a score of 53.8 percent. The commercials are Bearish with a score of 47.2 percent and the small traders (not shown in chart) are Bearish with a score of 33.6 percent.
| Brent Crude Oil Futures Statistics | SPECULATORS | COMMERCIALS | SMALL TRADERS |
| – Percent of Open Interest Longs: | 18.0 | 49.9 | 3.9 |
| – Percent of Open Interest Shorts: | 37.4 | 31.5 | 2.9 |
| – Net Position: | -34,211 | 32,411 | 1,800 |
| – Gross Longs: | 31,578 | 87,846 | 6,819 |
| – Gross Shorts: | 65,789 | 55,435 | 5,019 |
| – Long to Short Ratio: | 0.5 to 1 | 1.6 to 1 | 1.4 to 1 |
| NET POSITION TREND: | |||
| – Strength Index Score (3 Year Range Pct): | 53.8 | 47.2 | 33.6 |
| – Strength Index Reading (3 Year Range): | Bullish | Bearish | Bearish |
| NET POSITION MOVEMENT INDEX: | |||
| – 6-Week Change in Strength Index: | 14.2 | -15.0 | 7.5 |
This week’s current strength score (the trader positioning range over the past three years, measured from 0 to 100) shows the speculators are currently Bearish with a score of 40.9 percent. The commercials are Bullish with a score of 58.2 percent and the small traders (not shown in chart) are Bullish with a score of 71.7 percent.
| Natural Gas Futures Statistics | SPECULATORS | COMMERCIALS | SMALL TRADERS |
| – Percent of Open Interest Longs: | 17.5 | 41.7 | 7.0 |
| – Percent of Open Interest Shorts: | 30.5 | 32.7 | 3.0 |
| – Net Position: | -125,419 | 86,734 | 38,685 |
| – Gross Longs: | 169,972 | 404,077 | 67,512 |
| – Gross Shorts: | 295,391 | 317,343 | 28,827 |
| – Long to Short Ratio: | 0.6 to 1 | 1.3 to 1 | 2.3 to 1 |
| NET POSITION TREND: | |||
| – Strength Index Score (3 Year Range Pct): | 40.9 | 58.2 | 71.7 |
| – Strength Index Reading (3 Year Range): | Bearish | Bullish | Bullish |
| NET POSITION MOVEMENT INDEX: | |||
| – 6-Week Change in Strength Index: | 1.2 | -1.3 | 0.2 |
This week’s current strength score (the trader positioning range over the past three years, measured from 0 to 100) shows the speculators are currently Bearish-Extreme with a score of 17.5 percent. The commercials are Bullish-Extreme with a score of 83.1 percent and the small traders (not shown in chart) are Bearish with a score of 44.4 percent.
| Nasdaq Mini Futures Statistics | SPECULATORS | COMMERCIALS | SMALL TRADERS |
| – Percent of Open Interest Longs: | 29.8 | 48.8 | 7.6 |
| – Percent of Open Interest Shorts: | 11.6 | 68.8 | 5.7 |
| – Net Position: | 45,506 | -50,254 | 4,748 |
| – Gross Longs: | 74,516 | 122,093 | 18,926 |
| – Gross Shorts: | 29,010 | 172,347 | 14,178 |
| – Long to Short Ratio: | 2.6 to 1 | 0.7 to 1 | 1.3 to 1 |
| NET POSITION TREND: | |||
| – Strength Index Score (3 Year Range Pct): | 17.5 | 83.1 | 44.4 |
| – Strength Index Reading (3 Year Range): | Bearish-Extreme | Bullish-Extreme | Bearish |
| NET POSITION MOVEMENT INDEX: | |||
| – 6-Week Change in Strength Index: | 13.4 | -7.5 | -37.3 |
This week’s current strength score (the trader positioning range over the past three years, measured from 0 to 100) shows the speculators are currently Bullish with a score of 78.4 percent. The commercials are Bearish with a score of 32.4 percent and the small traders (not shown in chart) are Bearish with a score of 39.9 percent.
| Heating Oil Futures Statistics | SPECULATORS | COMMERCIALS | SMALL TRADERS |
| – Percent of Open Interest Longs: | 16.1 | 52.6 | 14.4 |
| – Percent of Open Interest Shorts: | 7.5 | 65.5 | 10.2 |
| – Net Position: | 24,464 | -36,472 | 12,008 |
| – Gross Longs: | 45,620 | 149,372 | 40,817 |
| – Gross Shorts: | 21,156 | 185,844 | 28,809 |
| – Long to Short Ratio: | 2.2 to 1 | 0.8 to 1 | 1.4 to 1 |
| NET POSITION TREND: | |||
| – Strength Index Score (3 Year Range Pct): | 78.4 | 32.4 | 39.9 |
| – Strength Index Reading (3 Year Range): | Bullish | Bearish | Bearish |
| NET POSITION MOVEMENT INDEX: | |||
| – 6-Week Change in Strength Index: | 24.9 | -11.4 | -21.6 |
This week’s current strength score (the trader positioning range over the past three years, measured from 0 to 100) shows the speculators are currently Bullish with a score of 59.1 percent. The commercials are Bearish with a score of 40.9 percent and the small traders (not shown in chart) are Bearish with a score of 20.5 percent.
| Bloomberg Index Futures Statistics | SPECULATORS | COMMERCIALS | SMALL TRADERS |
| – Percent of Open Interest Longs: | 23.9 | 74.0 | 0.6 |
| – Percent of Open Interest Shorts: | 42.7 | 55.7 | 0.2 |
| – Net Position: | -12,656 | 12,375 | 281 |
| – Gross Longs: | 16,115 | 49,878 | 386 |
| – Gross Shorts: | 28,771 | 37,503 | 105 |
| – Long to Short Ratio: | 0.6 to 1 | 1.3 to 1 | 3.7 to 1 |
| NET POSITION TREND: | |||
| – Strength Index Score (3 Year Range Pct): | 59.1 | 40.9 | 20.5 |
| – Strength Index Reading (3 Year Range): | Bullish | Bearish | Bearish |
| NET POSITION MOVEMENT INDEX: | |||
| – 6-Week Change in Strength Index: | -20.3 | 20.5 | -1.1 |
Article By InvestMacro – Receive our weekly COT Reports by Email
*COT Report: The COT data, released weekly to the public each Friday, is updated through the most recent Tuesday (data is 3 days old) and shows a quick view of how large speculators or non-commercials (for-profit traders) were positioned in the futures markets.
The CFTC categorizes trader positions according to commercial hedgers (traders who use futures contracts for hedging as part of the business), non-commercials (large traders who speculate to realize trading profits) and nonreportable traders (usually small traders/speculators) as well as their open interest (contracts open in the market at time of reporting).See CFTC criteria here.
By JustMarkets The US stock indices ended Friday’s session in the red. By the end…
By Analytical Department RoboForex USD/JPY opens the week at 162.36 on Monday. The Japanese yen…
By InvestMacro Here are the latest charts and statistics for the Commitment of Traders (COT)…
By InvestMacro The latest update for the weekly Commitment of Traders (COT) report was released…
By InvestMacro Here are the latest charts and statistics for the Commitment of Traders (COT)…
By InvestMacro Here are the latest charts and statistics for the Commitment of Traders (COT)…
This website uses cookies.