By InvestMacro | COT | Data Tables | COT Leaders | Downloads | COT Newsletter
Here are the latest charts and statistics for the Commitment of Traders (COT) data published by the Commodities Futures Trading Commission (CFTC).
The latest COT data is updated through Tuesday March 8th and shows a quick view of how large traders (for-profit speculators and commercial entities) were positioned in the futures markets.
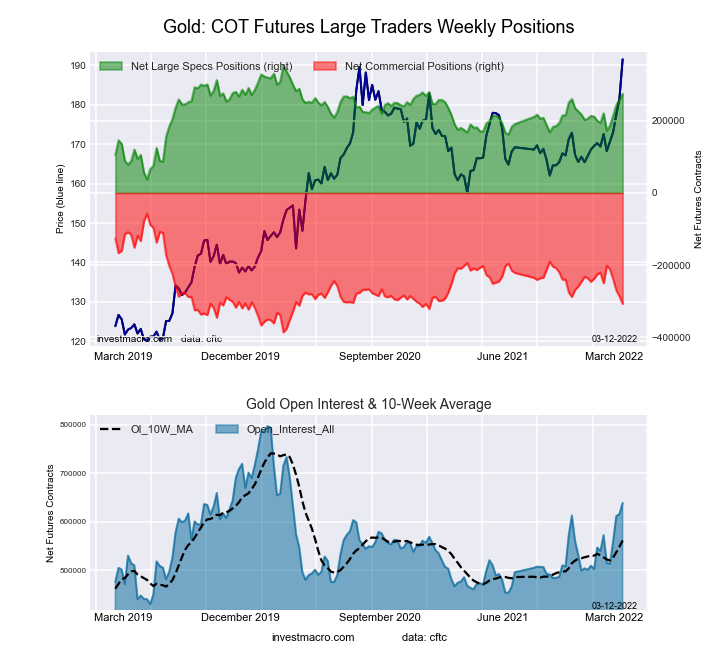
Highlighting the COT metals data is the continued gains in the Gold futures bets. The speculative net position in the Gold futures has risen for five consecutive weeks and in six out of the past seven weeks. Gold bets have now increased by a total of +102,246 contracts over just these past five weeks as bullish sentiment has increased due to inflation and the war in Ukraine. The current speculator position has now ascended to the most bullish level (+274,388) in the past sixty-one weeks, dating back to October 15th of 2021 when bullish bets totaled +279,318 contracts.
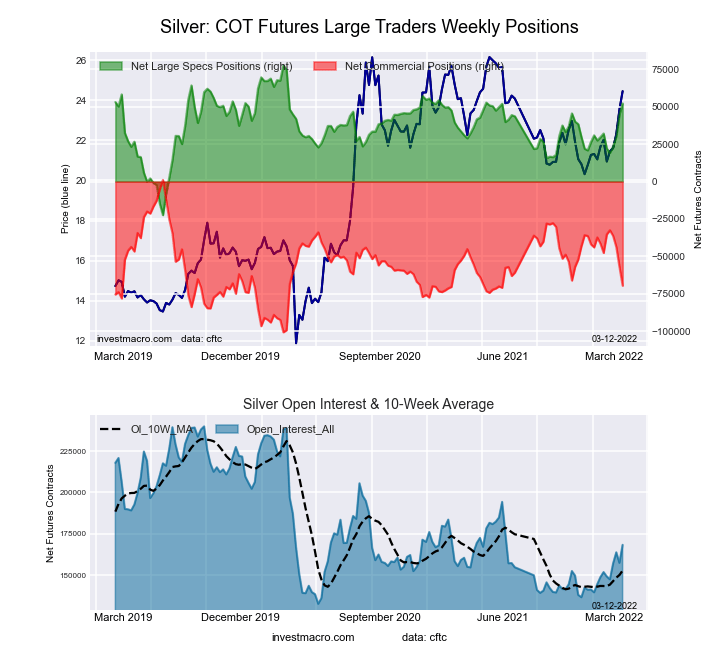
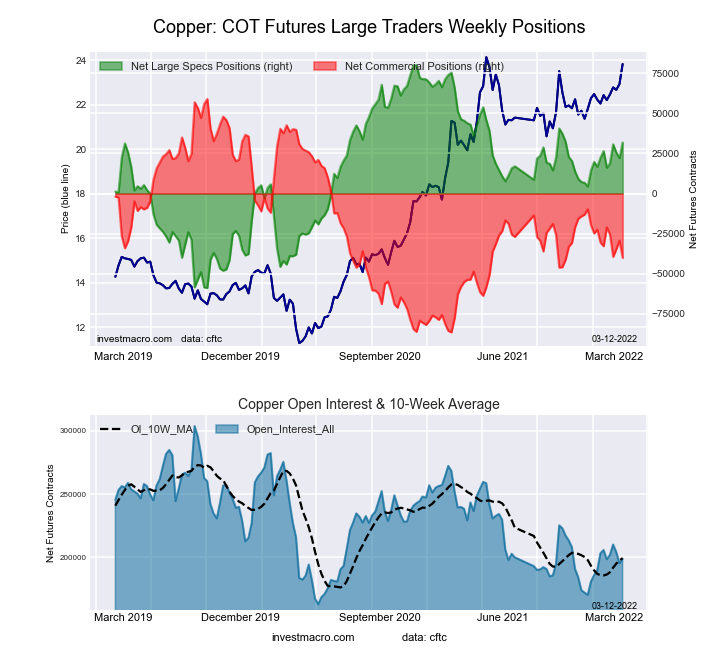
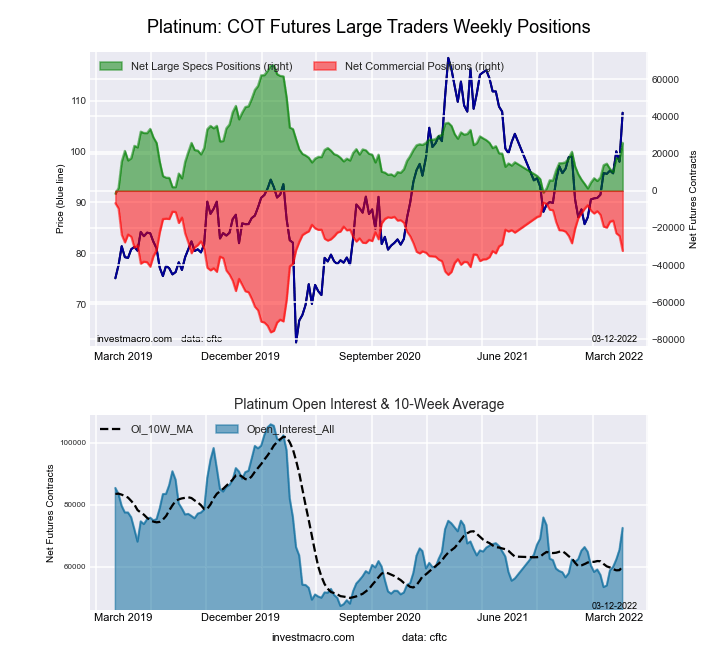
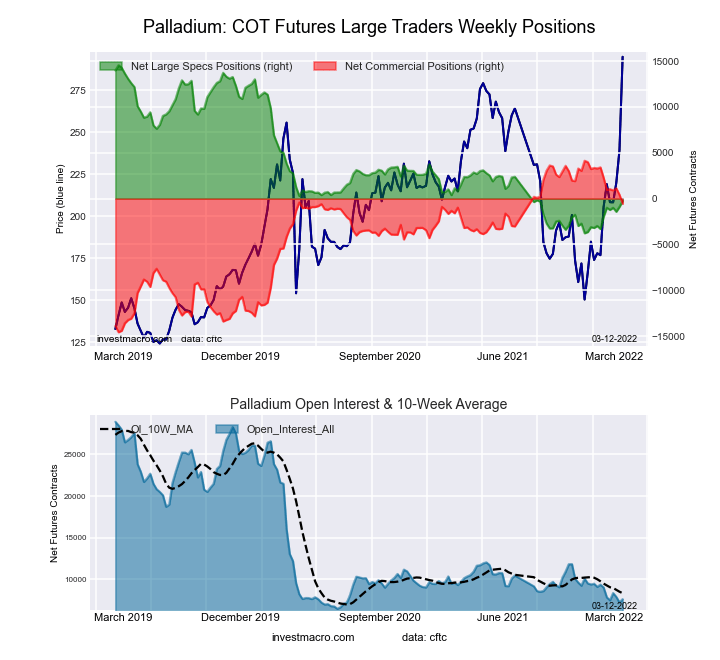
All the metals markets we cover saw higher speculator bets with Silver (7,349 contracts), Gold (16,766 contracts), Copper (9,726 contracts), Platinum (8,943 contracts) and Palladium (632 contracts) all rising for the week.
| Mar-08-2022 | OI | OI-Index | Spec-Net | Spec-Index | Com-Net | COM-Index | Smalls-Net | Smalls-Index |
|---|---|---|---|---|---|---|---|---|
| WTI Crude | 1,896,974 | 5 | 361,665 | 11 | -408,809 | 80 | 47,144 | 81 |
| Gold | 638,502 | 57 | 274,388 | 75 | -306,946 | 24 | 32,558 | 57 |
| Silver | 168,283 | 33 | 52,297 | 74 | -69,609 | 31 | 17,312 | 44 |
| Copper | 198,844 | 26 | 31,819 | 65 | -40,070 | 32 | 8,251 | 73 |
| Palladium | 7,631 | 5 | -272 | 20 | -563 | 73 | 835 | 94 |
| Platinum | 72,496 | 43 | 25,833 | 39 | -32,358 | 63 | 6,525 | 53 |
| Natural Gas | 1,085,853 | 0 | -138,413 | 37 | 97,671 | 62 | 40,742 | 82 |
| Brent | 196,832 | 37 | -11,712 | 92 | 10,814 | 11 | 898 | 21 |
| Heating Oil | 349,618 | 31 | 6,455 | 52 | -32,434 | 37 | 25,979 | 88 |
| Soybeans | 743,566 | 32 | 216,577 | 84 | -189,219 | 21 | -27,358 | 25 |
| Corn | 1,487,815 | 19 | 498,033 | 94 | -456,684 | 7 | -41,349 | 19 |
| Coffee | 224,222 | 3 | 52,113 | 86 | -56,074 | 16 | 3,961 | 16 |
| Sugar | 837,413 | 5 | 151,076 | 68 | -190,856 | 32 | 39,780 | 57 |
| Wheat | 342,996 | 4 | 12,625 | 58 | -5,496 | 35 | -7,129 | 72 |
Free Reports:
This week’s current strength score (the trader positioning range over the past three years, measured from 0 to 100) shows the speculators are currently Bullish with a score of 74.9 percent. The commercials are Bearish with a score of 24.0 percent and the small traders (not shown in chart) are Bullish with a score of 56.6 percent.
| Gold Futures Statistics | SPECULATORS | COMMERCIALS | SMALL TRADERS |
| – Percent of Open Interest Longs: | 57.1 | 21.8 | 8.8 |
| – Percent of Open Interest Shorts: | 14.1 | 69.9 | 3.7 |
| – Net Position: | 274,388 | -306,946 | 32,558 |
| – Gross Longs: | 364,618 | 139,397 | 55,964 |
| – Gross Shorts: | 90,230 | 446,343 | 23,406 |
| – Long to Short Ratio: | 4.0 to 1 | 0.3 to 1 | 2.4 to 1 |
| NET POSITION TREND: | |||
| – Strength Index Score (3 Year Range Pct): | 74.9 | 24.0 | 56.6 |
| – Strength Index Reading (3 Year Range): | Bullish | Bearish | Bullish |
| NET POSITION MOVEMENT INDEX: | |||
| – 6-Week Change in Strength Index: | 17.1 | -17.4 | 8.4 |
This week’s current strength score (the trader positioning range over the past three years, measured from 0 to 100) shows the speculators are currently Bullish with a score of 74.5 percent. The commercials are Bearish with a score of 30.6 percent and the small traders (not shown in chart) are Bearish with a score of 43.7 percent.
| Silver Futures Statistics | SPECULATORS | COMMERCIALS | SMALL TRADERS |
| – Percent of Open Interest Longs: | 45.5 | 29.0 | 17.0 |
| – Percent of Open Interest Shorts: | 14.4 | 70.4 | 6.7 |
| – Net Position: | 52,297 | -69,609 | 17,312 |
| – Gross Longs: | 76,565 | 48,816 | 28,583 |
| – Gross Shorts: | 24,268 | 118,425 | 11,271 |
| – Long to Short Ratio: | 3.2 to 1 | 0.4 to 1 | 2.5 to 1 |
| NET POSITION TREND: | |||
| – Strength Index Score (3 Year Range Pct): | 74.5 | 30.6 | 43.7 |
| – Strength Index Reading (3 Year Range): | Bullish | Bearish | Bearish |
| NET POSITION MOVEMENT INDEX: | |||
| – 6-Week Change in Strength Index: | 20.1 | -21.5 | 10.3 |
This week’s current strength score (the trader positioning range over the past three years, measured from 0 to 100) shows the speculators are currently Bullish with a score of 65.3 percent. The commercials are Bearish with a score of 31.9 percent and the small traders (not shown in chart) are Bullish with a score of 73.0 percent.
| Copper Futures Statistics | SPECULATORS | COMMERCIALS | SMALL TRADERS |
| – Percent of Open Interest Longs: | 44.1 | 37.7 | 9.6 |
| – Percent of Open Interest Shorts: | 28.1 | 57.9 | 5.4 |
| – Net Position: | 31,819 | -40,070 | 8,251 |
| – Gross Longs: | 87,744 | 74,975 | 19,023 |
| – Gross Shorts: | 55,925 | 115,045 | 10,772 |
| – Long to Short Ratio: | 1.6 to 1 | 0.7 to 1 | 1.8 to 1 |
| NET POSITION TREND: | |||
| – Strength Index Score (3 Year Range Pct): | 65.3 | 31.9 | 73.0 |
| – Strength Index Reading (3 Year Range): | Bullish | Bearish | Bullish |
| NET POSITION MOVEMENT INDEX: | |||
| – 6-Week Change in Strength Index: | 3.8 | -5.0 | 11.0 |
This week’s current strength score (the trader positioning range over the past three years, measured from 0 to 100) shows the speculators are currently Bearish with a score of 39.2 percent. The commercials are Bullish with a score of 62.7 percent and the small traders (not shown in chart) are Bullish with a score of 53.1 percent.
| Platinum Futures Statistics | SPECULATORS | COMMERCIALS | SMALL TRADERS |
| – Percent of Open Interest Longs: | 57.6 | 26.1 | 12.5 |
| – Percent of Open Interest Shorts: | 22.0 | 70.8 | 3.5 |
| – Net Position: | 25,833 | -32,358 | 6,525 |
| – Gross Longs: | 41,758 | 18,935 | 9,082 |
| – Gross Shorts: | 15,925 | 51,293 | 2,557 |
| – Long to Short Ratio: | 2.6 to 1 | 0.4 to 1 | 3.6 to 1 |
| NET POSITION TREND: | |||
| – Strength Index Score (3 Year Range Pct): | 39.2 | 62.7 | 53.1 |
| – Strength Index Reading (3 Year Range): | Bearish | Bullish | Bullish |
| NET POSITION MOVEMENT INDEX: | |||
| – 6-Week Change in Strength Index: | 17.5 | -18.8 | 15.2 |
This week’s current strength score (the trader positioning range over the past three years, measured from 0 to 100) shows the speculators are currently Bearish with a score of 20.0 percent. The commercials are Bullish with a score of 73.2 percent and the small traders (not shown in chart) are Bullish-Extreme with a score of 93.8 percent.
| Palladium Futures Statistics | SPECULATORS | COMMERCIALS | SMALL TRADERS |
| – Percent of Open Interest Longs: | 34.4 | 42.6 | 22.1 |
| – Percent of Open Interest Shorts: | 38.0 | 49.9 | 11.2 |
| – Net Position: | -272 | -563 | 835 |
| – Gross Longs: | 2,624 | 3,247 | 1,686 |
| – Gross Shorts: | 2,896 | 3,810 | 851 |
| – Long to Short Ratio: | 0.9 to 1 | 0.9 to 1 | 2.0 to 1 |
| NET POSITION TREND: | |||
| – Strength Index Score (3 Year Range Pct): | 20.0 | 73.2 | 93.8 |
| – Strength Index Reading (3 Year Range): | Bearish | Bullish | Bullish-Extreme |
| NET POSITION MOVEMENT INDEX: | |||
| – 6-Week Change in Strength Index: | 9.8 | -16.2 | 66.0 |
Article By InvestMacro – Receive our weekly COT Reports by Email
*COT Report: The COT data, released weekly to the public each Friday, is updated through the most recent Tuesday (data is 3 days old) and shows a quick view of how large speculators or non-commercials (for-profit traders) were positioned in the futures markets.
The CFTC categorizes trader positions according to commercial hedgers (traders who use futures contracts for hedging as part of the business), non-commercials (large traders who speculate to realize trading profits) and nonreportable traders (usually small traders/speculators) as well as their open interest (contracts open in the market at time of reporting).See CFTC criteria here.
By Jeffrey Young, Georgia Institute of Technology You’ve probably heard artificial intelligence models described as…
Source: Barry Dawes (7/23/26) Barry Dawes of Martin Place Securities shares his analysis of the…
By JustMarkets The US stock indices ended Thursday’s session with a notable decline amid a…
By Analytical Department RoboForex USD/JPY soared to 163.81 on Friday, marking a new 40-year high.…
By JustMarkets The US equities ended Wednesday’s session lower amid investor caution ahead of the…
By Analytical Department RoboForex EUR/USD rose to 1.1429 on Thursday, with the US dollar continuing…
This website uses cookies.