By InvestMacro | COT | Data Tables | COT Leaders | Downloads | COT Newsletter
Here are the latest charts and statistics for the Commitment of Traders (COT) data published by the Commodities Futures Trading Commission (CFTC).
The latest COT data is updated through Tuesday February 22nd and shows a quick view of how large traders (for-profit speculators and commercial entities) were positioned in the futures markets.
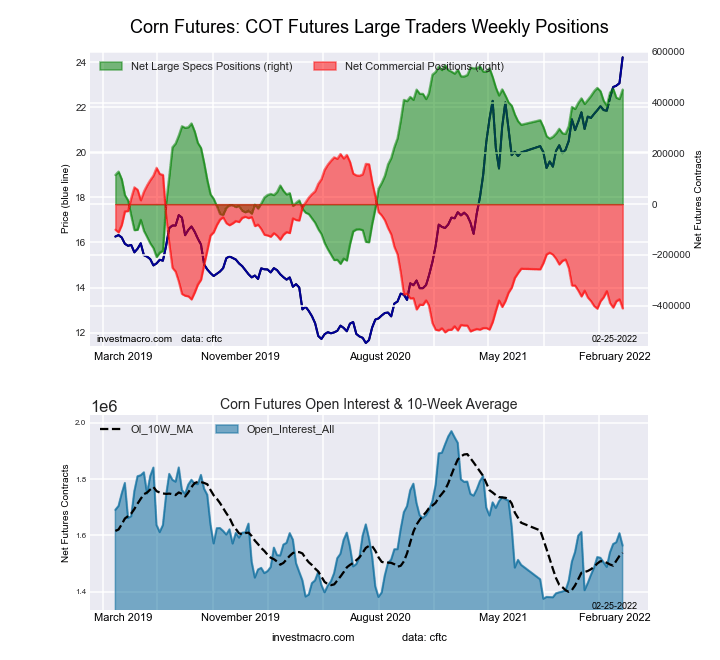
Highlighting the COT soft commodities data is this week’s jump in Corn futures bets. The speculative net position in the Corn futures rose sharply this week following two weeks of decline. The Corn speculator position, despite falling in the previous two weeks, have now actually gained by a total of +63,604 contracts over the past five weeks. The boost has pushed speculator positions to the highest bullish position of the past three weeks and second highest of the past eight weeks. Corn prices, meanwhile, surged upwards this week and touched the highest level since May of last year.
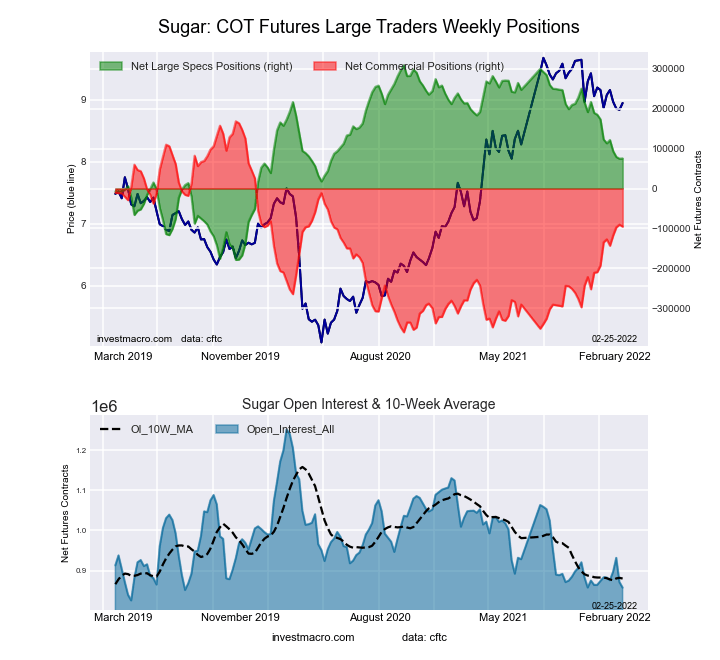
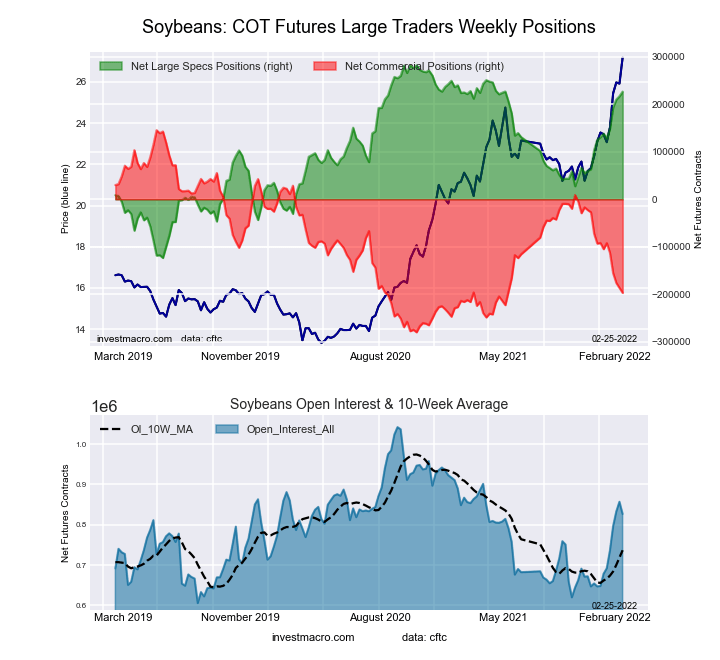
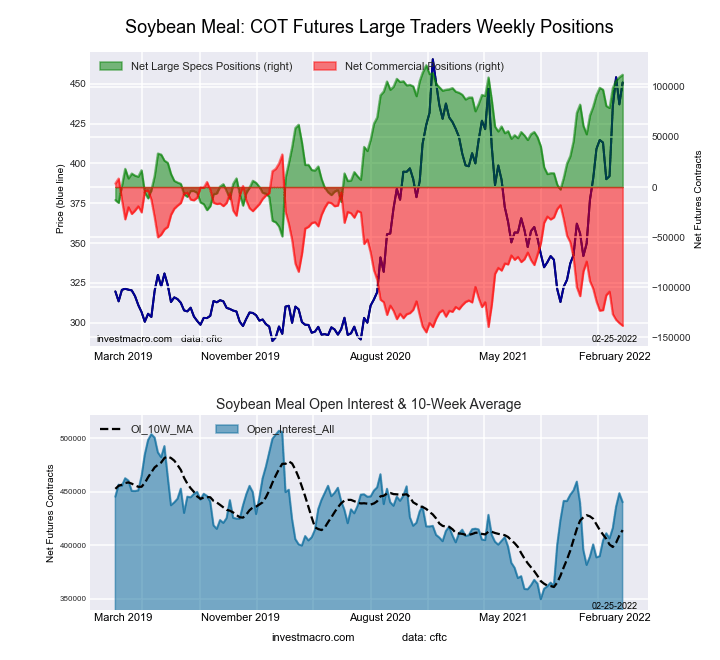
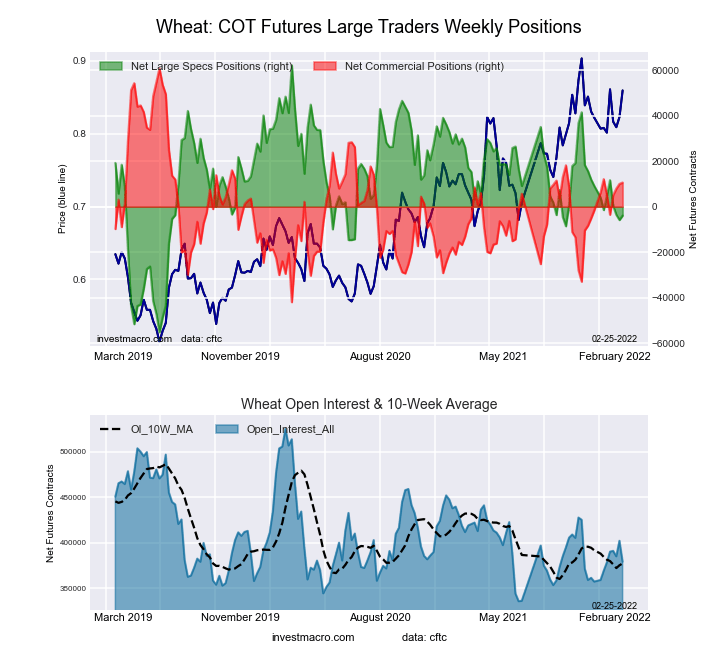
The soft commodities that saw higher speculator bets this week were Corn (37,250 contracts), Sugar (683 contracts), Soybeans (9,732 contracts), Soybean Oil (15,773 contracts), Soybean Meal (2,556 contracts) and Wheat (1,944 contracts).
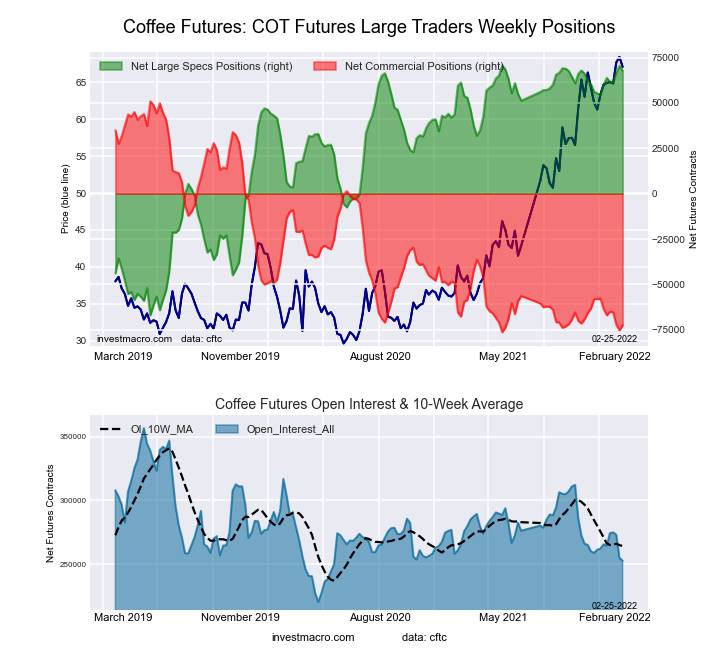
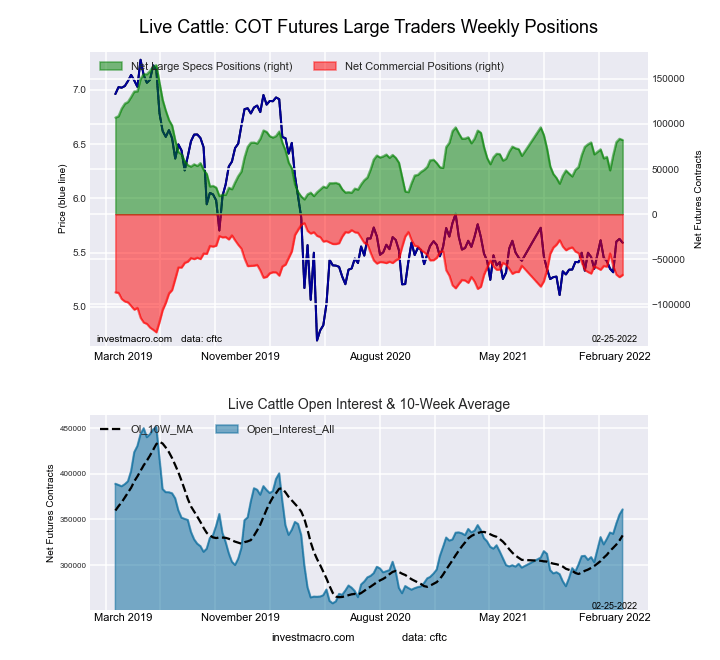
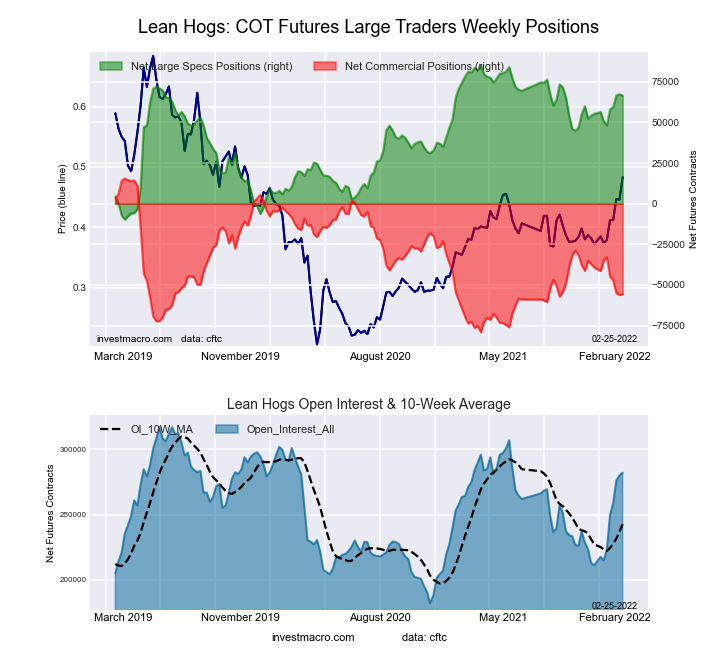
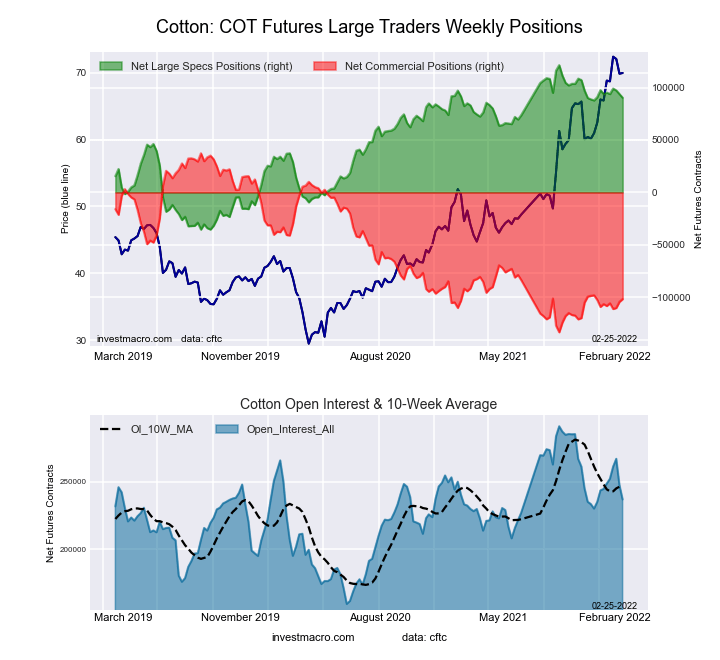
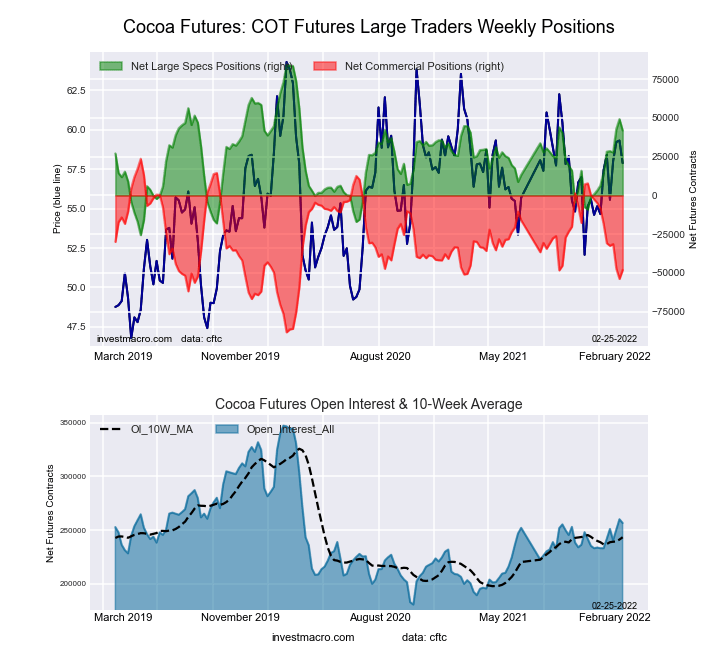
The soft commodities that saw lower speculator bets this week were Coffee (-2,634 contracts), Cocoa (-7,301 contracts), Live Cattle (-1,324 contracts), Cotton (-3,421 contracts) and Lean Hogs (-894 contracts).
Free Reports:
| Feb-22-2022 | OI | OI-Index | Spec-Net | Spec-Index | Com-Net | COM-Index | Smalls-Net | Smalls-Index |
|---|---|---|---|---|---|---|---|---|
| WTI Crude | 2,058,132 | 29 | 339,041 | 2 | -382,891 | 90 | 43,850 | 77 |
| Gold | 611,488 | 49 | 243,148 | 65 | -269,722 | 35 | 26,574 | 40 |
| Silver | 163,745 | 29 | 30,302 | 53 | -43,720 | 56 | 13,418 | 21 |
| Copper | 204,123 | 29 | 25,575 | 61 | -34,754 | 36 | 9,179 | 78 |
| Palladium | 7,903 | 7 | -1,429 | 13 | 1,118 | 83 | 311 | 63 |
| Platinum | 62,274 | 26 | 17,540 | 27 | -22,887 | 76 | 5,347 | 37 |
| Natural Gas | 1,107,113 | 2 | -130,629 | 39 | 95,974 | 61 | 34,655 | 67 |
| Brent | 215,908 | 52 | -26,355 | 73 | 24,478 | 31 | 1,877 | 35 |
| Heating Oil | 349,618 | 31 | 6,455 | 52 | -32,434 | 37 | 25,979 | 88 |
| Soybeans | 826,824 | 51 | 226,464 | 86 | -196,755 | 20 | -29,709 | 21 |
| Corn | 1,563,758 | 32 | 451,742 | 88 | -410,962 | 13 | -40,780 | 20 |
| Coffee | 252,688 | 24 | 67,791 | 98 | -72,509 | 3 | 4,718 | 21 |
| Sugar | 857,376 | 8 | 75,246 | 52 | -95,306 | 50 | 20,060 | 33 |
| Wheat | 379,308 | 23 | -3,902 | 44 | 10,629 | 51 | -6,727 | 69 |
This week’s current strength score (the trader positioning range over the past three years, measured from 0 to 100) shows the speculators are currently Bullish-Extreme with a score of 87.7 percent. The commercials are Bearish-Extreme with a score of 13.4 percent and the small traders (not shown in chart) are Bearish-Extreme with a score of 19.6 percent.
| CORN Futures Statistics | SPECULATORS | COMMERCIALS | SMALL TRADERS |
| – Percent of Open Interest Longs: | 34.3 | 43.5 | 9.2 |
| – Percent of Open Interest Shorts: | 5.4 | 69.8 | 11.8 |
| – Net Position: | 451,742 | -410,962 | -40,780 |
| – Gross Longs: | 536,898 | 680,211 | 144,247 |
| – Gross Shorts: | 85,156 | 1,091,173 | 185,027 |
| – Long to Short Ratio: | 6.3 to 1 | 0.6 to 1 | 0.8 to 1 |
| NET POSITION TREND: | |||
| – Strength Index Score (3 Year Range Pct): | 87.7 | 13.4 | 19.6 |
| – Strength Index Reading (3 Year Range): | Bullish-Extreme | Bearish-Extreme | Bearish-Extreme |
| NET POSITION MOVEMENT INDEX: | |||
| – 6-Week Change in Strength Index: | 5.7 | -6.3 | -0.1 |
This week’s current strength score (the trader positioning range over the past three years, measured from 0 to 100) shows the speculators are currently Bullish with a score of 52.1 percent. The commercials are Bullish with a score of 50.1 percent and the small traders (not shown in chart) are Bearish with a score of 32.7 percent.
| SUGAR Futures Statistics | SPECULATORS | COMMERCIALS | SMALL TRADERS |
| – Percent of Open Interest Longs: | 21.3 | 56.0 | 9.2 |
| – Percent of Open Interest Shorts: | 12.6 | 67.1 | 6.9 |
| – Net Position: | 75,246 | -95,306 | 20,060 |
| – Gross Longs: | 183,029 | 480,097 | 79,212 |
| – Gross Shorts: | 107,783 | 575,403 | 59,152 |
| – Long to Short Ratio: | 1.7 to 1 | 0.8 to 1 | 1.3 to 1 |
| NET POSITION TREND: | |||
| – Strength Index Score (3 Year Range Pct): | 52.1 | 50.1 | 32.7 |
| – Strength Index Reading (3 Year Range): | Bullish | Bullish | Bearish |
| NET POSITION MOVEMENT INDEX: | |||
| – 6-Week Change in Strength Index: | -9.8 | 7.4 | 10.5 |
This week’s current strength score (the trader positioning range over the past three years, measured from 0 to 100) shows the speculators are currently Bullish-Extreme with a score of 97.8 percent. The commercials are Bearish-Extreme with a score of 3.0 percent and the small traders (not shown in chart) are Bearish with a score of 21.0 percent.
| COFFEE Futures Statistics | SPECULATORS | COMMERCIALS | SMALL TRADERS |
| – Percent of Open Interest Longs: | 30.7 | 41.8 | 4.3 |
| – Percent of Open Interest Shorts: | 3.9 | 70.5 | 2.5 |
| – Net Position: | 67,791 | -72,509 | 4,718 |
| – Gross Longs: | 77,625 | 105,619 | 10,958 |
| – Gross Shorts: | 9,834 | 178,128 | 6,240 |
| – Long to Short Ratio: | 7.9 to 1 | 0.6 to 1 | 1.8 to 1 |
| NET POSITION TREND: | |||
| – Strength Index Score (3 Year Range Pct): | 97.8 | 3.0 | 21.0 |
| – Strength Index Reading (3 Year Range): | Bullish-Extreme | Bearish-Extreme | Bearish |
| NET POSITION MOVEMENT INDEX: | |||
| – 6-Week Change in Strength Index: | 5.5 | -7.0 | 9.0 |
This week’s current strength score (the trader positioning range over the past three years, measured from 0 to 100) shows the speculators are currently Bullish-Extreme with a score of 86.3 percent. The commercials are Bearish-Extreme with a score of 19.5 percent and the small traders (not shown in chart) are Bearish with a score of 20.8 percent.
| SOYBEANS Futures Statistics | SPECULATORS | COMMERCIALS | SMALL TRADERS |
| – Percent of Open Interest Longs: | 33.1 | 42.9 | 6.9 |
| – Percent of Open Interest Shorts: | 5.8 | 66.7 | 10.5 |
| – Net Position: | 226,464 | -196,755 | -29,709 |
| – Gross Longs: | 274,012 | 354,837 | 57,443 |
| – Gross Shorts: | 47,548 | 551,592 | 87,152 |
| – Long to Short Ratio: | 5.8 to 1 | 0.6 to 1 | 0.7 to 1 |
| NET POSITION TREND: | |||
| – Strength Index Score (3 Year Range Pct): | 86.3 | 19.5 | 20.8 |
| – Strength Index Reading (3 Year Range): | Bullish-Extreme | Bearish-Extreme | Bearish |
| NET POSITION MOVEMENT INDEX: | |||
| – 6-Week Change in Strength Index: | 21.8 | -21.6 | 6.2 |
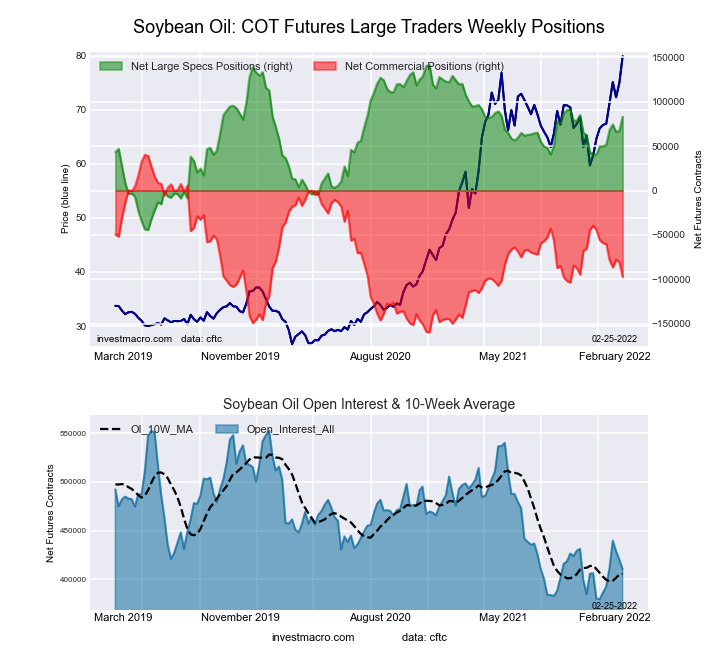
This week’s current strength score (the trader positioning range over the past three years, measured from 0 to 100) shows the speculators are currently Bullish with a score of 68.7 percent. The commercials are Bearish with a score of 31.1 percent and the small traders (not shown in chart) are Bullish with a score of 66.4 percent.
| SOYBEAN OIL Futures Statistics | SPECULATORS | COMMERCIALS | SMALL TRADERS |
| – Percent of Open Interest Longs: | 27.8 | 44.7 | 9.3 |
| – Percent of Open Interest Shorts: | 7.6 | 68.4 | 5.9 |
| – Net Position: | 83,093 | -97,272 | 14,179 |
| – Gross Longs: | 114,335 | 183,547 | 38,221 |
| – Gross Shorts: | 31,242 | 280,819 | 24,042 |
| – Long to Short Ratio: | 3.7 to 1 | 0.7 to 1 | 1.6 to 1 |
| NET POSITION TREND: | |||
| – Strength Index Score (3 Year Range Pct): | 68.7 | 31.1 | 66.4 |
| – Strength Index Reading (3 Year Range): | Bullish | Bearish | Bullish |
| NET POSITION MOVEMENT INDEX: | |||
| – 6-Week Change in Strength Index: | 17.9 | -19.1 | 18.5 |
This week’s current strength score (the trader positioning range over the past three years, measured from 0 to 100) shows the speculators are currently Bullish-Extreme with a score of 94.4 percent. The commercials are Bearish-Extreme with a score of 3.7 percent and the small traders (not shown in chart) are Bullish with a score of 76.4 percent.
| SOYBEAN MEAL Futures Statistics | SPECULATORS | COMMERCIALS | SMALL TRADERS |
| – Percent of Open Interest Longs: | 29.5 | 41.9 | 11.4 |
| – Percent of Open Interest Shorts: | 4.0 | 73.4 | 5.4 |
| – Net Position: | 112,100 | -138,497 | 26,397 |
| – Gross Longs: | 129,919 | 184,652 | 49,974 |
| – Gross Shorts: | 17,819 | 323,149 | 23,577 |
| – Long to Short Ratio: | 7.3 to 1 | 0.6 to 1 | 2.1 to 1 |
| NET POSITION TREND: | |||
| – Strength Index Score (3 Year Range Pct): | 94.4 | 3.7 | 76.4 |
| – Strength Index Reading (3 Year Range): | Bullish-Extreme | Bearish-Extreme | Bullish |
| NET POSITION MOVEMENT INDEX: | |||
| – 6-Week Change in Strength Index: | 8.7 | -8.8 | 3.0 |
This week’s current strength score (the trader positioning range over the past three years, measured from 0 to 100) shows the speculators are currently Bearish with a score of 44.3 percent. The commercials are Bullish with a score of 52.5 percent and the small traders (not shown in chart) are Bullish with a score of 50.6 percent.
| LIVE CATTLE Futures Statistics | SPECULATORS | COMMERCIALS | SMALL TRADERS |
| – Percent of Open Interest Longs: | 36.4 | 36.4 | 9.0 |
| – Percent of Open Interest Shorts: | 13.7 | 55.1 | 13.2 |
| – Net Position: | 82,243 | -67,284 | -14,959 |
| – Gross Longs: | 131,540 | 131,571 | 32,596 |
| – Gross Shorts: | 49,297 | 198,855 | 47,555 |
| – Long to Short Ratio: | 2.7 to 1 | 0.7 to 1 | 0.7 to 1 |
| NET POSITION TREND: | |||
| – Strength Index Score (3 Year Range Pct): | 44.3 | 52.5 | 50.6 |
| – Strength Index Reading (3 Year Range): | Bearish | Bullish | Bullish |
| NET POSITION MOVEMENT INDEX: | |||
| – 6-Week Change in Strength Index: | 13.7 | -8.2 | -25.5 |
This week’s current strength score (the trader positioning range over the past three years, measured from 0 to 100) shows the speculators are currently Bullish with a score of 79.1 percent. The commercials are Bearish with a score of 25.1 percent and the small traders (not shown in chart) are Bearish with a score of 33.4 percent.
| LEAN HOGS Futures Statistics | SPECULATORS | COMMERCIALS | SMALL TRADERS |
| – Percent of Open Interest Longs: | 39.3 | 32.5 | 8.2 |
| – Percent of Open Interest Shorts: | 15.8 | 52.2 | 12.0 |
| – Net Position: | 66,438 | -55,639 | -10,799 |
| – Gross Longs: | 111,021 | 91,697 | 23,034 |
| – Gross Shorts: | 44,583 | 147,336 | 33,833 |
| – Long to Short Ratio: | 2.5 to 1 | 0.6 to 1 | 0.7 to 1 |
| NET POSITION TREND: | |||
| – Strength Index Score (3 Year Range Pct): | 79.1 | 25.1 | 33.4 |
| – Strength Index Reading (3 Year Range): | Bullish | Bearish | Bearish |
| NET POSITION MOVEMENT INDEX: | |||
| – 6-Week Change in Strength Index: | 17.2 | -22.2 | 21.1 |
This week’s current strength score (the trader positioning range over the past three years, measured from 0 to 100) shows the speculators are currently Bullish-Extreme with a score of 80.2 percent. The commercials are Bearish-Extreme with a score of 18.5 percent and the small traders (not shown in chart) are Bullish-Extreme with a score of 84.9 percent.
| COTTON Futures Statistics | SPECULATORS | COMMERCIALS | SMALL TRADERS |
| – Percent of Open Interest Longs: | 43.4 | 38.3 | 8.2 |
| – Percent of Open Interest Shorts: | 5.3 | 81.2 | 3.4 |
| – Net Position: | 90,302 | -101,731 | 11,429 |
| – Gross Longs: | 102,764 | 90,576 | 19,371 |
| – Gross Shorts: | 12,462 | 192,307 | 7,942 |
| – Long to Short Ratio: | 8.2 to 1 | 0.5 to 1 | 2.4 to 1 |
| NET POSITION TREND: | |||
| – Strength Index Score (3 Year Range Pct): | 80.2 | 18.5 | 84.9 |
| – Strength Index Reading (3 Year Range): | Bullish-Extreme | Bearish-Extreme | Bullish-Extreme |
| NET POSITION MOVEMENT INDEX: | |||
| – 6-Week Change in Strength Index: | -2.2 | 2.8 | -7.6 |
This week’s current strength score (the trader positioning range over the past three years, measured from 0 to 100) shows the speculators are currently Bullish with a score of 61.6 percent. The commercials are Bearish with a score of 35.9 percent and the small traders (not shown in chart) are Bullish with a score of 78.5 percent.
| COCOA Futures Statistics | SPECULATORS | COMMERCIALS | SMALL TRADERS |
| – Percent of Open Interest Longs: | 32.7 | 42.7 | 5.5 |
| – Percent of Open Interest Shorts: | 16.4 | 61.4 | 3.1 |
| – Net Position: | 41,915 | -48,066 | 6,151 |
| – Gross Longs: | 83,987 | 109,435 | 14,151 |
| – Gross Shorts: | 42,072 | 157,501 | 8,000 |
| – Long to Short Ratio: | 2.0 to 1 | 0.7 to 1 | 1.8 to 1 |
| NET POSITION TREND: | |||
| – Strength Index Score (3 Year Range Pct): | 61.6 | 35.9 | 78.5 |
| – Strength Index Reading (3 Year Range): | Bullish | Bearish | Bullish |
| NET POSITION MOVEMENT INDEX: | |||
| – 6-Week Change in Strength Index: | 24.6 | -26.5 | 30.1 |
This week’s current strength score (the trader positioning range over the past three years, measured from 0 to 100) shows the speculators are currently Bearish with a score of 43.7 percent. The commercials are Bullish with a score of 51.2 percent and the small traders (not shown in chart) are Bullish with a score of 69.4 percent.
| WHEAT Futures Statistics | SPECULATORS | COMMERCIALS | SMALL TRADERS |
| – Percent of Open Interest Longs: | 25.8 | 40.8 | 8.9 |
| – Percent of Open Interest Shorts: | 26.8 | 38.0 | 10.7 |
| – Net Position: | -3,902 | 10,629 | -6,727 |
| – Gross Longs: | 97,675 | 154,648 | 33,795 |
| – Gross Shorts: | 101,577 | 144,019 | 40,522 |
| – Long to Short Ratio: | 1.0 to 1 | 1.1 to 1 | 0.8 to 1 |
| NET POSITION TREND: | |||
| – Strength Index Score (3 Year Range Pct): | 43.7 | 51.2 | 69.4 |
| – Strength Index Reading (3 Year Range): | Bearish | Bullish | Bullish |
| NET POSITION MOVEMENT INDEX: | |||
| – 6-Week Change in Strength Index: | -2.1 | -1.4 | 18.7 |
Article By InvestMacro – Receive our weekly COT Reports by Email
*COT Report: The COT data, released weekly to the public each Friday, is updated through the most recent Tuesday (data is 3 days old) and shows a quick view of how large speculators or non-commercials (for-profit traders) were positioned in the futures markets.
The CFTC categorizes trader positions according to commercial hedgers (traders who use futures contracts for hedging as part of the business), non-commercials (large traders who speculate to realize trading profits) and nonreportable traders (usually small traders/speculators) as well as their open interest (contracts open in the market at time of reporting).See CFTC criteria here.
By JustMarkets The US equity indices ended Friday’s session mixed. The Dow Jones (US30) gained…
By Analytical Department RoboForex EUR/USD enters the final week of July at 1.1369. Friday's modest…
By InvestMacro Here are the latest charts and statistics for the Commitment of Traders (COT)…
By InvestMacro The latest update for the weekly Commitment of Traders (COT) report was released…
By InvestMacro Here are the latest charts and statistics for the Commitment of Traders (COT)…
By InvestMacro Here are the latest charts and statistics for the Commitment of Traders (COT)…
This website uses cookies.