By InvestMacro | COT | Data Tables | COT Leaders | Downloads | COT Newsletter
Here are the latest charts and statistics for the Commitment of Traders (COT) data published by the Commodities Futures Trading Commission (CFTC).
The latest COT data is updated through Tuesday February 22nd and shows a quick view of how large traders (for-profit speculators and commercial entities) were positioned in the futures markets.
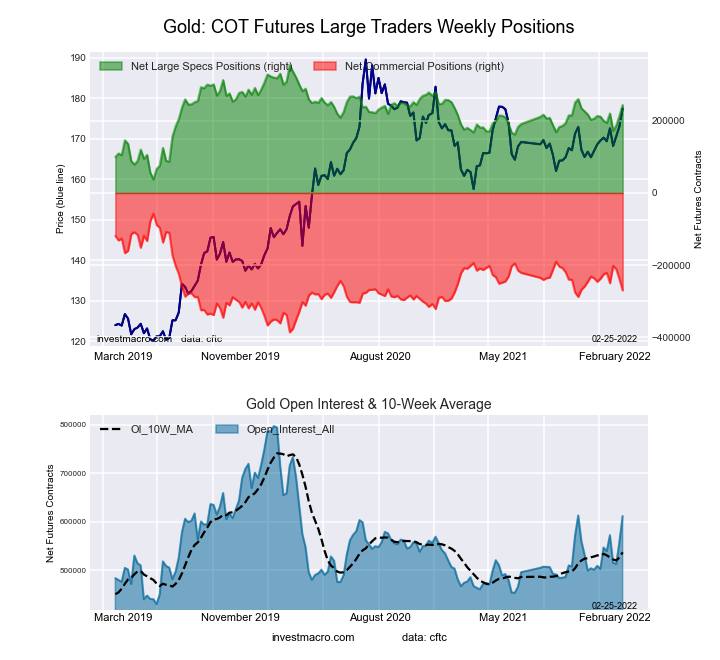
Highlighting the COT metals data is the sharp jump in the Gold futures bets. The speculative net position in the Gold futures has gained strongly for three consecutive weeks and by a total of +71,006 contracts over that time-frame. This week’s rise by +29,535 contracts marked the largest one-week gain of the past fifteen weeks and has brought the overall Gold speculator standing to the highest standing of the past fourteen weeks, dating back to November 16th. The Gold spot price rose sharply as well this week with a spike on Thursday (on the Russian invasion of Ukraine) that brought the spot price to the $1,976 price level before settling lower back below $1,900 as the week ended.
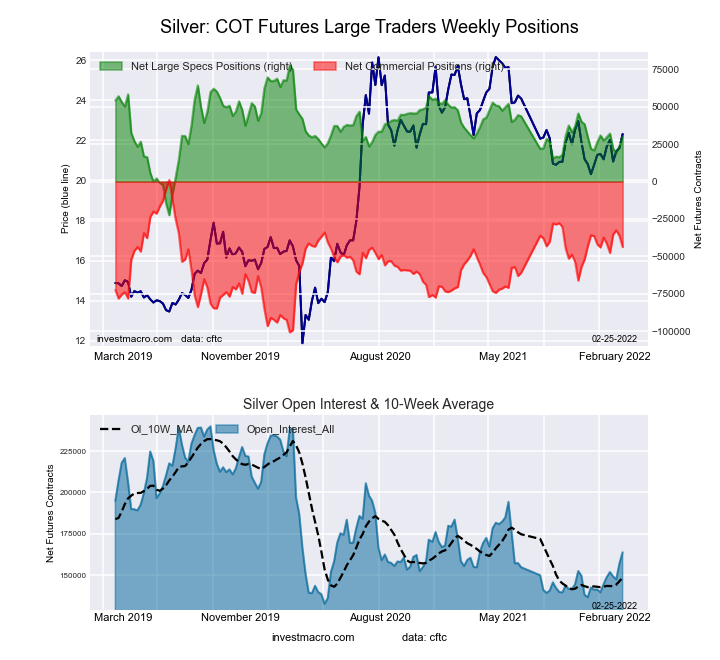
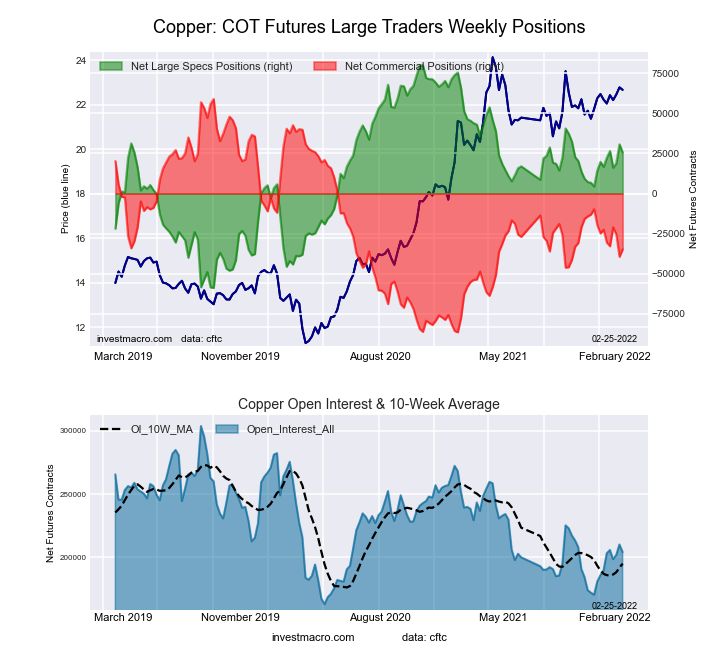
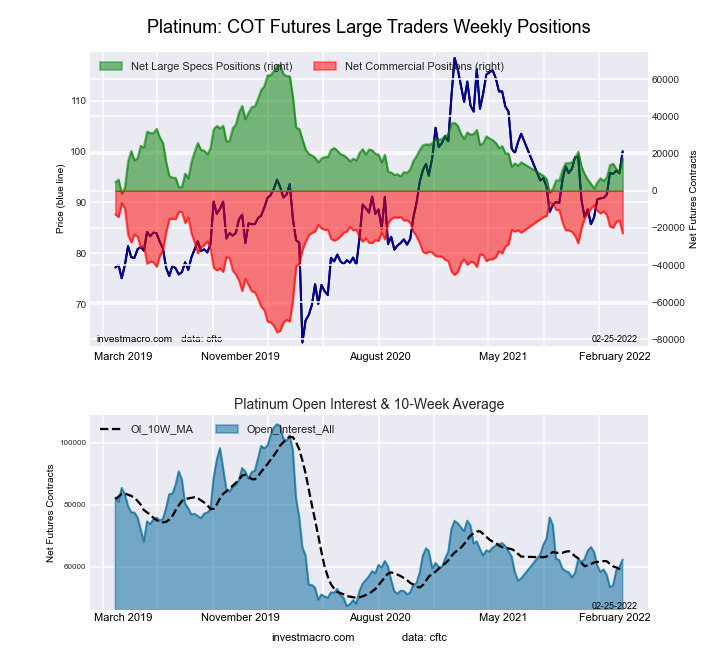
Joining Gold (29,535 contracts) with rising speculator positions this week were Silver (6,746 contracts) and Platinum (7,408 contracts) while Copper (-5,117 contracts) and Palladium (-429 contracts) saw lower speculator bets on the week.
| Feb-22-2022 | OI | OI-Index | Spec-Net | Spec-Index | Com-Net | COM-Index | Smalls-Net | Smalls-Index |
|---|---|---|---|---|---|---|---|---|
| WTI Crude | 2,058,132 | 29 | 339,041 | 2 | -382,891 | 90 | 43,850 | 77 |
| Gold | 611,488 | 49 | 243,148 | 65 | -269,722 | 35 | 26,574 | 40 |
| Silver | 163,745 | 29 | 30,302 | 53 | -43,720 | 56 | 13,418 | 21 |
| Copper | 204,123 | 29 | 25,575 | 61 | -34,754 | 36 | 9,179 | 78 |
| Palladium | 7,903 | 7 | -1,429 | 13 | 1,118 | 83 | 311 | 63 |
| Platinum | 62,274 | 26 | 17,540 | 27 | -22,887 | 76 | 5,347 | 37 |
| Natural Gas | 1,107,113 | 2 | -130,629 | 39 | 95,974 | 61 | 34,655 | 67 |
| Brent | 215,908 | 52 | -26,355 | 73 | 24,478 | 31 | 1,877 | 35 |
| Heating Oil | 349,618 | 31 | 6,455 | 52 | -32,434 | 37 | 25,979 | 88 |
| Soybeans | 826,824 | 51 | 226,464 | 86 | -196,755 | 20 | -29,709 | 21 |
| Corn | 1,563,758 | 32 | 451,742 | 88 | -410,962 | 13 | -40,780 | 20 |
| Coffee | 252,688 | 24 | 67,791 | 98 | -72,509 | 3 | 4,718 | 21 |
| Sugar | 857,376 | 8 | 75,246 | 52 | -95,306 | 50 | 20,060 | 33 |
| Wheat | 379,308 | 23 | -3,902 | 44 | 10,629 | 51 | -6,727 | 69 |
Free Reports:
This week’s current strength score (the trader positioning range over the past three years, measured from 0 to 100) shows the speculators are currently Bullish with a score of 65.1 percent. The commercials are Bearish with a score of 35.3 percent and the small traders (not shown in chart) are Bearish with a score of 39.6 percent.
| Gold Futures Statistics | SPECULATORS | COMMERCIALS | SMALL TRADERS |
| – Percent of Open Interest Longs: | 57.3 | 21.2 | 8.0 |
| – Percent of Open Interest Shorts: | 17.5 | 65.3 | 3.7 |
| – Net Position: | 243,148 | -269,722 | 26,574 |
| – Gross Longs: | 350,096 | 129,682 | 49,090 |
| – Gross Shorts: | 106,948 | 399,404 | 22,516 |
| – Long to Short Ratio: | 3.3 to 1 | 0.3 to 1 | 2.2 to 1 |
| NET POSITION TREND: | |||
| – Strength Index Score (3 Year Range Pct): | 65.1 | 35.3 | 39.6 |
| – Strength Index Reading (3 Year Range): | Bullish | Bearish | Bearish |
| NET POSITION MOVEMENT INDEX: | |||
| – 6-Week Change in Strength Index: | 13.7 | -13.6 | 3.5 |
This week’s current strength score (the trader positioning range over the past three years, measured from 0 to 100) shows the speculators are currently Bullish with a score of 52.6 percent. The commercials are Bullish with a score of 56.0 percent and the small traders (not shown in chart) are Bearish with a score of 21.0 percent.
| Silver Futures Statistics | SPECULATORS | COMMERCIALS | SMALL TRADERS |
| – Percent of Open Interest Longs: | 35.9 | 34.0 | 16.2 |
| – Percent of Open Interest Shorts: | 17.4 | 60.7 | 8.0 |
| – Net Position: | 30,302 | -43,720 | 13,418 |
| – Gross Longs: | 58,830 | 55,747 | 26,556 |
| – Gross Shorts: | 28,528 | 99,467 | 13,138 |
| – Long to Short Ratio: | 2.1 to 1 | 0.6 to 1 | 2.0 to 1 |
| NET POSITION TREND: | |||
| – Strength Index Score (3 Year Range Pct): | 52.6 | 56.0 | 21.0 |
| – Strength Index Reading (3 Year Range): | Bullish | Bullish | Bearish |
| NET POSITION MOVEMENT INDEX: | |||
| – 6-Week Change in Strength Index: | 2.7 | -6.2 | 21.0 |
This week’s current strength score (the trader positioning range over the past three years, measured from 0 to 100) shows the speculators are currently Bullish with a score of 60.8 percent. The commercials are Bearish with a score of 35.6 percent and the small traders (not shown in chart) are Bullish with a score of 78.4 percent.
| Copper Futures Statistics | SPECULATORS | COMMERCIALS | SMALL TRADERS |
| – Percent of Open Interest Longs: | 39.7 | 37.9 | 10.1 |
| – Percent of Open Interest Shorts: | 27.1 | 54.9 | 5.6 |
| – Net Position: | 25,575 | -34,754 | 9,179 |
| – Gross Longs: | 80,940 | 77,398 | 20,535 |
| – Gross Shorts: | 55,365 | 112,152 | 11,356 |
| – Long to Short Ratio: | 1.5 to 1 | 0.7 to 1 | 1.8 to 1 |
| NET POSITION TREND: | |||
| – Strength Index Score (3 Year Range Pct): | 60.8 | 35.6 | 78.4 |
| – Strength Index Reading (3 Year Range): | Bullish | Bearish | Bullish |
| NET POSITION MOVEMENT INDEX: | |||
| – 6-Week Change in Strength Index: | 6.4 | -8.4 | 19.3 |
This week’s current strength score (the trader positioning range over the past three years, measured from 0 to 100) shows the speculators are currently Bearish with a score of 27.1 percent. The commercials are Bullish with a score of 76.3 percent and the small traders (not shown in chart) are Bearish with a score of 36.6 percent.
| Platinum Futures Statistics | SPECULATORS | COMMERCIALS | SMALL TRADERS |
| – Percent of Open Interest Longs: | 52.1 | 30.6 | 13.6 |
| – Percent of Open Interest Shorts: | 24.0 | 67.4 | 5.1 |
| – Net Position: | 17,540 | -22,887 | 5,347 |
| – Gross Longs: | 32,462 | 19,079 | 8,495 |
| – Gross Shorts: | 14,922 | 41,966 | 3,148 |
| – Long to Short Ratio: | 2.2 to 1 | 0.5 to 1 | 2.7 to 1 |
| NET POSITION TREND: | |||
| – Strength Index Score (3 Year Range Pct): | 27.1 | 76.3 | 36.6 |
| – Strength Index Reading (3 Year Range): | Bearish | Bullish | Bearish |
| NET POSITION MOVEMENT INDEX: | |||
| – 6-Week Change in Strength Index: | 17.8 | -17.1 | -4.4 |
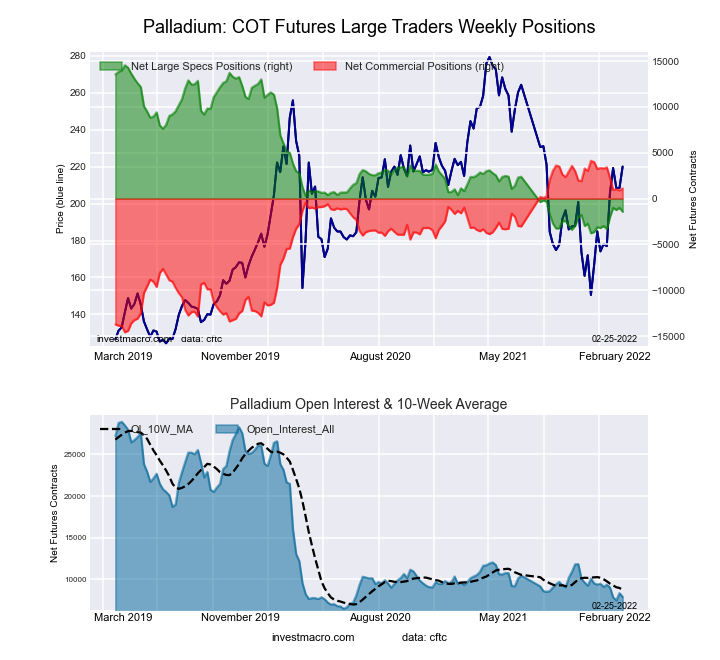
This week’s current strength score (the trader positioning range over the past three years, measured from 0 to 100) shows the speculators are currently Bearish-Extreme with a score of 13.4 percent. The commercials are Bullish-Extreme with a score of 83.0 percent and the small traders (not shown in chart) are Bullish with a score of 63.0 percent.
| Palladium Futures Statistics | SPECULATORS | COMMERCIALS | SMALL TRADERS |
| – Percent of Open Interest Longs: | 25.7 | 50.0 | 18.3 |
| – Percent of Open Interest Shorts: | 43.8 | 35.9 | 14.3 |
| – Net Position: | -1,429 | 1,118 | 311 |
| – Gross Longs: | 2,030 | 3,953 | 1,444 |
| – Gross Shorts: | 3,459 | 2,835 | 1,133 |
| – Long to Short Ratio: | 0.6 to 1 | 1.4 to 1 | 1.3 to 1 |
| NET POSITION TREND: | |||
| – Strength Index Score (3 Year Range Pct): | 13.4 | 83.0 | 63.0 |
| – Strength Index Reading (3 Year Range): | Bearish-Extreme | Bullish-Extreme | Bullish |
| NET POSITION MOVEMENT INDEX: | |||
| – 6-Week Change in Strength Index: | 8.9 | -12.3 | 36.8 |
Article By InvestMacro – Receive our weekly COT Reports by Email
*COT Report: The COT data, released weekly to the public each Friday, is updated through the most recent Tuesday (data is 3 days old) and shows a quick view of how large speculators or non-commercials (for-profit traders) were positioned in the futures markets.
The CFTC categorizes trader positions according to commercial hedgers (traders who use futures contracts for hedging as part of the business), non-commercials (large traders who speculate to realize trading profits) and nonreportable traders (usually small traders/speculators) as well as their open interest (contracts open in the market at time of reporting).See CFTC criteria here.
By JustMarkets The US equities ended Wednesday’s session lower amid investor caution ahead of the…
By Analytical Department RoboForex EUR/USD rose to 1.1429 on Thursday, with the US dollar continuing…
By Laura Russo, University of Tennessee A surprisingly large number and diversity of bee species…
By JustMarkets The US stock indices ended Tuesday with confident gains, fully driven by a…
By Analytical Department RoboForex Gold traded around 4,080 USD per ounce on Wednesday, having risen…
By JustMarkets The US stock indices started the week on a downbeat note. By the…
This website uses cookies.