By InvestMacro | COT | Data Tables | COT Leaders | Downloads | COT Newsletter
Here are the latest charts and statistics for the Commitment of Traders (COT) data published by the Commodities Futures Trading Commission (CFTC).
The latest COT data is updated through Tuesday January 11th 2022 and shows a quick view of how large traders (for-profit speculators and commercial entities) were positioned in the futures markets.
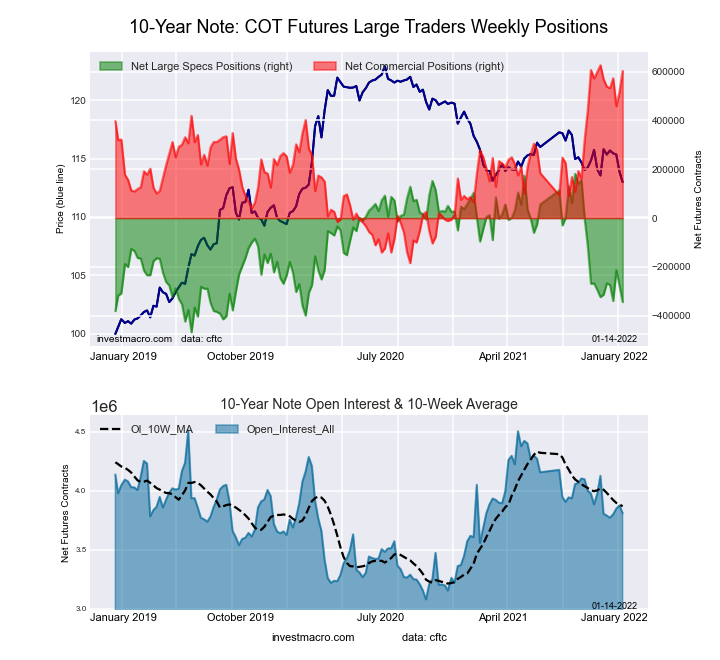
Highlighting the COT bonds data is the positioning in the 10-Year Bond futures market. The 10-Year saw the largest decline of speculator bets this week (-66,916 contracts) in all the markets we cover and the 10-Year futures have now had higher bearish bets in four out of the past five weeks. The speculator’s position is at the lowest level in 100 weeks, dating back to February 11th of 2020 and is now extremely bearish with a 19.1 percent strength score (current level compared to past three years of data, above 80% is bullish extreme, below 20% is bearish extreme) while the commercials are bullish extreme with a 97.1 percent score. The small traders are on the speculator’s side with a bearish extreme score of 18.4 percent. Only time will tell if this represents a turning point for 10-Year bonds but with all three trader groups in extreme positioning, it is definitely a market to watch.
The contracts with higher speculator bets this week were the 2-Year Bond (9,818 contracts), Eurodollar (28,727 contracts), FedFunds (17,737 contracts) and the 5-Year (103,218 contracts) while decreasing bets for the week were seen in 10-Year (-66,916 contracts), Ultra 10-Year (-2,361 contracts), Long US Bond (-15,488 contracts) and the Ultra US Bond (-19,930 contracts).
| Jan-11-2022 | OI | OI-Index | Spec-Net | Spec-Index | Com-Net | COM-Index | Smalls-Net | Smalls-Index |
|---|---|---|---|---|---|---|---|---|
| Eurodollar | 11,368,090 | 52 | -1,780,329 | 1 | 2,166,311 | 99 | -385,982 | 22 |
| FedFunds | 1,534,232 | 40 | -67,554 | 31 | 70,020 | 68 | -2,466 | 55 |
| 2-Year | 2,017,016 | 9 | 51,817 | 93 | 16,145 | 23 | -67,962 | 2 |
| Long T-Bond | 1,214,729 | 51 | -65,038 | 70 | 69,672 | 42 | -4,634 | 49 |
| 10-Year | 3,809,163 | 51 | -343,839 | 19 | 602,618 | 97 | -258,779 | 18 |
| 5-Year | 3,830,246 | 39 | -299,657 | 28 | 560,198 | 87 | -260,541 | 10 |
Free Reports:
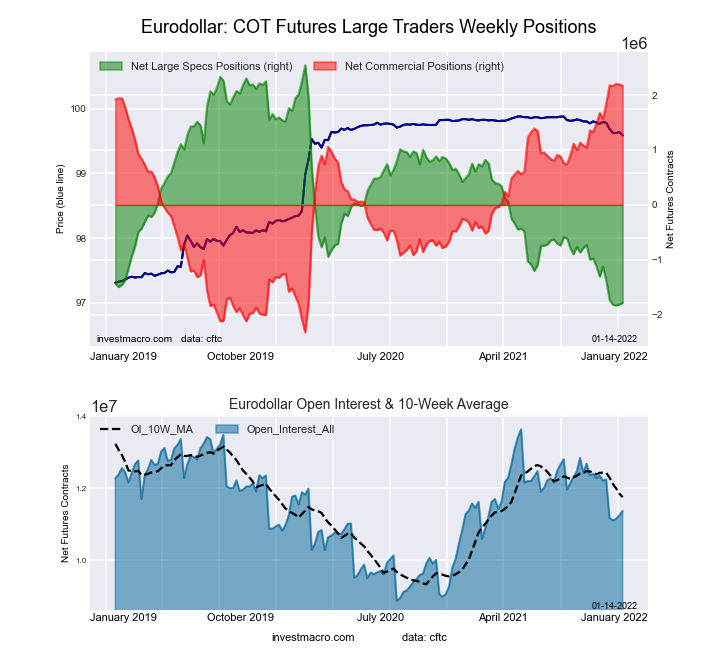
This week’s current strength score (the trader positioning range over the past three years, measured from 0 to 100) shows the speculators are currently Bearish-Extreme with a score of 1.1 percent. The commercials are Bullish-Extreme with a score of 99.2 percent and the small traders (not shown in chart) are Bearish with a score of 22.2 percent.
| 3-Month Eurodollars Statistics | SPECULATORS | COMMERCIALS | SMALL TRADERS |
| – Percent of Open Interest Longs: | 7.2 | 72.1 | 3.8 |
| – Percent of Open Interest Shorts: | 22.8 | 53.0 | 7.2 |
| – Net Position: | -1,780,329 | 2,166,311 | -385,982 |
| – Gross Longs: | 815,291 | 8,192,154 | 427,028 |
| – Gross Shorts: | 2,595,620 | 6,025,843 | 813,010 |
| – Long to Short Ratio: | 0.3 to 1 | 1.4 to 1 | 0.5 to 1 |
| NET POSITION TREND: | |||
| – Strength Index Score (3 Year Range Pct): | 1.1 | 99.2 | 22.2 |
| – Strength Index Reading (3 Year Range): | Bearish-Extreme | Bullish-Extreme | Bearish |
| NET POSITION MOVEMENT INDEX: | |||
| – 6-Week Change in Strength Index: | -15.1 | 13.2 | 12.9 |
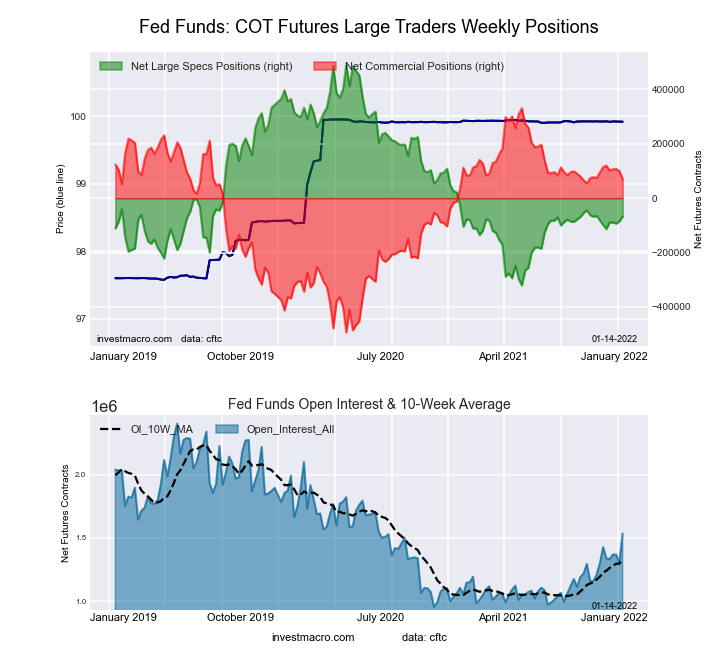
This week’s current strength score (the trader positioning range over the past three years, measured from 0 to 100) shows the speculators are currently Bearish with a score of 31.3 percent. The commercials are Bullish with a score of 68.4 percent and the small traders (not shown in chart) are Bullish with a score of 55.2 percent.
| 30-Day Federal Funds Statistics | SPECULATORS | COMMERCIALS | SMALL TRADERS |
| – Percent of Open Interest Longs: | 3.7 | 80.6 | 2.2 |
| – Percent of Open Interest Shorts: | 8.1 | 76.0 | 2.4 |
| – Net Position: | -67,554 | 70,020 | -2,466 |
| – Gross Longs: | 57,362 | 1,236,319 | 33,966 |
| – Gross Shorts: | 124,916 | 1,166,299 | 36,432 |
| – Long to Short Ratio: | 0.5 to 1 | 1.1 to 1 | 0.9 to 1 |
| NET POSITION TREND: | |||
| – Strength Index Score (3 Year Range Pct): | 31.3 | 68.4 | 55.2 |
| – Strength Index Reading (3 Year Range): | Bearish | Bullish | Bullish |
| NET POSITION MOVEMENT INDEX: | |||
| – 6-Week Change in Strength Index: | 3.8 | -5.4 | 32.9 |
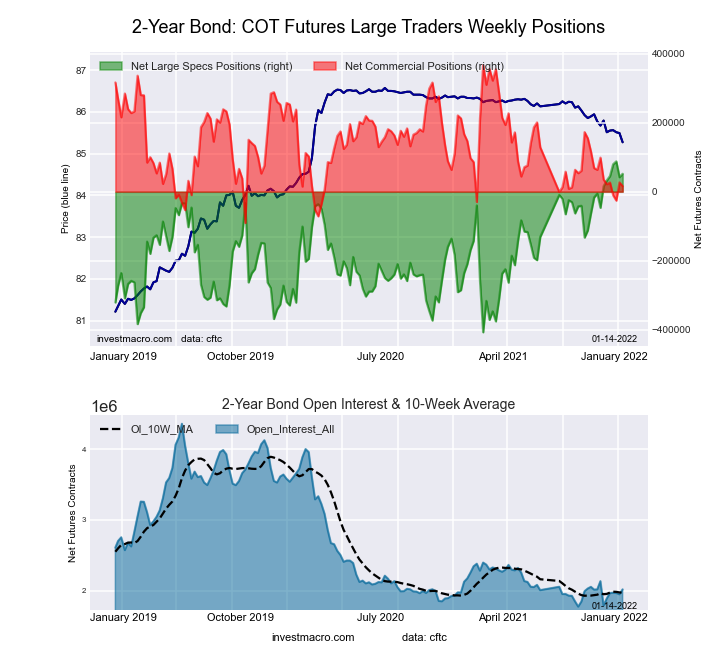
This week’s current strength score (the trader positioning range over the past three years, measured from 0 to 100) shows the speculators are currently Bullish-Extreme with a score of 92.7 percent. The commercials are Bearish with a score of 23.4 percent and the small traders (not shown in chart) are Bearish-Extreme with a score of 2.0 percent.
| 2-Year Treasury Note Statistics | SPECULATORS | COMMERCIALS | SMALL TRADERS |
| – Percent of Open Interest Longs: | 19.7 | 69.9 | 6.2 |
| – Percent of Open Interest Shorts: | 17.1 | 69.1 | 9.6 |
| – Net Position: | 51,817 | 16,145 | -67,962 |
| – Gross Longs: | 396,495 | 1,410,443 | 125,294 |
| – Gross Shorts: | 344,678 | 1,394,298 | 193,256 |
| – Long to Short Ratio: | 1.2 to 1 | 1.0 to 1 | 0.6 to 1 |
| NET POSITION TREND: | |||
| – Strength Index Score (3 Year Range Pct): | 92.7 | 23.4 | 2.0 |
| – Strength Index Reading (3 Year Range): | Bullish-Extreme | Bearish | Bearish-Extreme |
| NET POSITION MOVEMENT INDEX: | |||
| – 6-Week Change in Strength Index: | 7.3 | -4.1 | -8.8 |
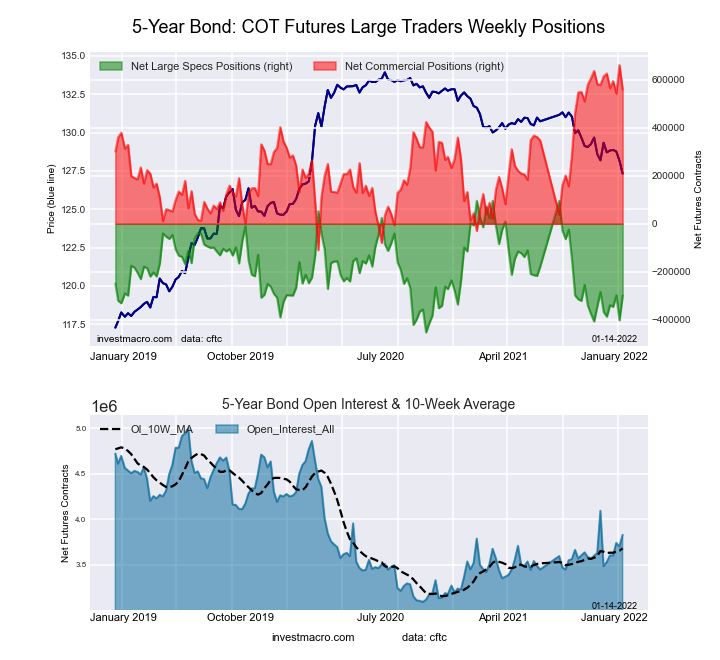
This week’s current strength score (the trader positioning range over the past three years, measured from 0 to 100) shows the speculators are currently Bearish with a score of 27.9 percent. The commercials are Bullish-Extreme with a score of 86.9 percent and the small traders (not shown in chart) are Bearish-Extreme with a score of 9.5 percent.
| 5-Year Treasury Note Statistics | SPECULATORS | COMMERCIALS | SMALL TRADERS |
| – Percent of Open Interest Longs: | 8.2 | 81.7 | 6.7 |
| – Percent of Open Interest Shorts: | 16.0 | 67.1 | 13.5 |
| – Net Position: | -299,657 | 560,198 | -260,541 |
| – Gross Longs: | 314,572 | 3,129,134 | 254,922 |
| – Gross Shorts: | 614,229 | 2,568,936 | 515,463 |
| – Long to Short Ratio: | 0.5 to 1 | 1.2 to 1 | 0.5 to 1 |
| NET POSITION TREND: | |||
| – Strength Index Score (3 Year Range Pct): | 27.9 | 86.9 | 9.5 |
| – Strength Index Reading (3 Year Range): | Bearish | Bullish-Extreme | Bearish-Extreme |
| NET POSITION MOVEMENT INDEX: | |||
| – 6-Week Change in Strength Index: | 12.4 | -7.0 | -3.8 |
This week’s current strength score (the trader positioning range over the past three years, measured from 0 to 100) shows the speculators are currently Bearish-Extreme with a score of 19.1 percent. The commercials are Bullish-Extreme with a score of 97.1 percent and the small traders (not shown in chart) are Bearish-Extreme with a score of 18.4 percent.
| 10-Year Treasury Note Statistics | SPECULATORS | COMMERCIALS | SMALL TRADERS |
| – Percent of Open Interest Longs: | 10.9 | 77.8 | 8.3 |
| – Percent of Open Interest Shorts: | 19.9 | 62.0 | 15.1 |
| – Net Position: | -343,839 | 602,618 | -258,779 |
| – Gross Longs: | 413,462 | 2,964,259 | 315,565 |
| – Gross Shorts: | 757,301 | 2,361,641 | 574,344 |
| – Long to Short Ratio: | 0.5 to 1 | 1.3 to 1 | 0.5 to 1 |
| NET POSITION TREND: | |||
| – Strength Index Score (3 Year Range Pct): | 19.1 | 97.1 | 18.4 |
| – Strength Index Reading (3 Year Range): | Bearish-Extreme | Bullish-Extreme | Bearish-Extreme |
| NET POSITION MOVEMENT INDEX: | |||
| – 6-Week Change in Strength Index: | -4.7 | 4.3 | -1.0 |
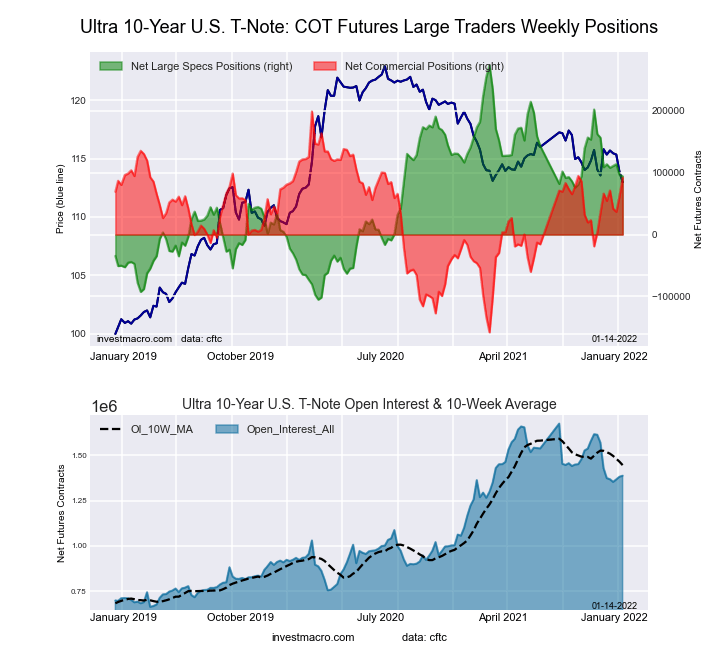
This week’s current strength score (the trader positioning range over the past three years, measured from 0 to 100) shows the speculators are currently Bullish with a score of 52.6 percent. The commercials are Bullish with a score of 70.1 percent and the small traders (not shown in chart) are Bearish-Extreme with a score of 3.4 percent.
| Ultra 10-Year Notes Statistics | SPECULATORS | COMMERCIALS | SMALL TRADERS |
| – Percent of Open Interest Longs: | 19.0 | 72.1 | 7.3 |
| – Percent of Open Interest Shorts: | 12.2 | 65.5 | 20.8 |
| – Net Position: | 94,244 | 92,061 | -186,305 |
| – Gross Longs: | 263,501 | 1,000,359 | 101,920 |
| – Gross Shorts: | 169,257 | 908,298 | 288,225 |
| – Long to Short Ratio: | 1.6 to 1 | 1.1 to 1 | 0.4 to 1 |
| NET POSITION TREND: | |||
| – Strength Index Score (3 Year Range Pct): | 52.6 | 70.1 | 3.4 |
| – Strength Index Reading (3 Year Range): | Bullish | Bullish | Bearish-Extreme |
| NET POSITION MOVEMENT INDEX: | |||
| – 6-Week Change in Strength Index: | -3.9 | 7.3 | -6.7 |
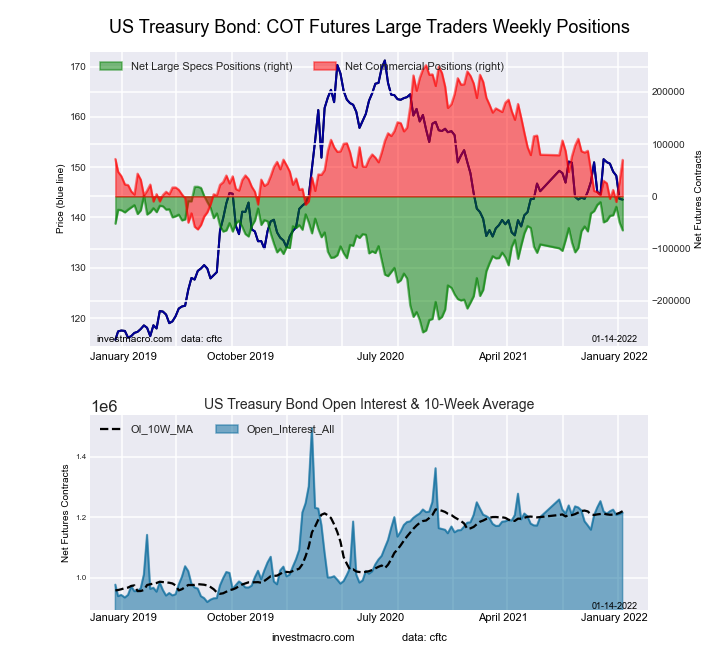
This week’s current strength score (the trader positioning range over the past three years, measured from 0 to 100) shows the speculators are currently Bullish with a score of 70.1 percent. The commercials are Bearish with a score of 42.3 percent and the small traders (not shown in chart) are Bearish with a score of 48.9 percent.
| US Treasury Bonds Statistics | SPECULATORS | COMMERCIALS | SMALL TRADERS |
| – Percent of Open Interest Longs: | 12.2 | 71.9 | 13.9 |
| – Percent of Open Interest Shorts: | 17.5 | 66.2 | 14.3 |
| – Net Position: | -65,038 | 69,672 | -4,634 |
| – Gross Longs: | 147,857 | 873,843 | 169,452 |
| – Gross Shorts: | 212,895 | 804,171 | 174,086 |
| – Long to Short Ratio: | 0.7 to 1 | 1.1 to 1 | 1.0 to 1 |
| NET POSITION TREND: | |||
| – Strength Index Score (3 Year Range Pct): | 70.1 | 42.3 | 48.9 |
| – Strength Index Reading (3 Year Range): | Bullish | Bearish | Bearish |
| NET POSITION MOVEMENT INDEX: | |||
| – 6-Week Change in Strength Index: | -5.5 | 12.8 | -19.6 |
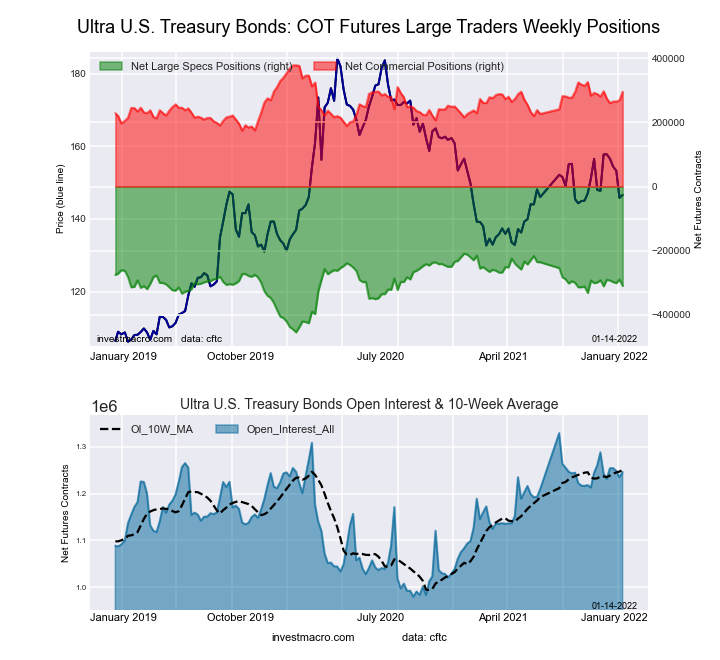
This week’s current strength score (the trader positioning range over the past three years, measured from 0 to 100) shows the speculators are currently Bullish with a score of 58.9 percent. The commercials are Bullish with a score of 59.3 percent and the small traders (not shown in chart) are Bearish with a score of 38.8 percent.
| Ultra US Treasury Bonds Statistics | SPECULATORS | COMMERCIALS | SMALL TRADERS |
| – Percent of Open Interest Longs: | 6.1 | 81.1 | 11.9 |
| – Percent of Open Interest Shorts: | 31.0 | 57.4 | 10.8 |
| – Net Position: | -309,531 | 294,877 | 14,654 |
| – Gross Longs: | 76,368 | 1,009,930 | 148,602 |
| – Gross Shorts: | 385,899 | 715,053 | 133,948 |
| – Long to Short Ratio: | 0.2 to 1 | 1.4 to 1 | 1.1 to 1 |
| NET POSITION TREND: | |||
| – Strength Index Score (3 Year Range Pct): | 58.9 | 59.3 | 38.8 |
| – Strength Index Reading (3 Year Range): | Bullish | Bullish | Bearish |
| NET POSITION MOVEMENT INDEX: | |||
| – 6-Week Change in Strength Index: | 0.4 | -0.9 | 0.6 |
Article By InvestMacro – Receive our weekly COT Reports by Email
*COT Report: The COT data, released weekly to the public each Friday, is updated through the most recent Tuesday (data is 3 days old) and shows a quick view of how large speculators or non-commercials (for-profit traders) were positioned in the futures markets.
The CFTC categorizes trader positions according to commercial hedgers (traders who use futures contracts for hedging as part of the business), non-commercials (large traders who speculate to realize trading profits) and nonreportable traders (usually small traders/speculators) as well as their open interest (contracts open in the market at time of reporting).See CFTC criteria here.
By Jeffrey Young, Georgia Institute of Technology You’ve probably heard artificial intelligence models described as…
Source: Barry Dawes (7/23/26) Barry Dawes of Martin Place Securities shares his analysis of the…
By JustMarkets The US stock indices ended Thursday’s session with a notable decline amid a…
By Analytical Department RoboForex USD/JPY soared to 163.81 on Friday, marking a new 40-year high.…
By JustMarkets The US equities ended Wednesday’s session lower amid investor caution ahead of the…
By Analytical Department RoboForex EUR/USD rose to 1.1429 on Thursday, with the US dollar continuing…
This website uses cookies.