By InvestMacro | COT | Data Tables | COT Leaders | Downloads | COT Newsletter
Here are the latest charts and statistics for the Commitment of Traders (COT) data published by the Commodities Futures Trading Commission (CFTC).
The latest COT data is updated through Tuesday November 16th 2021 and shows a quick view of how large traders (for-profit speculators and commercial entities) were positioned in the futures markets.
Highlighting the COT Soft Commodities data this week is the gains almost across the board in these markets. This week’s positive data changes in nominal speculator contracts saw soft commodities take five out of the top seven places of all the markets we track. Soybean Meal speculators added 28,354 contracts to their standings this week while Corn specs added 23,888 contracts, Soybeans bets rose by 19,333 contracts, Wheat wagers increased by 17,558 contracts and Sugar tacked on 15,358 contracts to its overall net position.
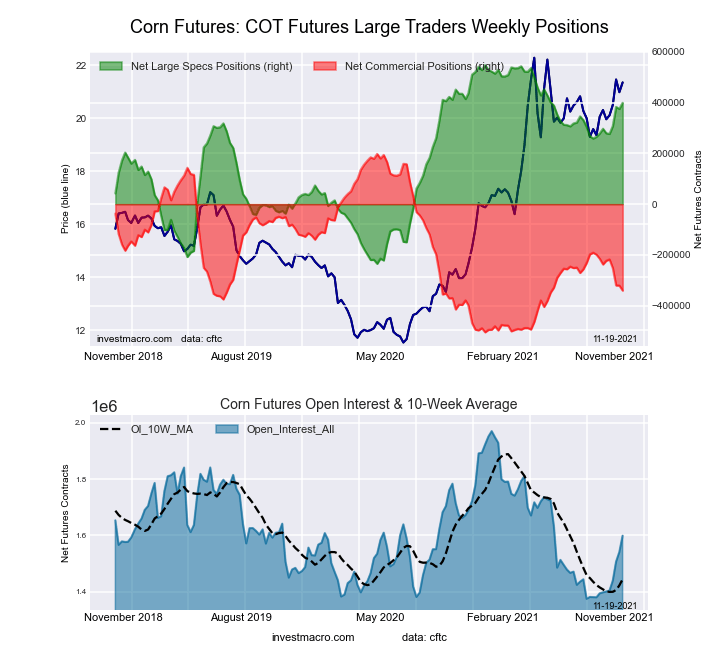
Corn positions, in particular, are seeing rising bullish sentiment and have jumped by a total of 122,157 contracts over just the past four weeks. The Corn speculative net positions is now at its highest level of the past twenty-two weeks, dating back to June 15th.
| Nov-16-2021 | OI | OI-Index | Spec-Net | Spec-Index | Com-Net | COM-Index | Smalls-Net | Smalls-Index |
|---|---|---|---|---|---|---|---|---|
| WTI Crude | 2,057,633 | 18 | 415,785 | 44 | -470,324 | 41 | 54,539 | 92 |
| Gold | 612,612 | 54 | 259,780 | 73 | -287,539 | 27 | 27,759 | 48 |
| Silver | 152,404 | 18 | 45,625 | 68 | -66,148 | 34 | 20,523 | 61 |
| Copper | 208,066 | 32 | 20,337 | 57 | -30,805 | 38 | 10,468 | 86 |
| Palladium | 11,840 | 24 | -2,038 | 7 | 1,976 | 91 | 62 | 48 |
| Platinum | 62,284 | 26 | 21,013 | 33 | -28,225 | 69 | 7,212 | 63 |
| Natural Gas | 1,308,708 | 45 | -144,620 | 35 | 98,415 | 62 | 46,205 | 96 |
| Brent | 199,930 | 39 | -12,900 | 98 | 7,412 | 0 | 5,488 | 94 |
| Heating Oil | 380,887 | 26 | 17,029 | 67 | -37,010 | 32 | 19,981 | 68 |
| Soybeans | 662,972 | 13 | 46,917 | 42 | -4,927 | 65 | -41,990 | 2 |
| Corn | 1,598,926 | 38 | 399,186 | 81 | -340,672 | 23 | -58,514 | 9 |
| Coffee | 286,343 | 48 | 66,081 | 97 | -70,075 | 5 | 3,994 | 16 |
| Sugar | 906,385 | 21 | 227,389 | 83 | -276,185 | 16 | 48,796 | 68 |
| Wheat | 427,786 | 49 | 36,761 | 78 | -27,999 | 14 | -8,762 | 60 |
Free Reports:
This week’s current strength score (the trader positioning range over the past three years, measured from 0 to 100) shows the speculators are currently Bullish-Extreme with a score of 81.0 percent. The commercials are Bearish with a score of 23.4 percent and the small traders (not shown in chart) are Bearish-Extreme with a score of 9.4 percent.
| CORN Futures Statistics | SPECULATORS | COMMERCIALS | SMALL TRADERS |
| – Percent of Open Interest Longs: | 31.6 | 45.3 | 8.5 |
| – Percent of Open Interest Shorts: | 6.6 | 66.6 | 12.1 |
| – Net Position: | 399,186 | -340,672 | -58,514 |
| – Gross Longs: | 504,851 | 724,785 | 135,589 |
| – Gross Shorts: | 105,665 | 1,065,457 | 194,103 |
| – Long to Short Ratio: | 4.8 to 1 | 0.7 to 1 | 0.7 to 1 |
| NET POSITION TREND: | |||
| – COT Index Score (3 Year Range Pct): | 81.0 | 23.4 | 9.4 |
| – COT Index Reading (3 Year Range): | Bullish-Extreme | Bearish | Bearish-Extreme |
| NET POSITION MOVEMENT INDEX: | |||
| – 6-Week Change in Strength Index: | 13.1 | -14.7 | 0.5 |
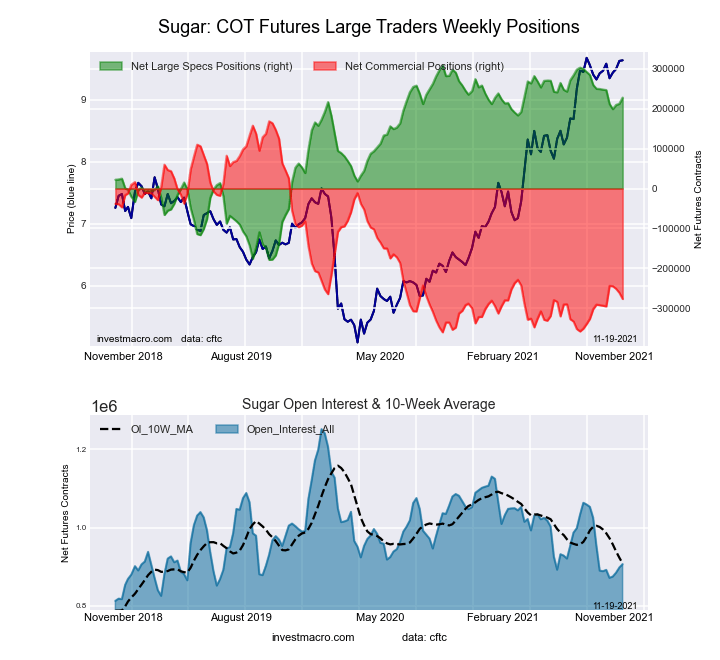
This week’s current strength score (the trader positioning range over the past three years, measured from 0 to 100) shows the speculators are currently Bullish-Extreme with a score of 83.3 percent. The commercials are Bearish-Extreme with a score of 15.8 percent and the small traders (not shown in chart) are Bullish with a score of 68.2 percent.
| SUGAR Futures Statistics | SPECULATORS | COMMERCIALS | SMALL TRADERS |
| – Percent of Open Interest Longs: | 30.8 | 42.8 | 10.7 |
| – Percent of Open Interest Shorts: | 5.7 | 73.3 | 5.3 |
| – Net Position: | 227,389 | -276,185 | 48,796 |
| – Gross Longs: | 278,893 | 388,334 | 96,952 |
| – Gross Shorts: | 51,504 | 664,519 | 48,156 |
| – Long to Short Ratio: | 5.4 to 1 | 0.6 to 1 | 2.0 to 1 |
| NET POSITION TREND: | |||
| – COT Index Score (3 Year Range Pct): | 83.3 | 15.8 | 68.2 |
| – COT Index Reading (3 Year Range): | Bullish-Extreme | Bearish-Extreme | Bullish |
| NET POSITION MOVEMENT INDEX: | |||
| – 6-Week Change in Strength Index: | -4.1 | 3.2 | 3.8 |
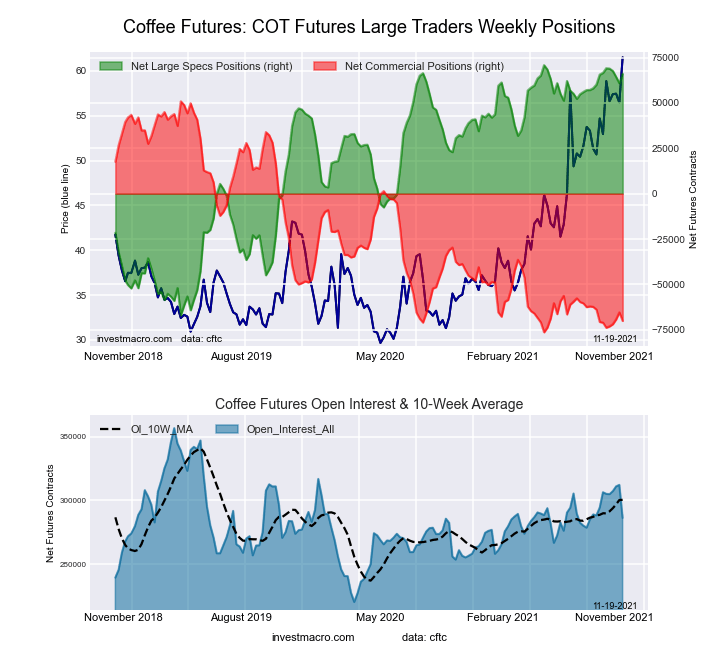
This week’s current strength score (the trader positioning range over the past three years, measured from 0 to 100) shows the speculators are currently Bullish-Extreme with a score of 96.6 percent. The commercials are Bearish-Extreme with a score of 4.9 percent and the small traders (not shown in chart) are Bearish-Extreme with a score of 16.0 percent.
| COFFEE Futures Statistics | SPECULATORS | COMMERCIALS | SMALL TRADERS |
| – Percent of Open Interest Longs: | 27.8 | 42.8 | 3.9 |
| – Percent of Open Interest Shorts: | 4.7 | 67.3 | 2.6 |
| – Net Position: | 66,081 | -70,075 | 3,994 |
| – Gross Longs: | 79,550 | 122,594 | 11,308 |
| – Gross Shorts: | 13,469 | 192,669 | 7,314 |
| – Long to Short Ratio: | 5.9 to 1 | 0.6 to 1 | 1.5 to 1 |
| NET POSITION TREND: | |||
| – COT Index Score (3 Year Range Pct): | 96.6 | 4.9 | 16.0 |
| – COT Index Reading (3 Year Range): | Bullish-Extreme | Bearish-Extreme | Bearish-Extreme |
| NET POSITION MOVEMENT INDEX: | |||
| – 6-Week Change in Strength Index: | -0.4 | 0.7 | -3.2 |
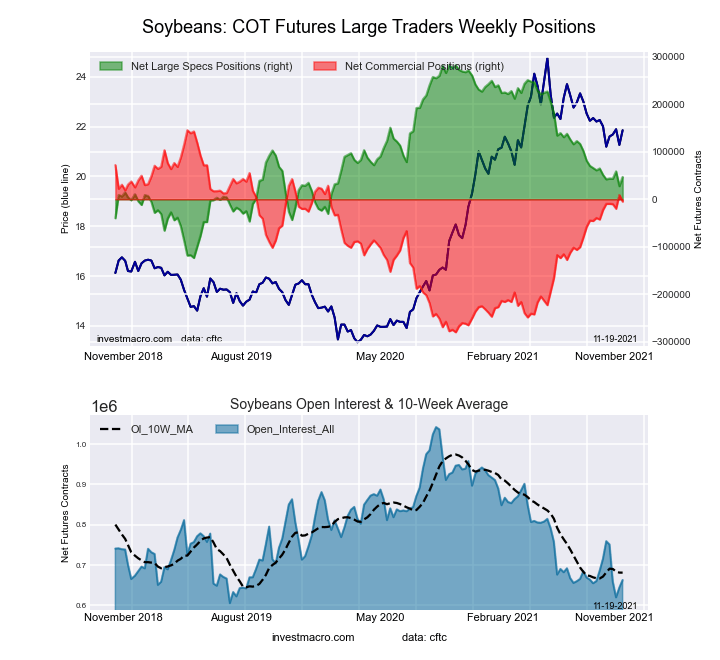
This week’s current strength score (the trader positioning range over the past three years, measured from 0 to 100) shows the speculators are currently Bearish with a score of 42.0 percent. The commercials are Bullish with a score of 64.7 percent and the small traders (not shown in chart) are Bearish-Extreme with a score of 2.0 percent.
| SOYBEANS Futures Statistics | SPECULATORS | COMMERCIALS | SMALL TRADERS |
| – Percent of Open Interest Longs: | 20.0 | 59.0 | 6.9 |
| – Percent of Open Interest Shorts: | 12.9 | 59.8 | 13.3 |
| – Net Position: | 46,917 | -4,927 | -41,990 |
| – Gross Longs: | 132,364 | 391,217 | 45,975 |
| – Gross Shorts: | 85,447 | 396,144 | 87,965 |
| – Long to Short Ratio: | 1.5 to 1 | 1.0 to 1 | 0.5 to 1 |
| NET POSITION TREND: | |||
| – COT Index Score (3 Year Range Pct): | 42.0 | 64.7 | 2.0 |
| – COT Index Reading (3 Year Range): | Bearish | Bullish | Bearish-Extreme |
| NET POSITION MOVEMENT INDEX: | |||
| – 6-Week Change in Strength Index: | -1.1 | 4.2 | -21.9 |
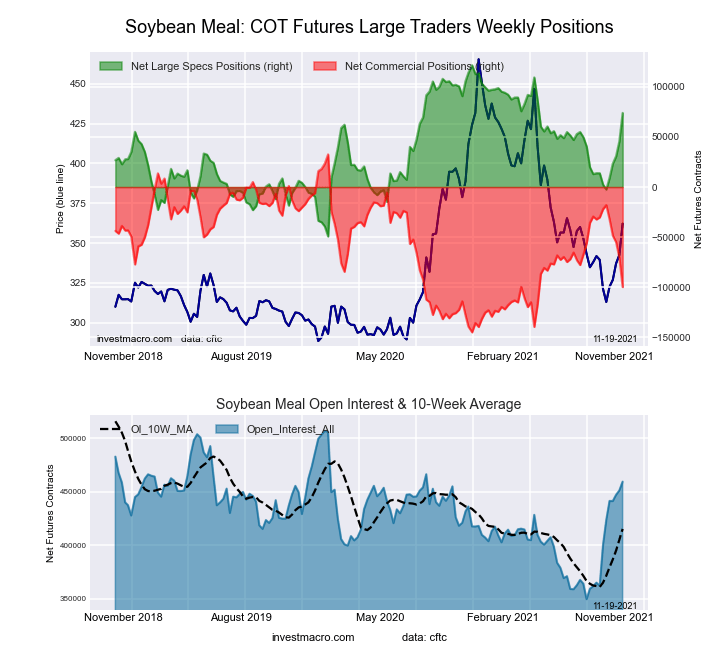
This week’s current strength score (the trader positioning range over the past three years, measured from 0 to 100) shows the speculators are currently Bullish with a score of 72.1 percent. The commercials are Bearish with a score of 25.4 percent and the small traders (not shown in chart) are Bullish with a score of 74.3 percent.
| SOYBEAN MEAL Futures Statistics | SPECULATORS | COMMERCIALS | SMALL TRADERS |
| – Percent of Open Interest Longs: | 22.6 | 44.2 | 11.9 |
| – Percent of Open Interest Shorts: | 6.5 | 66.0 | 6.3 |
| – Net Position: | 73,989 | -99,866 | 25,877 |
| – Gross Longs: | 103,903 | 203,239 | 54,734 |
| – Gross Shorts: | 29,914 | 303,105 | 28,857 |
| – Long to Short Ratio: | 3.5 to 1 | 0.7 to 1 | 1.9 to 1 |
| NET POSITION TREND: | |||
| – COT Index Score (3 Year Range Pct): | 72.1 | 25.4 | 74.3 |
| – COT Index Reading (3 Year Range): | Bullish | Bearish | Bullish |
| NET POSITION MOVEMENT INDEX: | |||
| – 6-Week Change in Strength Index: | 41.8 | -43.8 | 24.8 |
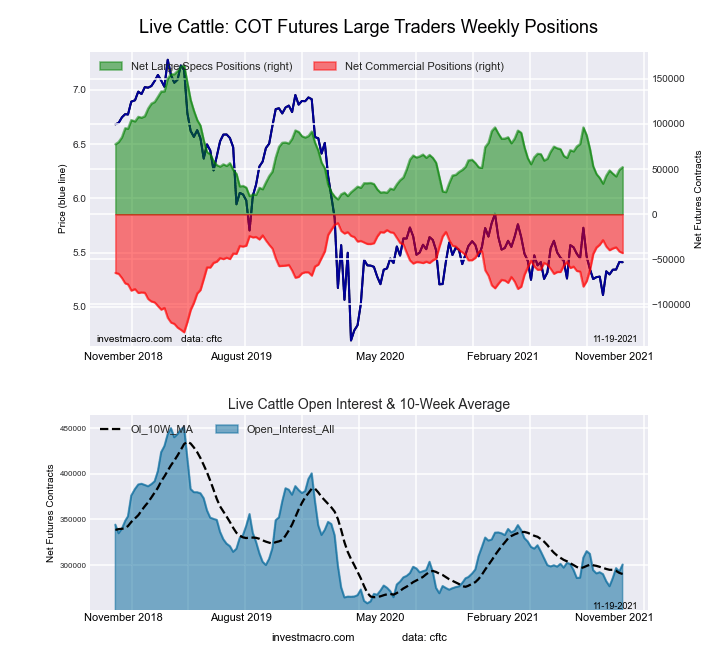
This week’s current strength score (the trader positioning range over the past three years, measured from 0 to 100) shows the speculators are currently Bearish with a score of 24.1 percent. The commercials are Bullish with a score of 72.5 percent and the small traders (not shown in chart) are Bullish with a score of 64.7 percent.
| LIVE CATTLE Futures Statistics | SPECULATORS | COMMERCIALS | SMALL TRADERS |
| – Percent of Open Interest Longs: | 34.1 | 39.4 | 9.9 |
| – Percent of Open Interest Shorts: | 16.7 | 53.7 | 13.0 |
| – Net Position: | 52,226 | -43,034 | -9,192 |
| – Gross Longs: | 102,550 | 118,410 | 29,742 |
| – Gross Shorts: | 50,324 | 161,444 | 38,934 |
| – Long to Short Ratio: | 2.0 to 1 | 0.7 to 1 | 0.8 to 1 |
| NET POSITION TREND: | |||
| – COT Index Score (3 Year Range Pct): | 24.1 | 72.5 | 64.7 |
| – COT Index Reading (3 Year Range): | Bearish | Bullish | Bullish |
| NET POSITION MOVEMENT INDEX: | |||
| – 6-Week Change in Strength Index: | 12.4 | -11.8 | -9.9 |
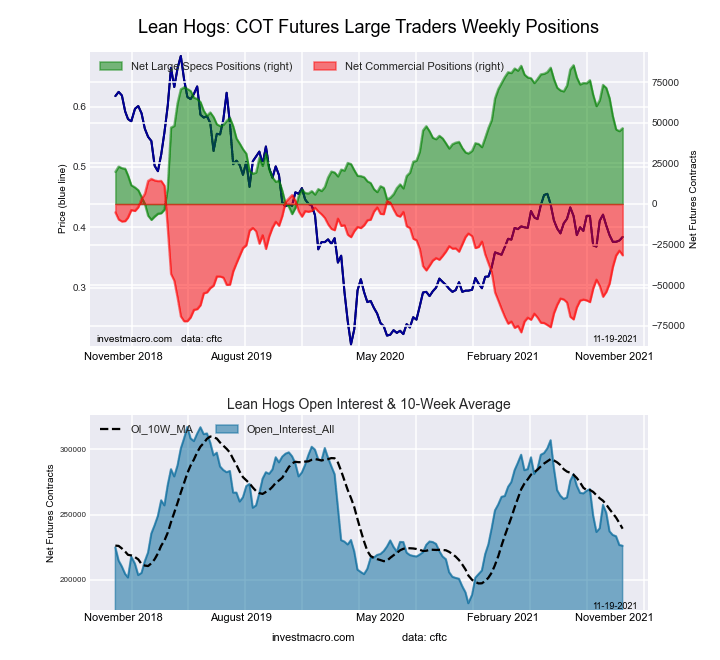
This week’s current strength score (the trader positioning range over the past three years, measured from 0 to 100) shows the speculators are currently Bullish with a score of 59.3 percent. The commercials are Bullish with a score of 50.2 percent and the small traders (not shown in chart) are Bearish-Extreme with a score of 10.2 percent.
| LEAN HOGS Futures Statistics | SPECULATORS | COMMERCIALS | SMALL TRADERS |
| – Percent of Open Interest Longs: | 39.1 | 34.9 | 7.8 |
| – Percent of Open Interest Shorts: | 18.4 | 48.8 | 14.4 |
| – Net Position: | 46,764 | -31,629 | -15,135 |
| – Gross Longs: | 88,455 | 78,855 | 17,531 |
| – Gross Shorts: | 41,691 | 110,484 | 32,666 |
| – Long to Short Ratio: | 2.1 to 1 | 0.7 to 1 | 0.5 to 1 |
| NET POSITION TREND: | |||
| – COT Index Score (3 Year Range Pct): | 59.3 | 50.2 | 10.2 |
| – COT Index Reading (3 Year Range): | Bullish | Bullish | Bearish-Extreme |
| NET POSITION MOVEMENT INDEX: | |||
| – 6-Week Change in Strength Index: | -28.0 | 27.0 | 5.2 |
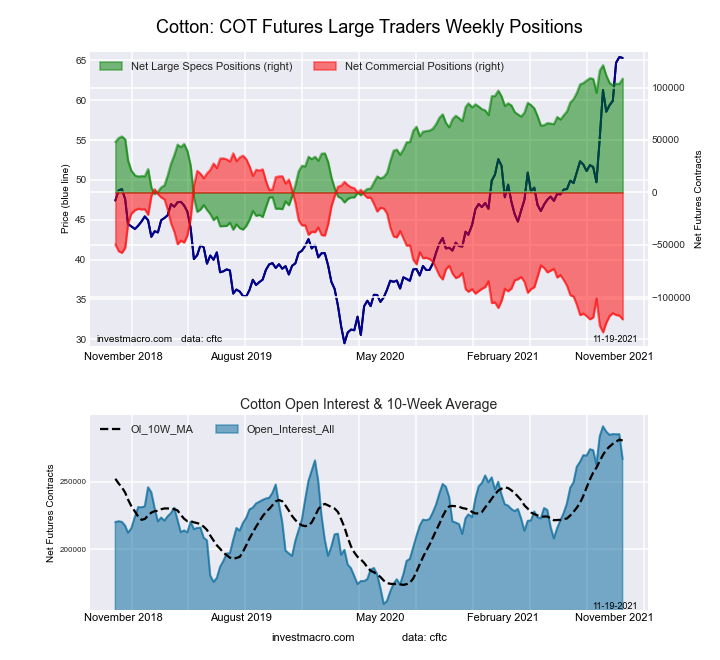
This week’s current strength score (the trader positioning range over the past three years, measured from 0 to 100) shows the speculators are currently Bullish-Extreme with a score of 91.8 percent. The commercials are Bearish-Extreme with a score of 7.2 percent and the small traders (not shown in chart) are Bullish-Extreme with a score of 91.6 percent.
| COTTON Futures Statistics | SPECULATORS | COMMERCIALS | SMALL TRADERS |
| – Percent of Open Interest Longs: | 44.8 | 35.3 | 8.1 |
| – Percent of Open Interest Shorts: | 4.1 | 80.6 | 3.4 |
| – Net Position: | 108,441 | -120,945 | 12,504 |
| – Gross Longs: | 119,403 | 94,055 | 21,485 |
| – Gross Shorts: | 10,962 | 215,000 | 8,981 |
| – Long to Short Ratio: | 10.9 to 1 | 0.4 to 1 | 2.4 to 1 |
| NET POSITION TREND: | |||
| – COT Index Score (3 Year Range Pct): | 91.8 | 7.2 | 91.6 |
| – COT Index Reading (3 Year Range): | Bullish-Extreme | Bearish-Extreme | Bullish-Extreme |
| NET POSITION MOVEMENT INDEX: | |||
| – 6-Week Change in Strength Index: | -8.2 | 7.2 | 3.2 |
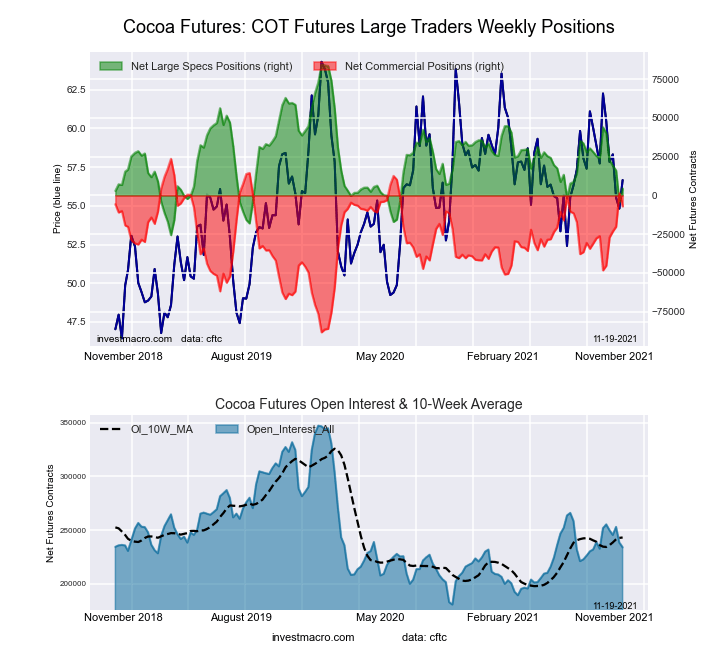
This week’s current strength score (the trader positioning range over the past three years, measured from 0 to 100) shows the speculators are currently Bearish with a score of 27.4 percent. The commercials are Bullish with a score of 72.6 percent and the small traders (not shown in chart) are Bearish with a score of 37.3 percent.
| COCOA Futures Statistics | SPECULATORS | COMMERCIALS | SMALL TRADERS |
| – Percent of Open Interest Longs: | 26.9 | 53.3 | 4.7 |
| – Percent of Open Interest Shorts: | 25.0 | 56.3 | 3.6 |
| – Net Position: | 4,521 | -7,053 | 2,532 |
| – Gross Longs: | 63,037 | 124,699 | 10,926 |
| – Gross Shorts: | 58,516 | 131,752 | 8,394 |
| – Long to Short Ratio: | 1.1 to 1 | 0.9 to 1 | 1.3 to 1 |
| NET POSITION TREND: | |||
| – COT Index Score (3 Year Range Pct): | 27.4 | 72.6 | 37.3 |
| – COT Index Reading (3 Year Range): | Bearish | Bullish | Bearish |
| NET POSITION MOVEMENT INDEX: | |||
| – 6-Week Change in Strength Index: | -36.0 | 36.9 | -20.2 |
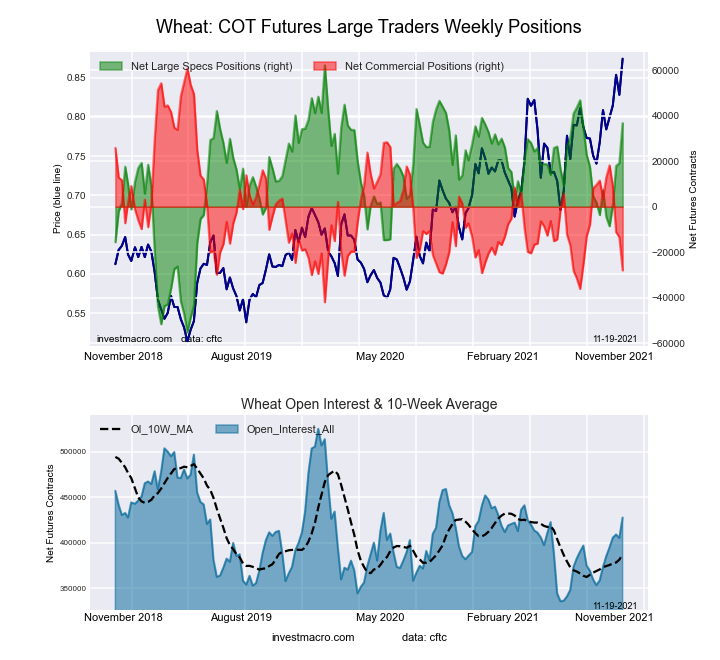
This week’s current strength score (the trader positioning range over the past three years, measured from 0 to 100) shows the speculators are currently Bullish with a score of 78.3 percent. The commercials are Bearish-Extreme with a score of 13.6 percent and the small traders (not shown in chart) are Bullish with a score of 59.7 percent.
| WHEAT Futures Statistics | SPECULATORS | COMMERCIALS | SMALL TRADERS |
| – Percent of Open Interest Longs: | 30.9 | 35.1 | 8.0 |
| – Percent of Open Interest Shorts: | 22.3 | 41.6 | 10.1 |
| – Net Position: | 36,761 | -27,999 | -8,762 |
| – Gross Longs: | 132,167 | 150,055 | 34,249 |
| – Gross Shorts: | 95,406 | 178,054 | 43,011 |
| – Long to Short Ratio: | 1.4 to 1 | 0.8 to 1 | 0.8 to 1 |
| NET POSITION TREND: | |||
| – COT Index Score (3 Year Range Pct): | 78.3 | 13.6 | 59.7 |
| – COT Index Reading (3 Year Range): | Bullish | Bearish-Extreme | Bullish |
| NET POSITION MOVEMENT INDEX: | |||
| – 6-Week Change in Strength Index: | 25.1 | -30.9 | 10.7 |
Article By InvestMacro – Receive our weekly COT Reports by Email
*COT Report: The COT data, released weekly to the public each Friday, is updated through the most recent Tuesday (data is 3 days old) and shows a quick view of how large speculators or non-commercials (for-profit traders) were positioned in the futures markets.
The CFTC categorizes trader positions according to commercial hedgers (traders who use futures contracts for hedging as part of the business), non-commercials (large traders who speculate to realize trading profits) and nonreportable traders (usually small traders/speculators) as well as their open interest (contracts open in the market at time of reporting).See CFTC criteria here.
By Analytical Department RoboForex Gold fell to 4,033 USD per ounce on Thursday, extending its…
By JustMarkets By the end of the day, the Dow Jones Index (US30) rose by…
By JustMarkets On Tuesday, the US stock indices finished the session in the green, supported…
By Analytical Department RoboForex GBP/USD rose to 1.3403 on Wednesday, with British politics taking centre…
By Analytical Department RoboForex USD/JPY ended Tuesday at 162.27, with the Japanese yen remaining near…
By JustMarkets On Friday, the Dow Jones Index (US30) rose by 0.29% (weekly: -0.36%). The…
This website uses cookies.