By InvestMacro | COT | Data Tables | COT Leaders | Downloads | COT Newsletter
Here are the latest charts and statistics for the Commitment of Traders (COT) data published by the Commodities Futures Trading Commission (CFTC).
The latest COT data is updated through Tuesday November 2nd 2021 and shows a quick view of how large traders (for-profit speculators and commercial entities) were positioned in the futures markets.
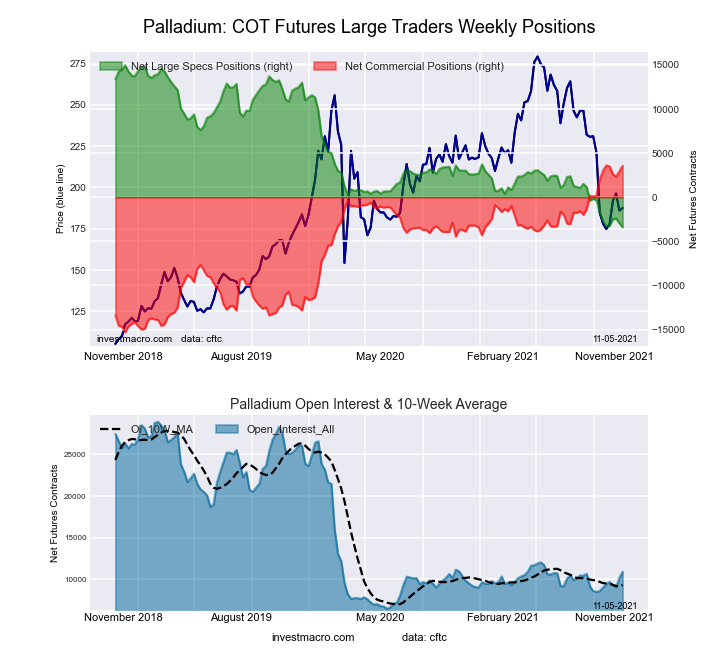
Highlighting this week’s COT metals data is the speculator’s bearishness in Palladium. The Palladium speculative position continues to see weakness and has fallen for eight out of the past twelve weeks. The overall position has now been in bearish territory for eleven straight weeks after dropping from bullish to bearish on August 24th. Palladium net spec positions are usually always in bullish territory with very few instances of net bearish levels in the data history. The current net position at -3,391 contracts marks the most bearish speculator level for Palladium on record, according to the CFTC data which goes back to 1986.
| Nov-02-2021 | OI | OI-Index | Spec-Net | Spec-Index | Com-Net | COM-Index | Smalls-Net | Smalls-Index |
|---|---|---|---|---|---|---|---|---|
| WTI Crude | 2,121,461 | 29 | 419,293 | 46 | -461,516 | 44 | 42,223 | 75 |
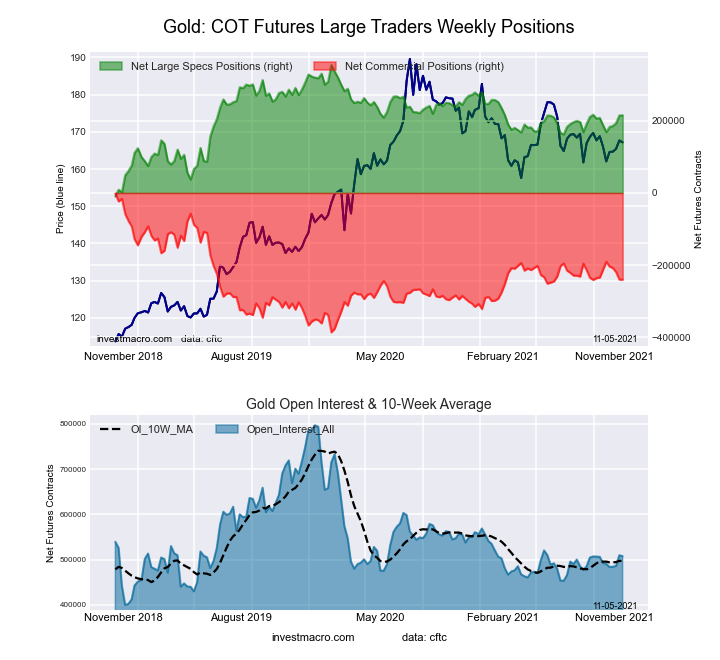
| Gold | 507,616 | 27 | 215,129 | 62 | -239,877 | 38 | 24,748 | 40 |
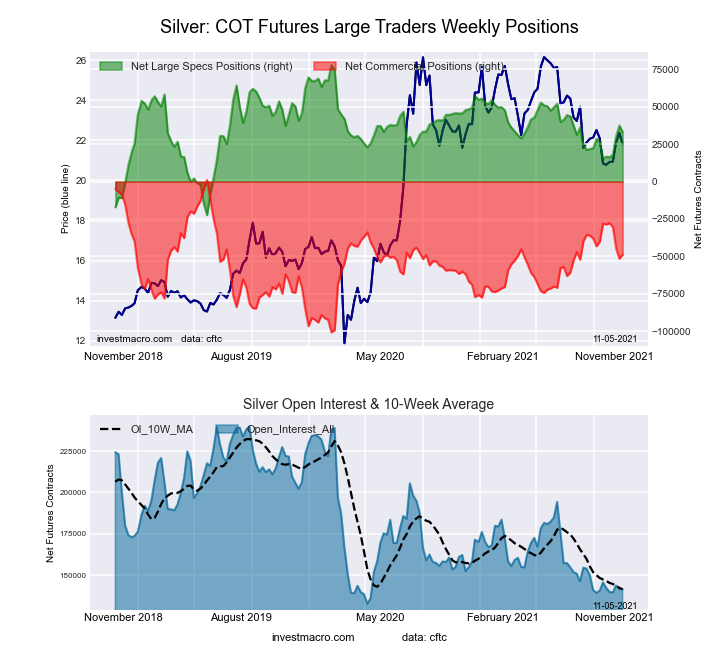
| Silver | 141,394 | 8 | 33,115 | 55 | -48,860 | 51 | 15,745 | 32 |
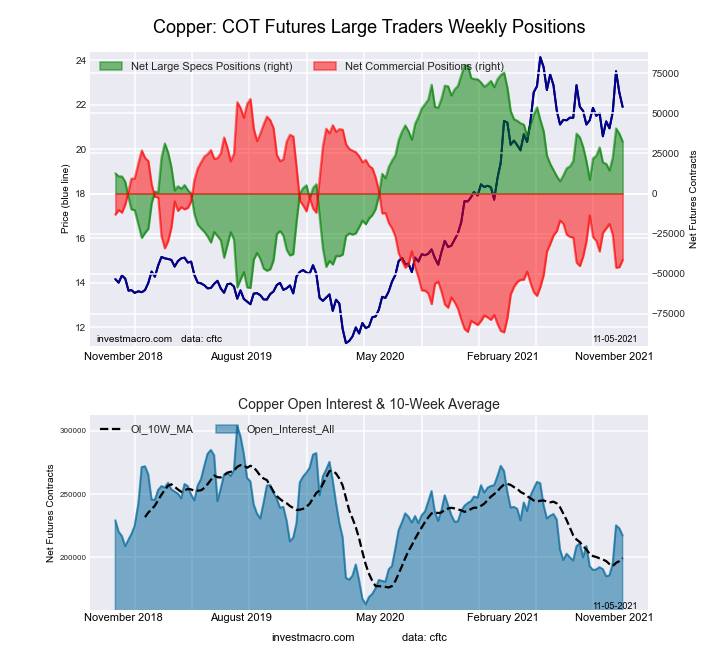
| Copper | 217,216 | 39 | 32,335 | 66 | -41,294 | 31 | 8,959 | 77 |
| Palladium | 10,926 | 20 | -3,391 | 0 | 3,574 | 100 | -183 | 34 |
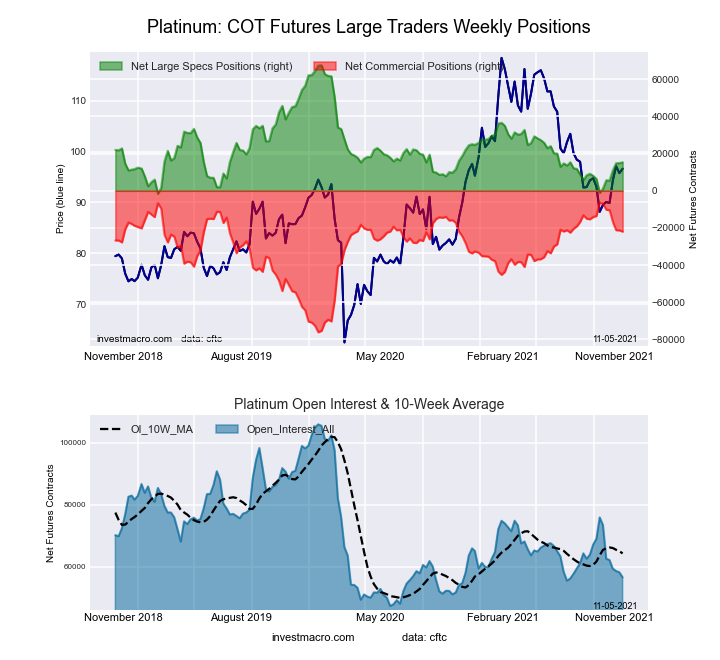
| Platinum | 56,508 | 16 | 15,364 | 25 | -21,964 | 78 | 6,600 | 54 |
| Natural Gas | 1,267,227 | 35 | -137,713 | 37 | 93,517 | 60 | 44,196 | 91 |
| Brent | 183,766 | 27 | -12,714 | 100 | 7,688 | 0 | 5,026 | 79 |
| Heating Oil | 426,636 | 66 | 22,384 | 75 | -45,844 | 22 | 23,460 | 80 |
| Soybeans | 620,172 | 3 | 58,756 | 45 | -19,885 | 61 | -38,871 | 7 |
| Corn | 1,506,602 | 22 | 383,109 | 79 | -320,385 | 26 | -62,724 | 7 |
| Coffee | 310,931 | 66 | 64,353 | 95 | -69,264 | 6 | 4,911 | 22 |
| Sugar | 884,507 | 21 | 209,061 | 80 | -250,849 | 21 | 41,788 | 60 |
| Wheat | 409,137 | 39 | 17,896 | 62 | -11,141 | 30 | -6,755 | 69 |
Free Reports:
This week’s current strength score (the trader positioning range over the past three years, measured from 0 to 100) shows the speculators are currently Bullish with a score of 61.8 percent. The commercials are Bearish with a score of 38.0 percent and the small traders (not shown in chart) are Bearish with a score of 40.2 percent.
| Gold Futures Statistics | SPECULATORS | COMMERCIALS | SMALL TRADERS |
| – Percent of Open Interest Longs: | 61.3 | 19.8 | 9.0 |
| – Percent of Open Interest Shorts: | 18.9 | 67.1 | 4.2 |
| – Net Position: | 215,129 | -239,877 | 24,748 |
| – Gross Longs: | 311,091 | 100,692 | 45,936 |
| – Gross Shorts: | 95,962 | 340,569 | 21,188 |
| – Long to Short Ratio: | 3.2 to 1 | 0.3 to 1 | 2.2 to 1 |
| NET POSITION TREND: | |||
| – COT Index Score (3 Year Range Pct): | 61.8 | 38.0 | 40.2 |
| – COT Index Reading (3 Year Range): | Bullish | Bearish | Bearish |
| NET POSITION MOVEMENT INDEX: | |||
| – 6-Week Change in Strength Index: | 7.6 | -7.1 | -0.6 |
This week’s current strength score (the trader positioning range over the past three years, measured from 0 to 100) shows the speculators are currently Bullish with a score of 55.4 percent. The commercials are Bullish with a score of 51.0 percent and the small traders (not shown in chart) are Bearish with a score of 32.1 percent.
| Silver Futures Statistics | SPECULATORS | COMMERCIALS | SMALL TRADERS |
| – Percent of Open Interest Longs: | 45.6 | 29.3 | 19.2 |
| – Percent of Open Interest Shorts: | 22.2 | 63.9 | 8.0 |
| – Net Position: | 33,115 | -48,860 | 15,745 |
| – Gross Longs: | 64,502 | 41,473 | 27,091 |
| – Gross Shorts: | 31,387 | 90,333 | 11,346 |
| – Long to Short Ratio: | 2.1 to 1 | 0.5 to 1 | 2.4 to 1 |
| NET POSITION TREND: | |||
| – COT Index Score (3 Year Range Pct): | 55.4 | 51.0 | 32.1 |
| – COT Index Reading (3 Year Range): | Bullish | Bullish | Bearish |
| NET POSITION MOVEMENT INDEX: | |||
| – 6-Week Change in Strength Index: | 17.4 | -20.4 | 20.1 |
This week’s current strength score (the trader positioning range over the past three years, measured from 0 to 100) shows the speculators are currently Bullish with a score of 65.7 percent. The commercials are Bearish with a score of 31.1 percent and the small traders (not shown in chart) are Bullish with a score of 77.1 percent.
| Copper Futures Statistics | SPECULATORS | COMMERCIALS | SMALL TRADERS |
| – Percent of Open Interest Longs: | 40.8 | 37.5 | 9.2 |
| – Percent of Open Interest Shorts: | 25.9 | 56.5 | 5.0 |
| – Net Position: | 32,335 | -41,294 | 8,959 |
| – Gross Longs: | 88,632 | 81,457 | 19,927 |
| – Gross Shorts: | 56,297 | 122,751 | 10,968 |
| – Long to Short Ratio: | 1.6 to 1 | 0.7 to 1 | 1.8 to 1 |
| NET POSITION TREND: | |||
| – COT Index Score (3 Year Range Pct): | 65.7 | 31.1 | 77.1 |
| – COT Index Reading (3 Year Range): | Bullish | Bearish | Bullish |
| NET POSITION MOVEMENT INDEX: | |||
| – 6-Week Change in Strength Index: | 9.4 | -11.6 | 21.7 |
This week’s current strength score (the trader positioning range over the past three years, measured from 0 to 100) shows the speculators are currently Bearish with a score of 24.5 percent. The commercials are Bullish with a score of 77.6 percent and the small traders (not shown in chart) are Bullish with a score of 54.1 percent.
| Platinum Futures Statistics | SPECULATORS | COMMERCIALS | SMALL TRADERS |
| – Percent of Open Interest Longs: | 51.1 | 28.9 | 16.3 |
| – Percent of Open Interest Shorts: | 23.9 | 67.7 | 4.6 |
| – Net Position: | 15,364 | -21,964 | 6,600 |
| – Gross Longs: | 28,870 | 16,314 | 9,196 |
| – Gross Shorts: | 13,506 | 38,278 | 2,596 |
| – Long to Short Ratio: | 2.1 to 1 | 0.4 to 1 | 3.5 to 1 |
| NET POSITION TREND: | |||
| – COT Index Score (3 Year Range Pct): | 24.5 | 77.6 | 54.1 |
| – COT Index Reading (3 Year Range): | Bearish | Bullish | Bullish |
| NET POSITION MOVEMENT INDEX: | |||
| – 6-Week Change in Strength Index: | 20.4 | -21.4 | 11.5 |
This week’s current strength score (the trader positioning range over the past three years, measured from 0 to 100) shows the speculators are currently Bearish-Extreme with a score of 0.0 percent. The commercials are Bullish-Extreme with a score of 99.8 percent and the small traders (not shown in chart) are Bearish with a score of 33.9 percent.
| Palladium Futures Statistics | SPECULATORS | COMMERCIALS | SMALL TRADERS |
| – Percent of Open Interest Longs: | 22.7 | 54.7 | 11.8 |
| – Percent of Open Interest Shorts: | 53.8 | 22.0 | 13.5 |
| – Net Position: | -3,391 | 3,574 | -183 |
| – Gross Longs: | 2,482 | 5,978 | 1,287 |
| – Gross Shorts: | 5,873 | 2,404 | 1,470 |
| – Long to Short Ratio: | 0.4 to 1 | 2.5 to 1 | 0.9 to 1 |
| NET POSITION TREND: | |||
| – COT Index Score (3 Year Range Pct): | 0.0 | 99.8 | 33.9 |
| – COT Index Reading (3 Year Range): | Bearish-Extreme | Bullish-Extreme | Bearish |
| NET POSITION MOVEMENT INDEX: | |||
| – 6-Week Change in Strength Index: | -3.7 | 2.8 | 8.7 |
Article By InvestMacro – Receive our weekly COT Reports by Email
*COT Report: The COT data, released weekly to the public each Friday, is updated through the most recent Tuesday (data is 3 days old) and shows a quick view of how large speculators or non-commercials (for-profit traders) were positioned in the futures markets.
The CFTC categorizes trader positions according to commercial hedgers (traders who use futures contracts for hedging as part of the business), non-commercials (large traders who speculate to realize trading profits) and nonreportable traders (usually small traders/speculators) as well as their open interest (contracts open in the market at time of reporting).See CFTC criteria here.
By JustMarkets The US stock indices started the week on a downbeat note. By the…
By Analytical Department RoboForex GBP/USD fell to 1.3437 on Tuesday as investors assessed the appointment…
By JustMarkets The US stock indices ended Friday’s session in the red. By the end…
By Analytical Department RoboForex USD/JPY opens the week at 162.36 on Monday. The Japanese yen…
By InvestMacro Here are the latest charts and statistics for the Commitment of Traders (COT)…
By InvestMacro The latest update for the weekly Commitment of Traders (COT) report was released…
This website uses cookies.