By InvestMacro.com COT Home | Data Tables | Data Downloads | Newsletter
Here are the latest charts and statistics for the Commitment of Traders (COT) data published by the Commodities Futures Trading Commission (CFTC).
The latest COT data is updated through Tuesday October 26th 2021 and shows a quick view of how large traders (for-profit speculators and commercial entities) were positioned in the futures markets.
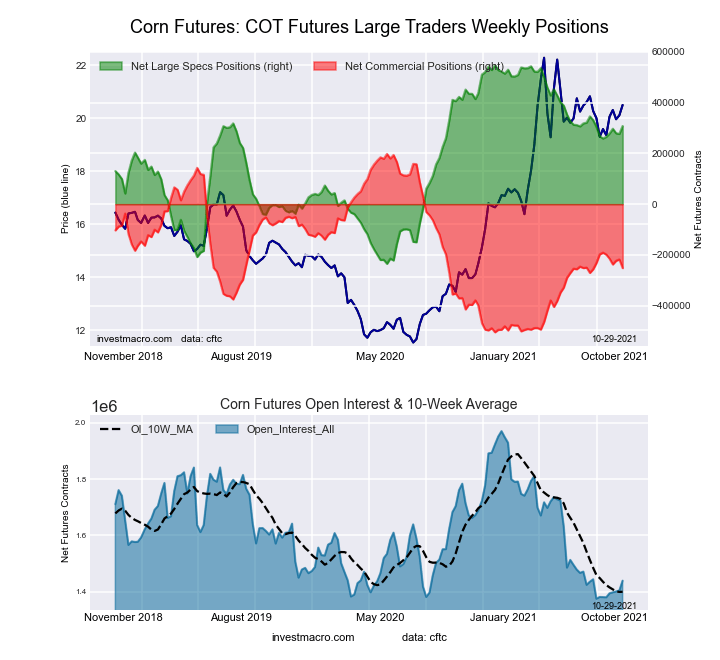
Highlighting this week’s COT Soft Commodity’s data is the speculator’s sharp increase in bullish bets for Corn. Corn bets jumped by over +30,000 contracts this week which marked the largest one-week gain in the past forty-three weeks. The rise brought the overall net position back above the +300,000 net contract level for the first time since August 31st. Overall, Corn speculative positions have remained in bullish territory for sixty-one weeks after turning from bearish to bullish back in August of 2020.
| Oct-26-2021 | OI | OI-Index | Spec-Net | Spec-Index | Com-Net | COM-Index | Smalls-Net | Smalls-Index |
|---|---|---|---|---|---|---|---|---|
| WTI Crude | 2,144,359 | 33 | 423,718 | 47 | -472,412 | 41 | 48,694 | 84 |
| Gold | 509,794 | 28 | 214,560 | 62 | -239,654 | 38 | 25,094 | 41 |
| Silver | 141,581 | 8 | 37,532 | 60 | -51,504 | 48 | 13,972 | 21 |
| Copper | 222,927 | 43 | 37,279 | 69 | -45,870 | 28 | 8,591 | 75 |
| Palladium | 10,205 | 17 | -2,954 | 2 | 2,962 | 97 | -8 | 44 |
| Platinum | 58,161 | 19 | 14,902 | 24 | -21,280 | 79 | 6,378 | 51 |
| Natural Gas | 1,295,271 | 42 | -138,188 | 37 | 96,361 | 61 | 41,827 | 85 |
| Brent | 200,768 | 40 | -17,810 | 98 | 12,648 | 1 | 5,162 | 81 |
| Heating Oil | 423,143 | 63 | 25,791 | 80 | -49,635 | 18 | 23,844 | 81 |
| Soybeans | 658,960 | 12 | 43,230 | 41 | -10,177 | 63 | -33,053 | 17 |
| Corn | 1,438,930 | 11 | 307,810 | 69 | -252,059 | 36 | -55,751 | 11 |
| Coffee | 307,195 | 64 | 67,593 | 98 | -71,916 | 3 | 4,323 | 18 |
| Sugar | 874,742 | 21 | 198,607 | 77 | -244,341 | 22 | 45,734 | 64 |
| Wheat | 405,625 | 33 | 763 | 48 | 8,753 | 49 | -9,516 | 56 |
Free Reports:
This week’s current strength score (the trader positioning range over the past three years, measured from 0 to 100) shows the speculators are currently Bullish with a score of 69.4 percent. The commercials are Bearish with a score of 36.0 percent and the small traders (not shown in chart) are Bearish-Extreme with a score of 11.0 percent.
| CORN Futures Statistics | SPECULATORS | COMMERCIALS | SMALL TRADERS |
| – Percent of Open Interest Longs: | 28.1 | 48.5 | 9.2 |
| – Percent of Open Interest Shorts: | 6.7 | 66.1 | 13.1 |
| – Net Position: | 307,810 | -252,059 | -55,751 |
| – Gross Longs: | 404,890 | 698,417 | 132,371 |
| – Gross Shorts: | 97,080 | 950,476 | 188,122 |
| – Long to Short Ratio: | 4.2 to 1 | 0.7 to 1 | 0.7 to 1 |
| NET POSITION TREND: | |||
| – COT Index Score (3 Year Range Pct): | 69.4 | 36.0 | 11.0 |
| – COT Index Reading (3 Year Range): | Bullish | Bearish | Bearish-Extreme |
| NET POSITION MOVEMENT INDEX: | |||
| – 6-Week Change in Strength Index: | 6.3 | -8.6 | 6.6 |
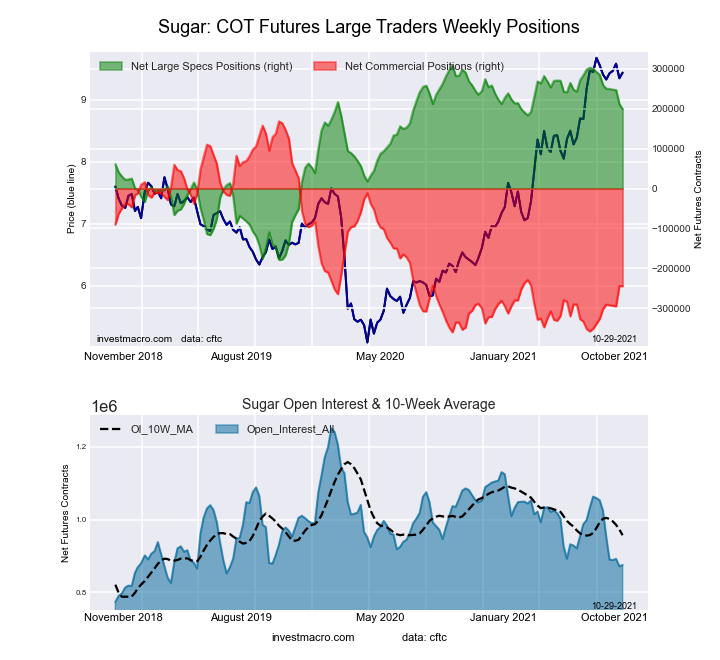
This week’s current strength score (the trader positioning range over the past three years, measured from 0 to 100) shows the speculators are currently Bullish with a score of 77.4 percent. The commercials are Bearish with a score of 21.8 percent and the small traders (not shown in chart) are Bullish with a score of 64.4 percent.
| SUGAR Futures Statistics | SPECULATORS | COMMERCIALS | SMALL TRADERS |
| – Percent of Open Interest Longs: | 29.6 | 44.9 | 10.9 |
| – Percent of Open Interest Shorts: | 6.9 | 72.8 | 5.6 |
| – Net Position: | 198,607 | -244,341 | 45,734 |
| – Gross Longs: | 258,776 | 392,733 | 94,957 |
| – Gross Shorts: | 60,169 | 637,074 | 49,223 |
| – Long to Short Ratio: | 4.3 to 1 | 0.6 to 1 | 1.9 to 1 |
| NET POSITION TREND: | |||
| – COT Index Score (3 Year Range Pct): | 77.4 | 21.8 | 64.4 |
| – COT Index Reading (3 Year Range): | Bullish | Bearish | Bullish |
| NET POSITION MOVEMENT INDEX: | |||
| – 6-Week Change in Strength Index: | -12.4 | 10.9 | 3.6 |
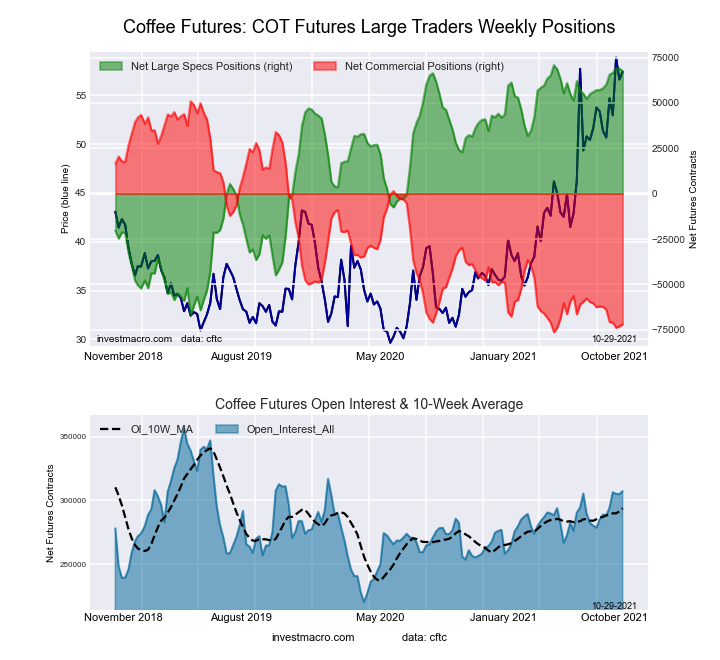
This week’s current strength score (the trader positioning range over the past three years, measured from 0 to 100) shows the speculators are currently Bullish-Extreme with a score of 97.7 percent. The commercials are Bearish-Extreme with a score of 3.5 percent and the small traders (not shown in chart) are Bearish-Extreme with a score of 18.2 percent.
| COFFEE Futures Statistics | SPECULATORS | COMMERCIALS | SMALL TRADERS |
| – Percent of Open Interest Longs: | 27.6 | 40.9 | 3.6 |
| – Percent of Open Interest Shorts: | 5.6 | 64.3 | 2.2 |
| – Net Position: | 67,593 | -71,916 | 4,323 |
| – Gross Longs: | 84,760 | 125,632 | 11,211 |
| – Gross Shorts: | 17,167 | 197,548 | 6,888 |
| – Long to Short Ratio: | 4.9 to 1 | 0.6 to 1 | 1.6 to 1 |
| NET POSITION TREND: | |||
| – COT Index Score (3 Year Range Pct): | 97.7 | 3.5 | 18.2 |
| – COT Index Reading (3 Year Range): | Bullish-Extreme | Bearish-Extreme | Bearish-Extreme |
| NET POSITION MOVEMENT INDEX: | |||
| – 6-Week Change in Strength Index: | 6.9 | -7.5 | 0.3 |
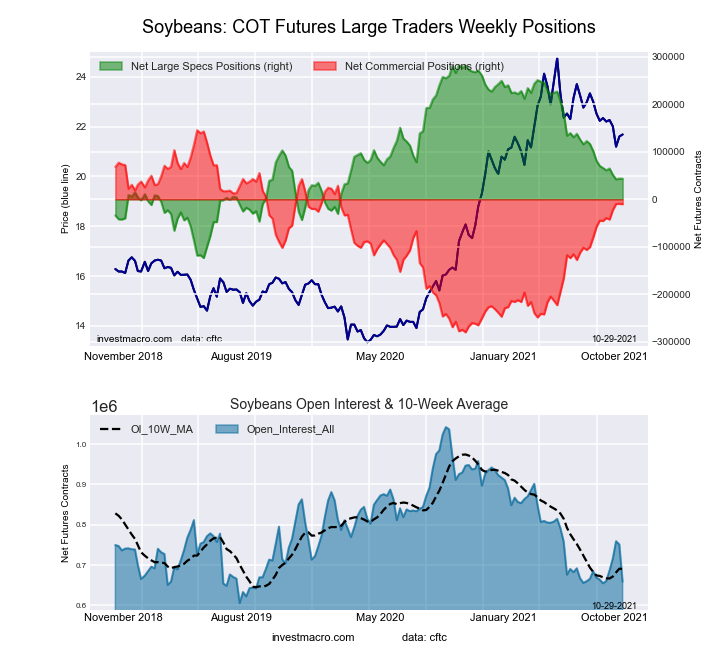
This week’s current strength score (the trader positioning range over the past three years, measured from 0 to 100) shows the speculators are currently Bearish with a score of 41.1 percent. The commercials are Bullish with a score of 63.4 percent and the small traders (not shown in chart) are Bearish-Extreme with a score of 16.8 percent.
| SOYBEANS Futures Statistics | SPECULATORS | COMMERCIALS | SMALL TRADERS |
| – Percent of Open Interest Longs: | 19.1 | 57.3 | 8.0 |
| – Percent of Open Interest Shorts: | 12.6 | 58.9 | 13.1 |
| – Net Position: | 43,230 | -10,177 | -33,053 |
| – Gross Longs: | 126,049 | 377,732 | 53,042 |
| – Gross Shorts: | 82,819 | 387,909 | 86,095 |
| – Long to Short Ratio: | 1.5 to 1 | 1.0 to 1 | 0.6 to 1 |
| NET POSITION TREND: | |||
| – COT Index Score (3 Year Range Pct): | 41.1 | 63.4 | 16.8 |
| – COT Index Reading (3 Year Range): | Bearish | Bullish | Bearish-Extreme |
| NET POSITION MOVEMENT INDEX: | |||
| – 6-Week Change in Strength Index: | -5.6 | 8.3 | -21.4 |
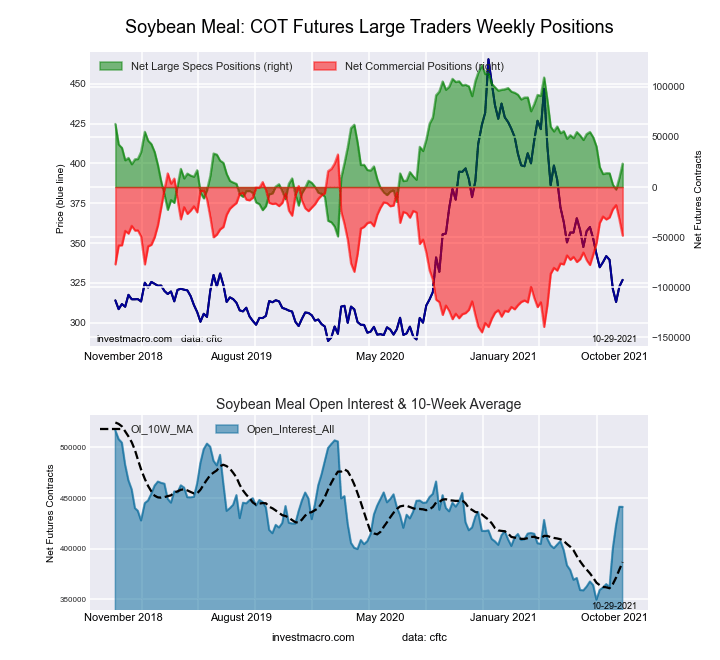
This week’s current strength score (the trader positioning range over the past three years, measured from 0 to 100) shows the speculators are currently Bearish with a score of 42.5 percent. The commercials are Bullish with a score of 54.4 percent and the small traders (not shown in chart) are Bullish with a score of 71.2 percent.
| SOYBEAN MEAL Futures Statistics | SPECULATORS | COMMERCIALS | SMALL TRADERS |
| – Percent of Open Interest Longs: | 20.4 | 47.7 | 12.6 |
| – Percent of Open Interest Shorts: | 15.1 | 58.7 | 6.9 |
| – Net Position: | 23,419 | -48,521 | 25,102 |
| – Gross Longs: | 90,211 | 210,364 | 55,643 |
| – Gross Shorts: | 66,792 | 258,885 | 30,541 |
| – Long to Short Ratio: | 1.4 to 1 | 0.8 to 1 | 1.8 to 1 |
| NET POSITION TREND: | |||
| – COT Index Score (3 Year Range Pct): | 42.5 | 54.4 | 71.2 |
| – COT Index Reading (3 Year Range): | Bearish | Bullish | Bullish |
| NET POSITION MOVEMENT INDEX: | |||
| – 6-Week Change in Strength Index: | 6.1 | -10.7 | 34.5 |
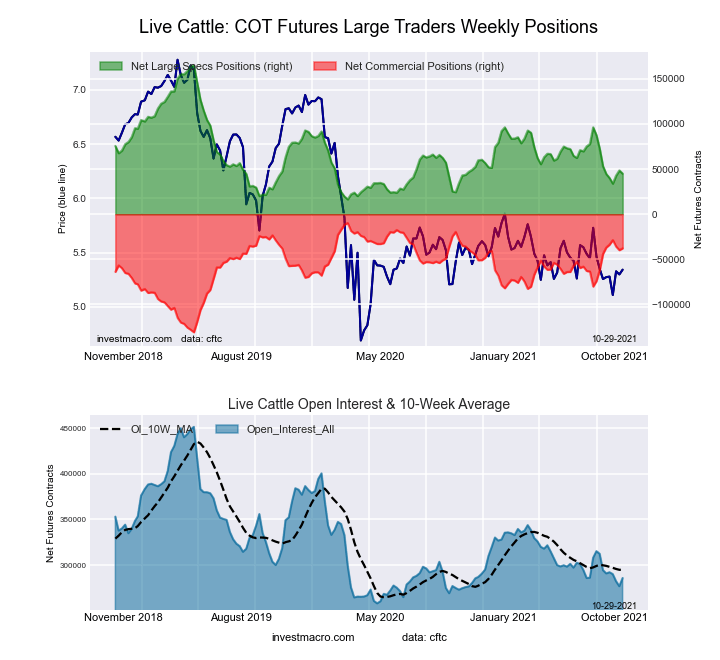
This week’s current strength score (the trader positioning range over the past three years, measured from 0 to 100) shows the speculators are currently Bearish-Extreme with a score of 19.2 percent. The commercials are Bullish with a score of 76.8 percent and the small traders (not shown in chart) are Bullish with a score of 69.9 percent.
| LIVE CATTLE Futures Statistics | SPECULATORS | COMMERCIALS | SMALL TRADERS |
| – Percent of Open Interest Longs: | 32.6 | 41.7 | 10.4 |
| – Percent of Open Interest Shorts: | 16.8 | 54.9 | 12.9 |
| – Net Position: | 44,978 | -37,895 | -7,083 |
| – Gross Longs: | 93,043 | 119,063 | 29,714 |
| – Gross Shorts: | 48,065 | 156,958 | 36,797 |
| – Long to Short Ratio: | 1.9 to 1 | 0.8 to 1 | 0.8 to 1 |
| NET POSITION TREND: | |||
| – COT Index Score (3 Year Range Pct): | 19.2 | 76.8 | 69.9 |
| – COT Index Reading (3 Year Range): | Bearish-Extreme | Bullish | Bullish |
| NET POSITION MOVEMENT INDEX: | |||
| – 6-Week Change in Strength Index: | -5.5 | 5.1 | 5.0 |
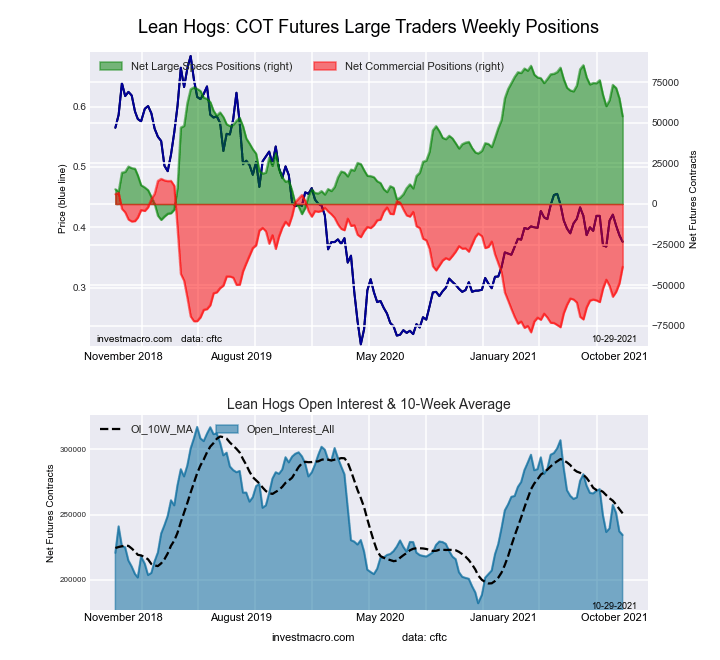
This week’s current strength score (the trader positioning range over the past three years, measured from 0 to 100) shows the speculators are currently Bullish with a score of 66.9 percent. The commercials are Bearish with a score of 42.6 percent and the small traders (not shown in chart) are Bearish-Extreme with a score of 9.5 percent.
| LEAN HOGS Futures Statistics | SPECULATORS | COMMERCIALS | SMALL TRADERS |
| – Percent of Open Interest Longs: | 39.8 | 32.7 | 7.5 |
| – Percent of Open Interest Shorts: | 16.8 | 49.2 | 14.0 |
| – Net Position: | 54,057 | -38,763 | -15,294 |
| – Gross Longs: | 93,406 | 76,620 | 17,605 |
| – Gross Shorts: | 39,349 | 115,383 | 32,899 |
| – Long to Short Ratio: | 2.4 to 1 | 0.7 to 1 | 0.5 to 1 |
| NET POSITION TREND: | |||
| – COT Index Score (3 Year Range Pct): | 66.9 | 42.6 | 9.5 |
| – COT Index Reading (3 Year Range): | Bullish | Bearish | Bearish-Extreme |
| NET POSITION MOVEMENT INDEX: | |||
| – 6-Week Change in Strength Index: | -13.8 | 14.1 | -0.6 |
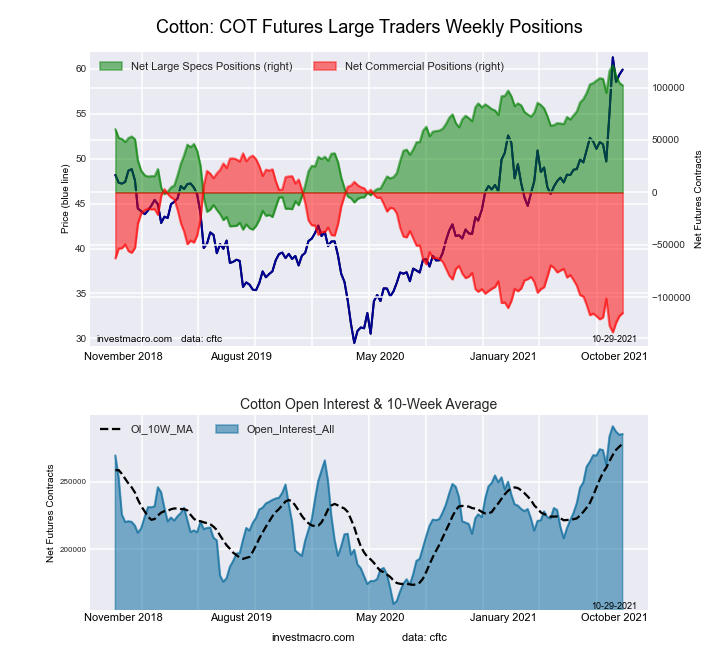
This week’s current strength score (the trader positioning range over the past three years, measured from 0 to 100) shows the speculators are currently Bullish-Extreme with a score of 87.7 percent. The commercials are Bearish-Extreme with a score of 10.7 percent and the small traders (not shown in chart) are Bullish-Extreme with a score of 94.1 percent.
| COTTON Futures Statistics | SPECULATORS | COMMERCIALS | SMALL TRADERS |
| – Percent of Open Interest Longs: | 39.7 | 38.2 | 7.9 |
| – Percent of Open Interest Shorts: | 3.9 | 78.5 | 3.4 |
| – Net Position: | 102,069 | -114,970 | 12,901 |
| – Gross Longs: | 113,246 | 108,979 | 22,564 |
| – Gross Shorts: | 11,177 | 223,949 | 9,663 |
| – Long to Short Ratio: | 10.1 to 1 | 0.5 to 1 | 2.3 to 1 |
| NET POSITION TREND: | |||
| – COT Index Score (3 Year Range Pct): | 87.7 | 10.7 | 94.1 |
| – COT Index Reading (3 Year Range): | Bullish-Extreme | Bearish-Extreme | Bullish-Extreme |
| NET POSITION MOVEMENT INDEX: | |||
| – 6-Week Change in Strength Index: | -3.9 | 2.4 | 12.9 |
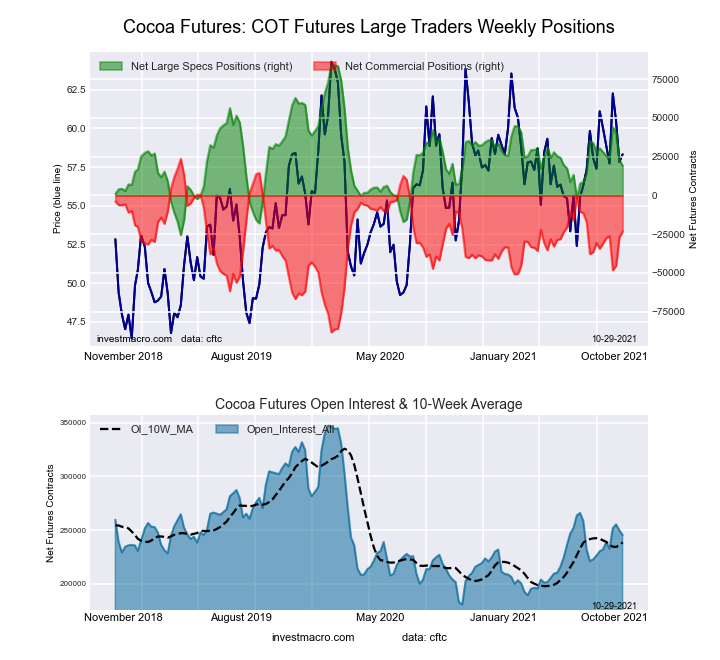
This week’s current strength score (the trader positioning range over the past three years, measured from 0 to 100) shows the speculators are currently Bearish with a score of 40.8 percent. The commercials are Bullish with a score of 58.1 percent and the small traders (not shown in chart) are Bullish with a score of 54.6 percent.
| COCOA Futures Statistics | SPECULATORS | COMMERCIALS | SMALL TRADERS |
| – Percent of Open Interest Longs: | 25.2 | 52.4 | 4.8 |
| – Percent of Open Interest Shorts: | 17.4 | 61.9 | 3.1 |
| – Net Position: | 19,198 | -23,256 | 4,058 |
| – Gross Longs: | 61,920 | 128,637 | 11,662 |
| – Gross Shorts: | 42,722 | 151,893 | 7,604 |
| – Long to Short Ratio: | 1.4 to 1 | 0.8 to 1 | 1.5 to 1 |
| NET POSITION TREND: | |||
| – COT Index Score (3 Year Range Pct): | 40.8 | 58.1 | 54.6 |
| – COT Index Reading (3 Year Range): | Bearish | Bullish | Bullish |
| NET POSITION MOVEMENT INDEX: | |||
| – 6-Week Change in Strength Index: | -8.1 | 6.9 | 12.7 |
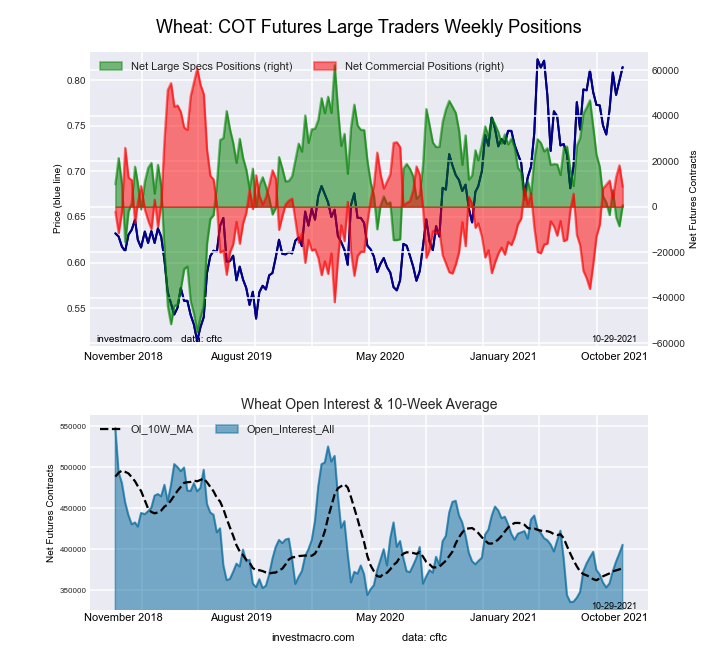
This week’s current strength score (the trader positioning range over the past three years, measured from 0 to 100) shows the speculators are currently Bearish with a score of 47.7 percent. The commercials are Bearish with a score of 49.4 percent and the small traders (not shown in chart) are Bullish with a score of 56.1 percent.
| WHEAT Futures Statistics | SPECULATORS | COMMERCIALS | SMALL TRADERS |
| – Percent of Open Interest Longs: | 25.2 | 38.8 | 7.8 |
| – Percent of Open Interest Shorts: | 25.0 | 36.6 | 10.2 |
| – Net Position: | 763 | 8,753 | -9,516 |
| – Gross Longs: | 102,322 | 157,392 | 31,777 |
| – Gross Shorts: | 101,559 | 148,639 | 41,293 |
| – Long to Short Ratio: | 1.0 to 1 | 1.1 to 1 | 0.8 to 1 |
| NET POSITION TREND: | |||
| – COT Index Score (3 Year Range Pct): | 47.7 | 49.4 | 56.1 |
| – COT Index Reading (3 Year Range): | Bearish | Bearish | Bullish |
| NET POSITION MOVEMENT INDEX: | |||
| – 6-Week Change in Strength Index: | -3.2 | 0.7 | 14.9 |
Article By InvestMacro.com – Receive our weekly COT Reports by Email
*COT Report: The COT data, released weekly to the public each Friday, is updated through the most recent Tuesday (data is 3 days old) and shows a quick view of how large speculators or non-commercials (for-profit traders) were positioned in the futures markets.
The CFTC categorizes trader positions according to commercial hedgers (traders who use futures contracts for hedging as part of the business), non-commercials (large traders who speculate to realize trading profits) and nonreportable traders (usually small traders/speculators).
Find CFTC criteria here: (http://www.cftc.gov/MarketReports/CommitmentsofTraders/ExplanatoryNotes/index.htm).
By Analytical Department RoboForex Gold fell to 4,033 USD per ounce on Thursday, extending its…
By JustMarkets By the end of the day, the Dow Jones Index (US30) rose by…
By JustMarkets On Tuesday, the US stock indices finished the session in the green, supported…
By Analytical Department RoboForex GBP/USD rose to 1.3403 on Wednesday, with British politics taking centre…
By Analytical Department RoboForex USD/JPY ended Tuesday at 162.27, with the Japanese yen remaining near…
By JustMarkets On Friday, the Dow Jones Index (US30) rose by 0.29% (weekly: -0.36%). The…
This website uses cookies.