By InvestMacro.com COT Home | Data Tables | Data Downloads | Newsletter
Here are the latest charts and statistics for the Commitment of Traders (COT) data published by the Commodities Futures Trading Commission (CFTC).
The latest COT data is updated through Tuesday October 26th 2021 and shows a quick view of how large traders (for-profit speculators and commercial entities) were positioned in the futures markets.
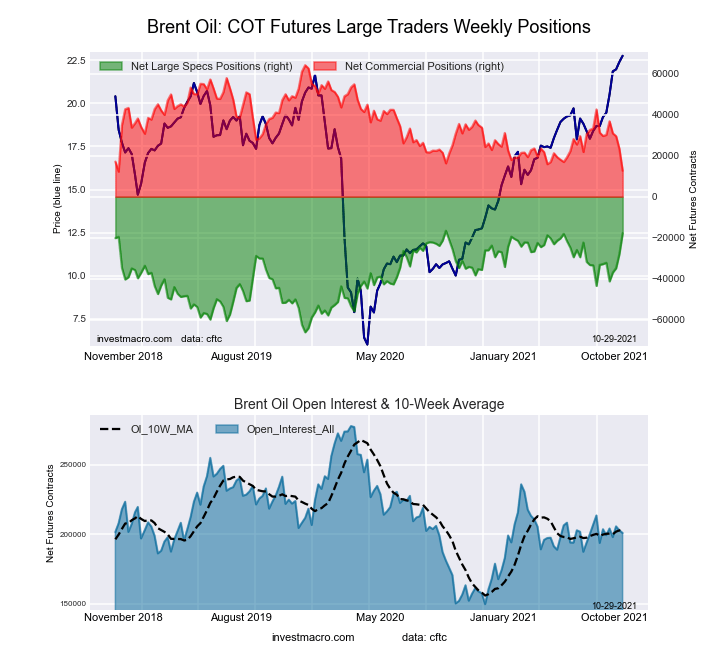
Highlighting this week’s COT Energy data is the Brent Oil (Last Day) contracts which have hit their best speculator position in the past fifty-four weeks, dating back to October 20th of 2020. The speculative position for Brent has continually been in a bearish overall level since 2013 but has been trending closer to a neutral or perhaps even a bullish level soon. The Brent position has now risen for seven out of the past eight weeks and by a total of +25,751 contracts over that time-frame. The strength index score (the speculative level compared to the past 3-years) has shown an extreme level for Brent with a score of 97.6 percent.
| Oct-26-2021 | OI | OI-Index | Spec-Net | Spec-Index | Com-Net | COM-Index | Smalls-Net | Smalls-Index |
|---|---|---|---|---|---|---|---|---|
| WTI Crude | 2,144,359 | 33 | 423,718 | 47 | -472,412 | 41 | 48,694 | 84 |
| Gold | 509,794 | 28 | 214,560 | 62 | -239,654 | 38 | 25,094 | 41 |
| Silver | 141,581 | 8 | 37,532 | 60 | -51,504 | 48 | 13,972 | 21 |
| Copper | 222,927 | 43 | 37,279 | 69 | -45,870 | 28 | 8,591 | 75 |
| Palladium | 10,205 | 17 | -2,954 | 2 | 2,962 | 97 | -8 | 44 |
| Platinum | 58,161 | 19 | 14,902 | 24 | -21,280 | 79 | 6,378 | 51 |
| Natural Gas | 1,295,271 | 42 | -138,188 | 37 | 96,361 | 61 | 41,827 | 85 |
| Brent | 200,768 | 40 | -17,810 | 98 | 12,648 | 1 | 5,162 | 81 |
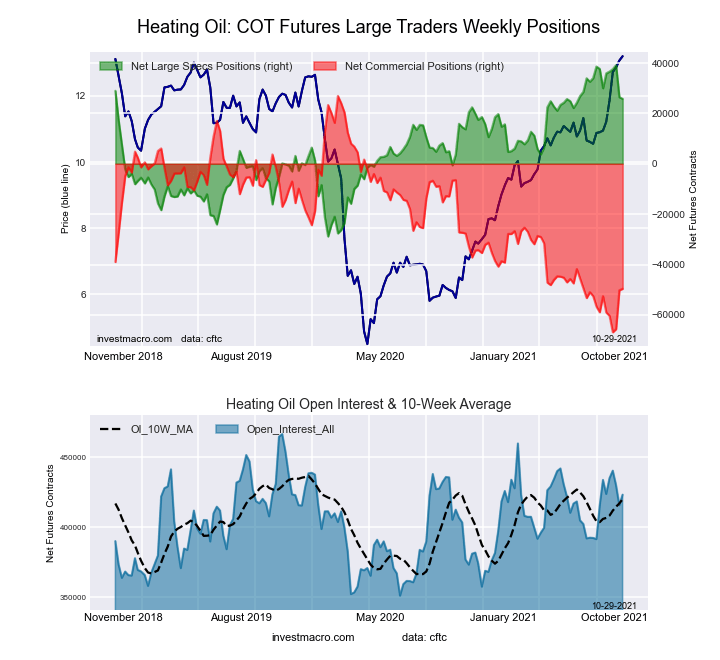
| Heating Oil | 423,143 | 63 | 25,791 | 80 | -49,635 | 18 | 23,844 | 81 |
| Soybeans | 658,960 | 12 | 43,230 | 41 | -10,177 | 63 | -33,053 | 17 |
| Corn | 1,438,930 | 11 | 307,810 | 69 | -252,059 | 36 | -55,751 | 11 |
| Coffee | 307,195 | 64 | 67,593 | 98 | -71,916 | 3 | 4,323 | 18 |
| Sugar | 874,742 | 21 | 198,607 | 77 | -244,341 | 22 | 45,734 | 64 |
| Wheat | 405,625 | 33 | 763 | 48 | 8,753 | 49 | -9,516 | 56 |
Free Reports:
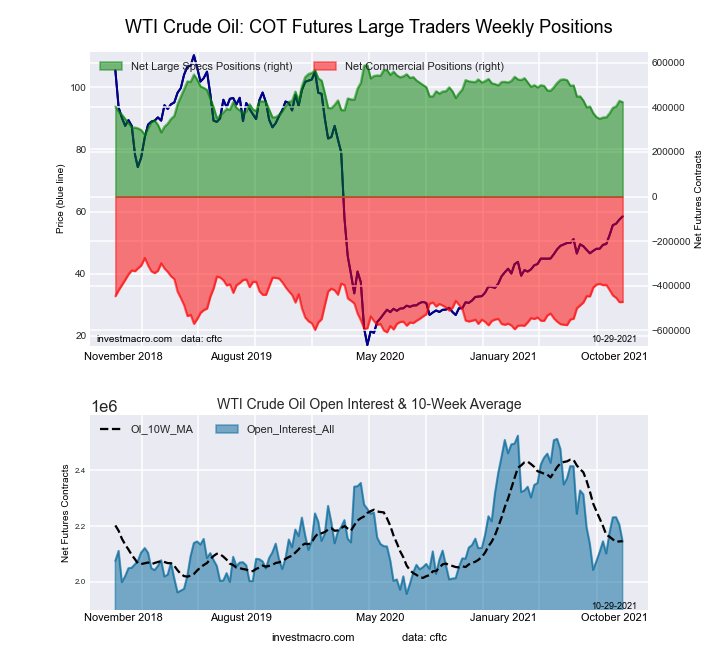
This week’s current strength score (the trader positioning range over the past three years, measured from 0 to 100) shows the speculators are currently Bearish with a score of 46.9 percent. The commercials are Bearish with a score of 40.9 percent and the small traders (not shown in chart) are Bullish-Extreme with a score of 83.6 percent.
| WTI Crude Oil Futures Statistics | SPECULATORS | COMMERCIALS | SMALL TRADERS |
| – Percent of Open Interest Longs: | 25.7 | 32.4 | 4.7 |
| – Percent of Open Interest Shorts: | 5.9 | 54.4 | 2.4 |
| – Net Position: | 423,718 | -472,412 | 48,694 |
| – Gross Longs: | 550,171 | 694,591 | 100,959 |
| – Gross Shorts: | 126,453 | 1,167,003 | 52,265 |
| – Long to Short Ratio: | 4.4 to 1 | 0.6 to 1 | 1.9 to 1 |
| NET POSITION TREND: | |||
| – COT Index Score (3 Year Range Pct): | 46.9 | 40.9 | 83.6 |
| – COT Index Reading (3 Year Range): | Bearish | Bearish | Bullish-Extreme |
| NET POSITION MOVEMENT INDEX: | |||
| – 6-Week Change in Strength Index: | 22.0 | -22.6 | 9.3 |
This week’s current strength score (the trader positioning range over the past three years, measured from 0 to 100) shows the speculators are currently Bullish-Extreme with a score of 97.6 percent. The commercials are Bearish-Extreme with a score of 0.8 percent and the small traders (not shown in chart) are Bullish-Extreme with a score of 80.7 percent.
| Brent Crude Oil Futures Statistics | SPECULATORS | COMMERCIALS | SMALL TRADERS |
| – Percent of Open Interest Longs: | 20.9 | 41.8 | 5.9 |
| – Percent of Open Interest Shorts: | 29.8 | 35.5 | 3.3 |
| – Net Position: | -17,810 | 12,648 | 5,162 |
| – Gross Longs: | 41,997 | 83,846 | 11,865 |
| – Gross Shorts: | 59,807 | 71,198 | 6,703 |
| – Long to Short Ratio: | 0.7 to 1 | 1.2 to 1 | 1.8 to 1 |
| NET POSITION TREND: | |||
| – COT Index Score (3 Year Range Pct): | 97.6 | 0.8 | 80.7 |
| – COT Index Reading (3 Year Range): | Bullish-Extreme | Bearish-Extreme | Bullish-Extreme |
| NET POSITION MOVEMENT INDEX: | |||
| – 6-Week Change in Strength Index: | 30.5 | -32.7 | 16.8 |
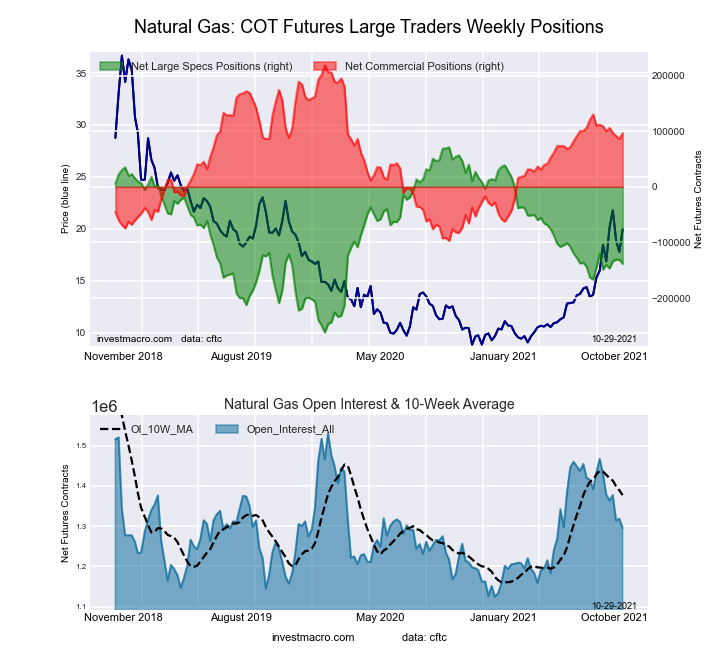
This week’s current strength score (the trader positioning range over the past three years, measured from 0 to 100) shows the speculators are currently Bearish with a score of 37.1 percent. The commercials are Bullish with a score of 61.2 percent and the small traders (not shown in chart) are Bullish-Extreme with a score of 84.9 percent.
| Natural Gas Futures Statistics | SPECULATORS | COMMERCIALS | SMALL TRADERS |
| – Percent of Open Interest Longs: | 20.1 | 44.3 | 5.1 |
| – Percent of Open Interest Shorts: | 30.7 | 36.9 | 1.9 |
| – Net Position: | -138,188 | 96,361 | 41,827 |
| – Gross Longs: | 259,785 | 574,177 | 65,966 |
| – Gross Shorts: | 397,973 | 477,816 | 24,139 |
| – Long to Short Ratio: | 0.7 to 1 | 1.2 to 1 | 2.7 to 1 |
| NET POSITION TREND: | |||
| – COT Index Score (3 Year Range Pct): | 37.1 | 61.2 | 84.9 |
| – COT Index Reading (3 Year Range): | Bearish | Bullish | Bullish-Extreme |
| NET POSITION MOVEMENT INDEX: | |||
| – 6-Week Change in Strength Index: | 3.1 | -3.9 | 5.2 |
This week’s current strength score (the trader positioning range over the past three years, measured from 0 to 100) shows the speculators are currently Bearish with a score of 22.1 percent. The commercials are Bullish with a score of 75.8 percent and the small traders (not shown in chart) are Bullish with a score of 72.1 percent.
| Nasdaq Mini Futures Statistics | SPECULATORS | COMMERCIALS | SMALL TRADERS |
| – Percent of Open Interest Longs: | 34.4 | 41.9 | 7.6 |
| – Percent of Open Interest Shorts: | 18.4 | 61.2 | 4.4 |
| – Net Position: | 51,045 | -61,168 | 10,123 |
| – Gross Longs: | 109,610 | 133,479 | 24,154 |
| – Gross Shorts: | 58,565 | 194,647 | 14,031 |
| – Long to Short Ratio: | 1.9 to 1 | 0.7 to 1 | 1.7 to 1 |
| NET POSITION TREND: | |||
| – COT Index Score (3 Year Range Pct): | 22.1 | 75.8 | 72.1 |
| – COT Index Reading (3 Year Range): | Bearish | Bullish | Bullish |
| NET POSITION MOVEMENT INDEX: | |||
| – 6-Week Change in Strength Index: | 9.2 | -9.0 | -0.3 |
This week’s current strength score (the trader positioning range over the past three years, measured from 0 to 100) shows the speculators are currently Bullish-Extreme with a score of 80.4 percent. The commercials are Bearish-Extreme with a score of 18.4 percent and the small traders (not shown in chart) are Bullish-Extreme with a score of 81.0 percent.
| Heating Oil Futures Statistics | SPECULATORS | COMMERCIALS | SMALL TRADERS |
| – Percent of Open Interest Longs: | 16.3 | 51.6 | 11.1 |
| – Percent of Open Interest Shorts: | 10.2 | 63.4 | 5.5 |
| – Net Position: | 25,791 | -49,635 | 23,844 |
| – Gross Longs: | 68,785 | 218,436 | 47,173 |
| – Gross Shorts: | 42,994 | 268,071 | 23,329 |
| – Long to Short Ratio: | 1.6 to 1 | 0.8 to 1 | 2.0 to 1 |
| NET POSITION TREND: | |||
| – COT Index Score (3 Year Range Pct): | 80.4 | 18.4 | 81.0 |
| – COT Index Reading (3 Year Range): | Bullish-Extreme | Bearish-Extreme | Bullish-Extreme |
| NET POSITION MOVEMENT INDEX: | |||
| – 6-Week Change in Strength Index: | -6.2 | 3.1 | 4.4 |
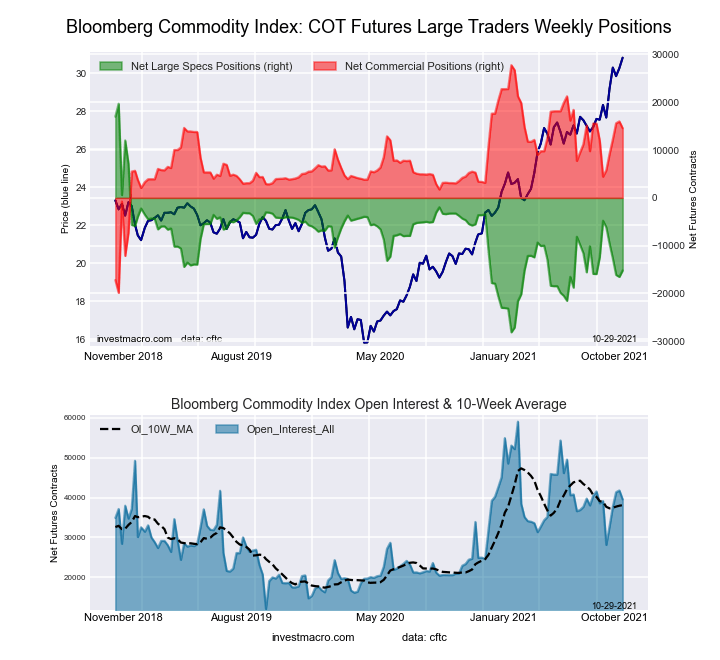
This week’s current strength score (the trader positioning range over the past three years, measured from 0 to 100) shows the speculators are currently Bearish with a score of 27.1 percent. The commercials are Bullish with a score of 72.3 percent and the small traders (not shown in chart) are Bullish with a score of 51.3 percent.
| Bloomberg Index Futures Statistics | SPECULATORS | COMMERCIALS | SMALL TRADERS |
| – Percent of Open Interest Longs: | 51.9 | 41.9 | 1.7 |
| – Percent of Open Interest Shorts: | 90.2 | 5.1 | 0.1 |
| – Net Position: | -15,174 | 14,559 | 615 |
| – Gross Longs: | 20,522 | 16,575 | 673 |
| – Gross Shorts: | 35,696 | 2,016 | 58 |
| – Long to Short Ratio: | 0.6 to 1 | 8.2 to 1 | 11.6 to 1 |
| NET POSITION TREND: | |||
| – COT Index Score (3 Year Range Pct): | 27.1 | 72.3 | 51.3 |
| – COT Index Reading (3 Year Range): | Bearish | Bullish | Bullish |
| NET POSITION MOVEMENT INDEX: | |||
| – 6-Week Change in Strength Index: | -21.8 | 21.3 | 11.8 |
Article By InvestMacro.com – Receive our weekly COT Reports by Email
*COT Report: The COT data, released weekly to the public each Friday, is updated through the most recent Tuesday (data is 3 days old) and shows a quick view of how large speculators or non-commercials (for-profit traders) were positioned in the futures markets.
The CFTC categorizes trader positions according to commercial hedgers (traders who use futures contracts for hedging as part of the business), non-commercials (large traders who speculate to realize trading profits) and nonreportable traders (usually small traders/speculators).
Find CFTC criteria here: (http://www.cftc.gov/MarketReports/CommitmentsofTraders/ExplanatoryNotes/index.htm).
By Analytical Department RoboForex Gold fell to 4,033 USD per ounce on Thursday, extending its…
By JustMarkets By the end of the day, the Dow Jones Index (US30) rose by…
By JustMarkets On Tuesday, the US stock indices finished the session in the green, supported…
By Analytical Department RoboForex GBP/USD rose to 1.3403 on Wednesday, with British politics taking centre…
By Analytical Department RoboForex USD/JPY ended Tuesday at 162.27, with the Japanese yen remaining near…
By JustMarkets On Friday, the Dow Jones Index (US30) rose by 0.29% (weekly: -0.36%). The…
This website uses cookies.