By Dmitriy Gurkovskiy, Chief Analyst at RoboForex
The Brent price is starting another week of August with a growth. The asset is trading at $66.65; the market is trying to compensate for previous losses.
This is the major trigger right now – market players are buying the assets that plunged significantly. A secondary catalyst is a piece of news about an explosion and fire on the platform in the Gulf of Mexico – investors believe that it may cause oil supply problems.
In general, the commodity market may establish conditions for a long-awaited rebound after a stressed period of emotional sales.
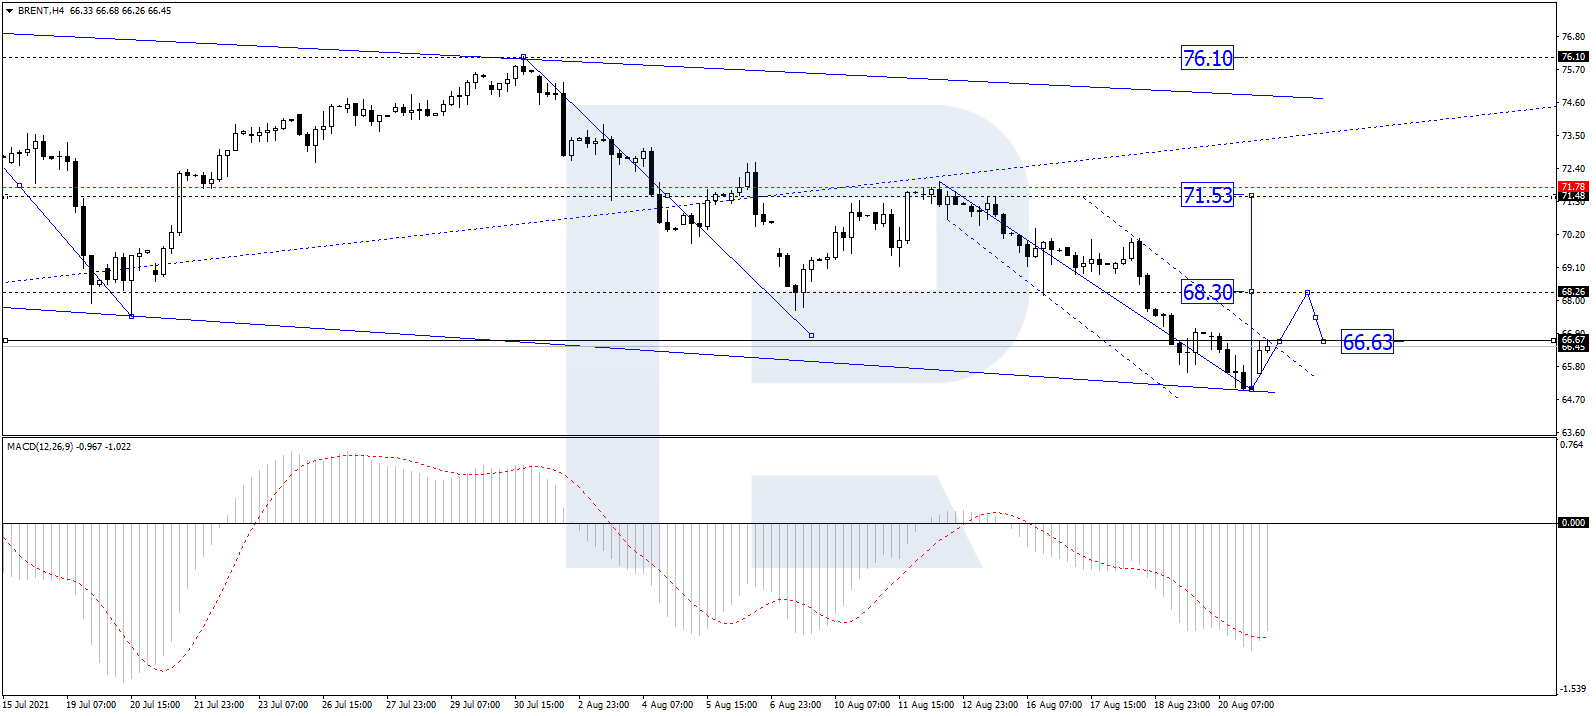
In the H4 chart, after reaching the predicted downside target at 67.00, Bret is consolidating below this level; it has already reached the downside border of the range at 65.05. Possibly, today the asset may form a new rising impulse towards 68.27 and then fall to reach 66.66, thus forming another consolidation range near the lows. Later, the market may break the range to the upside and form one more ascending wave with the target at 71.50. From the technical point of view, this scenario is confirmed by MACD Oscillator: its signal line is trading below 0 outside the histogram area and may move upwards. In the future, the line is expected to break 0, thus boosting the asset to grow towards new highs on the price chart.
Free Reports:
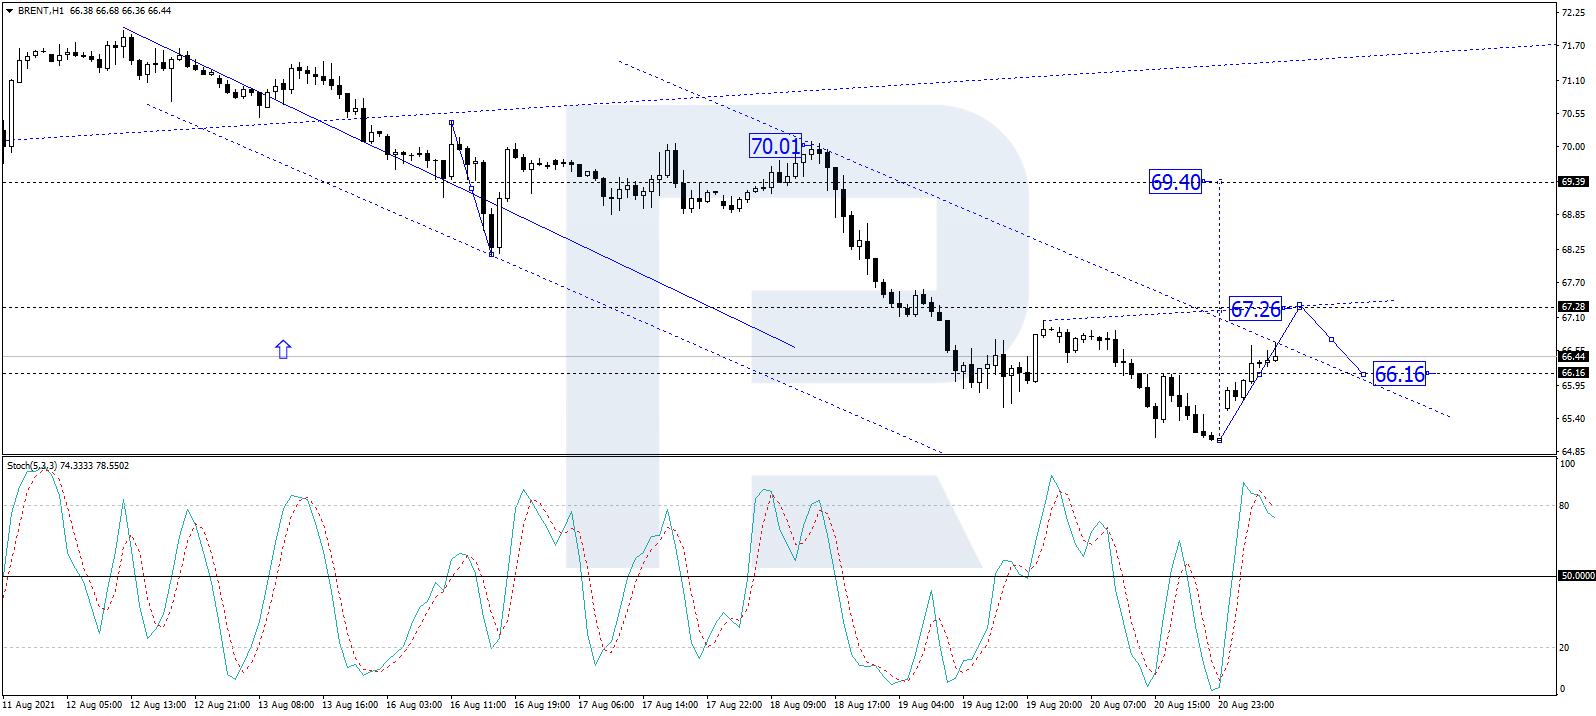
As we can see in the H1 chart, after completing the ascending structure at 66.16 and forming a new consolidation range around this level, Brent is expected to break it to the upside and continue moving upwards with the first target at 67.26. After that, the instrument may correct to test 66.16 from above and then form one more ascending structure with the short-term target at 69.40. From the technical point of view, this idea is confirmed by the Stochastic Oscillator: after breaking 50 and reaching 80, its signal line is expected to fall and return to 50. Later, the line may rebound and resume moving upwards to reach 80.
Disclaimer
Any forecasts contained herein are based on the author’s particular opinion. This analysis may not be treated as trading advice. RoboForex bears no responsibility for trading results based on trading recommendations and reviews contained herein.
By JustMarkets The US stock indices ended Friday’s session in the red. By the end…
By Analytical Department RoboForex USD/JPY opens the week at 162.36 on Monday. The Japanese yen…
By InvestMacro Here are the latest charts and statistics for the Commitment of Traders (COT)…
By InvestMacro The latest update for the weekly Commitment of Traders (COT) report was released…
By InvestMacro Here are the latest charts and statistics for the Commitment of Traders (COT)…
By InvestMacro Here are the latest charts and statistics for the Commitment of Traders (COT)…
This website uses cookies.