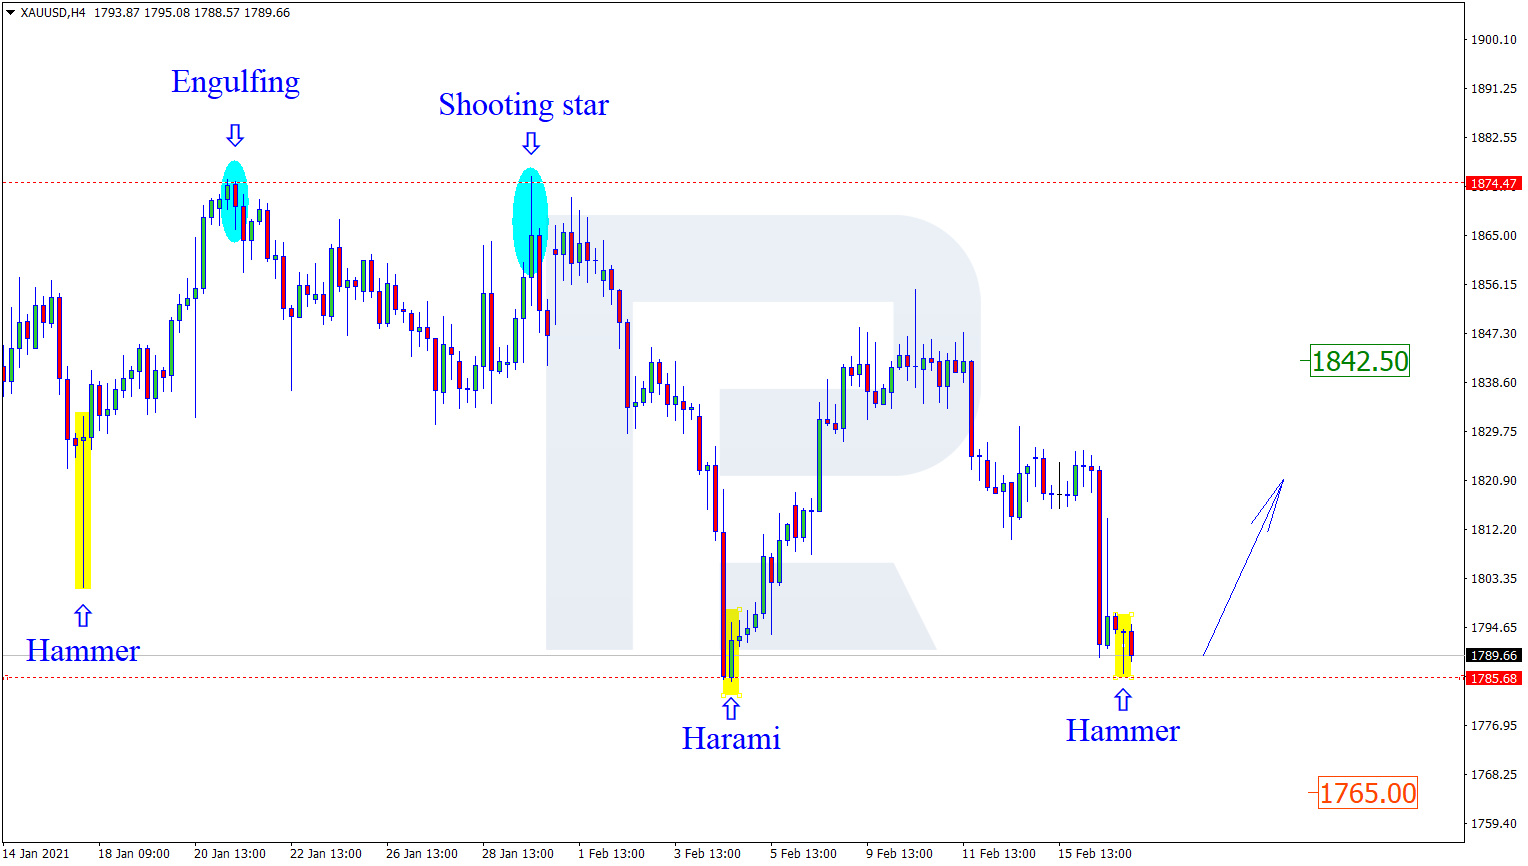
As we can see in the H4 chart, the metal is about to finish the correctional impulse. After forming several reversal patterns, such as Hammer, close to the horizontal support level, XAUUSD may reverse and resume growing towards the resistance area. In this case, the upside target will be at 1842.50. At the same time, an opposite scenario implies that the price may continue its decline towards 1765.00 before further growth.
NZDUSD, “New Zealand vs. US Dollar”
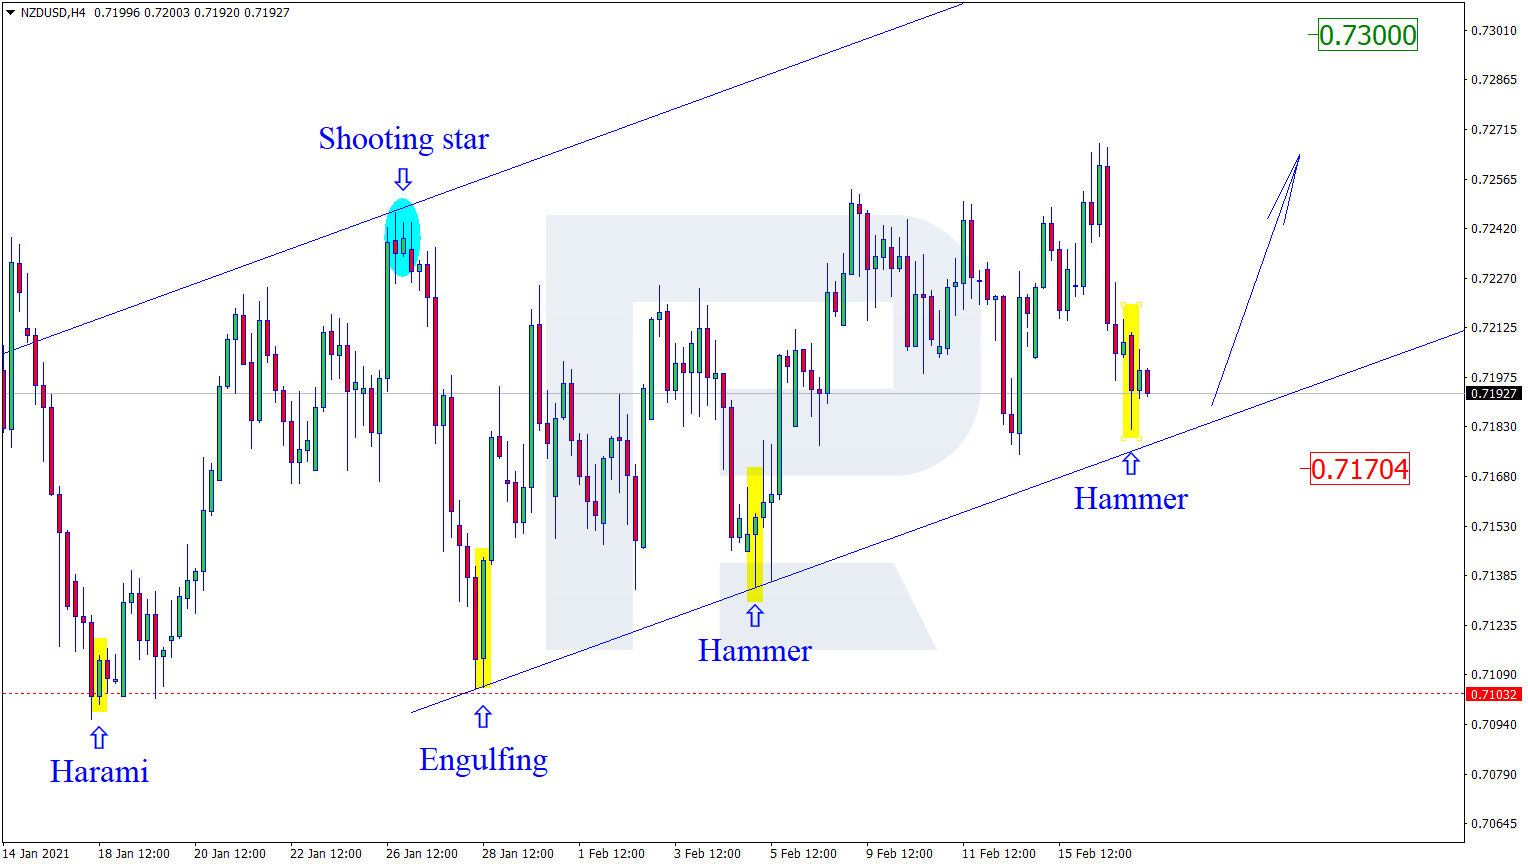
As we can see in the H4 chart, the pair is correcting within the uptrend. By now, NZDUSD has formed several reversal patterns, such as Hammer, close to the support level. The upside target remains at the resistance area at 0.7300. However, an alternative scenario implies that the price may continue the correction towards 0.7170 before resuming the ascending impulse.
GBPUSD, “Great Britain Pound vs US Dollar”
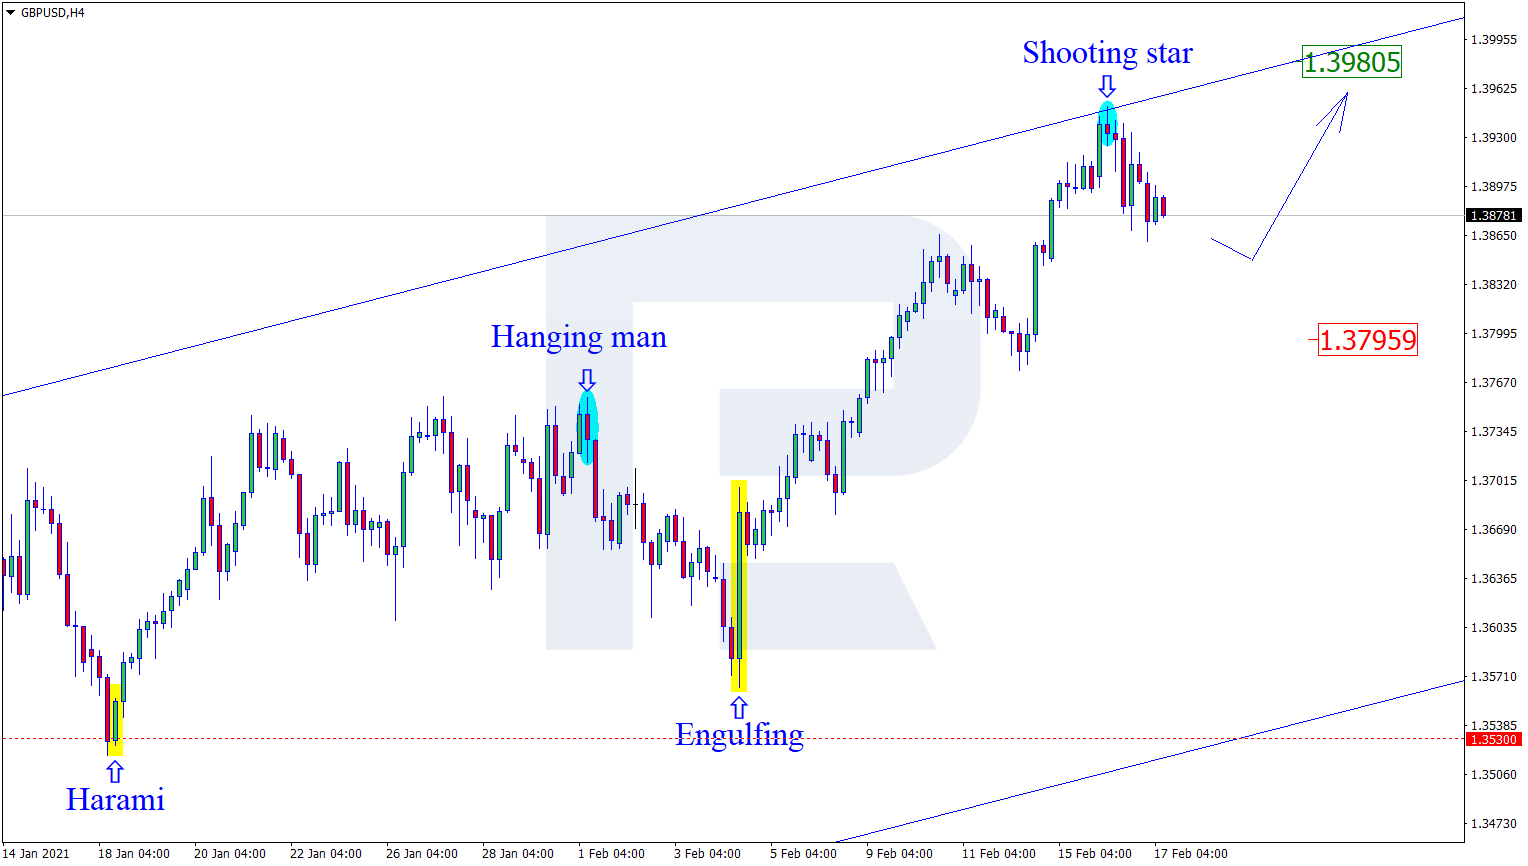
As we can see in the H4 chart, the correctional wave within the uptrend continues. Right now, after forming several reversal patterns, such as Shooting Star, not far from the resistance area, GBPUSD is reversing. In this case, the correctional target is the support level at 1.3795. After that, the instrument may rebound and resume moving upwards to reach the upside target at 1.3980.
Attention! Forecasts presented in this section only reflect the author’s private opinion and should not be considered as guidance for trading. RoboForex LP bears no responsibility for trading results based on trading recommendations described in these analytical reviews.
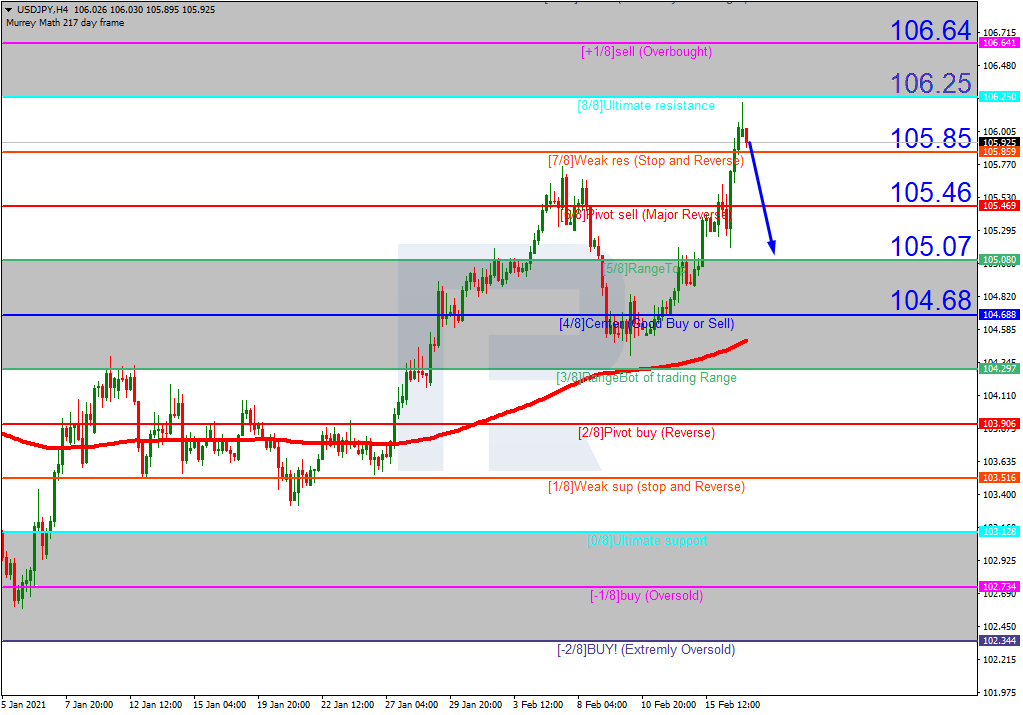
As we can see in the H4 chart, after rebounding from the resistance at 8/8, USDJPY is expected to start a new correction to the downside and reach 5/8. However, this scenario may no longer be valid if the price breaks 8/8 to the upside. After that, the instrument may reverse and move upwards to reach the resistance at +1/8.
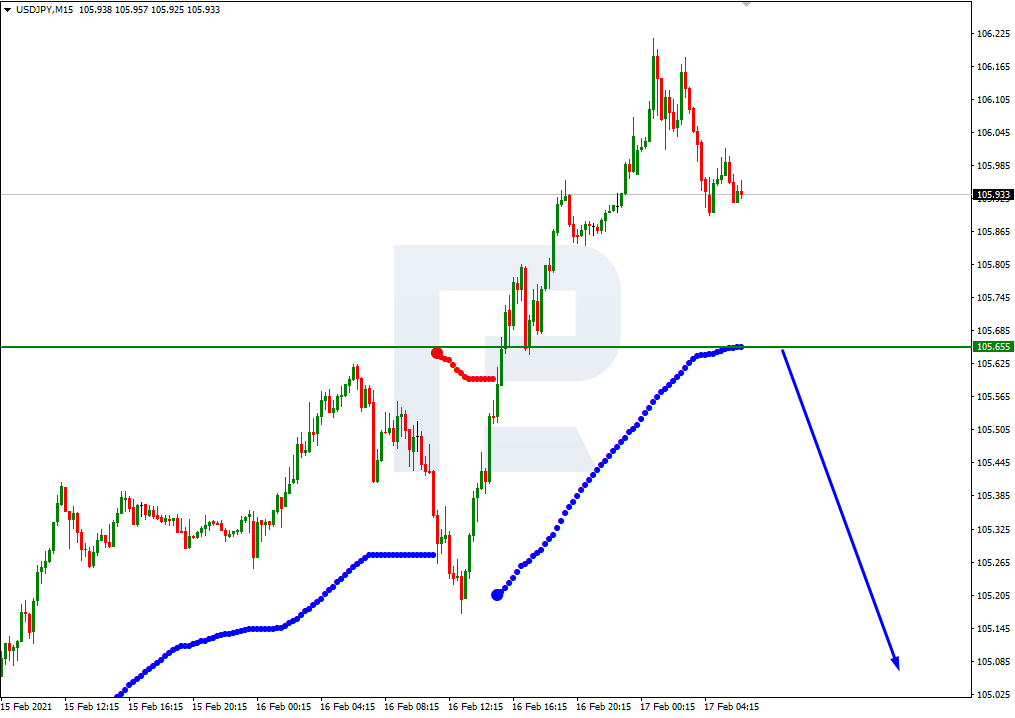
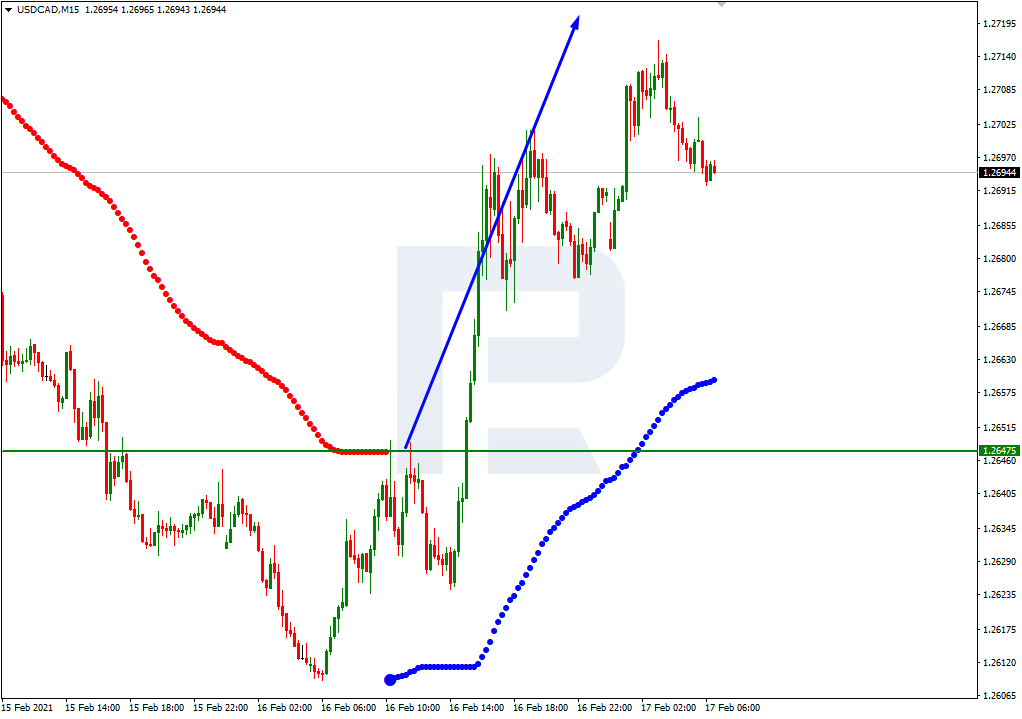
In the M15 chart, the pair may break the downside line of the VoltyChannel indicator and, as a result, continue moving downwards.
USDCAD, “US Dollar vs Canadian Dollar”
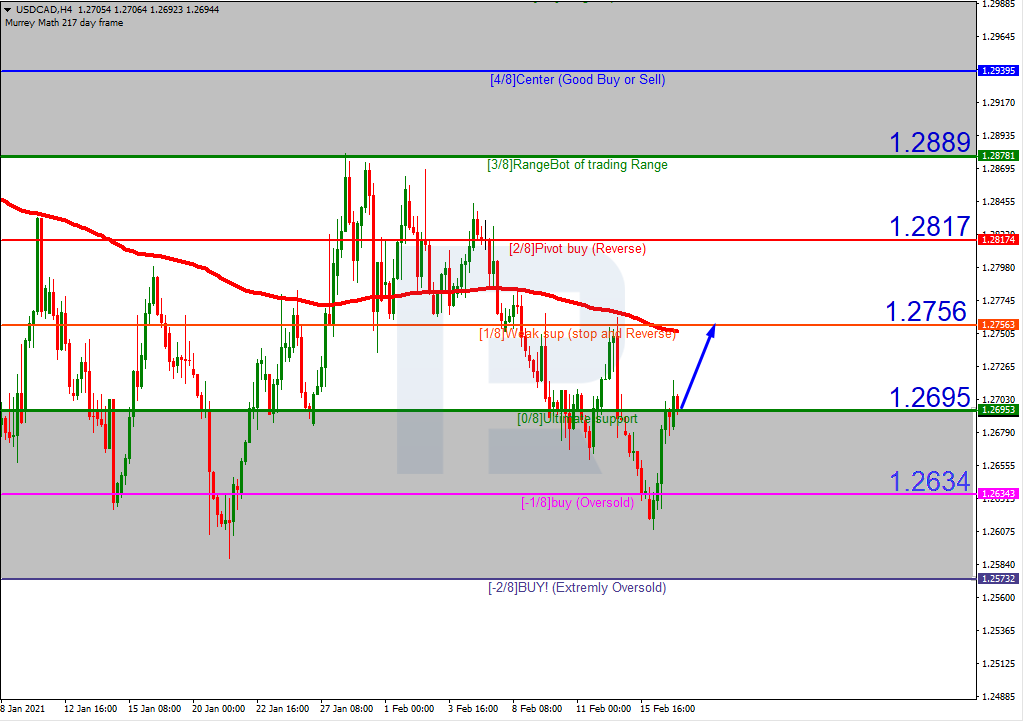
In the H4 chart, USDCAD is no longer moving within the “oversold area”. In this case, the price is expected to continue growing towards the closest resistance at 1/8. Still, this scenario may no longer be valid if the price breaks 0/8 to the downside. After that, the instrument may reverse and fall to reach the support at -1/8.
As we can see in the M15 chart, the pair has broken the upside line of the VoltyChannel indicator and, as a result, may continue trading upwards.
Attention! Forecasts presented in this section only reflect the author’s private opinion and should not be considered as guidance for trading. RoboForex LP bears no responsibility for trading results based on trading recommendations described in these analytical reviews.
Gold prices extended their losses in early trading on Wednesday, pressured by rising bond yields and a firmer US dollar. On Tuesday, the US 10-year Treasury yield reached a level not seen since February 2020, while the US dollar index bounced back from a three-week low.
The rise in bond interest rates has been spurred by the optimistic outlook in the market, amid positive news on COVID-19 vaccine rollouts and the $1.9 trillion US stimulus package. Rising bond yields make non-yielding assets such as gold a less appealing investment.
The mandatory Securities and Exchange Commission’s (SEC) 13F filing of BlackRock, the world’s largest asset manager, revealed that it is exiting gold and buying silver. The filing showed that in the fourth quarter of 2020 BlackRock sold 2.7 million SPDR Gold Shares (GLD) and bought 1.18 million shares of iShares Silver Trust (SLV).
Meanwhile, Bitcoin, the asset increasingly touted as ‘digital gold’, crossed the mega psychological level of $50,000 in Tuesday trading. The latest surge came as large companies including Tesla, Mastercard and BNY Mellon showed support for cryptocurrencies.
Peter Schiff, notable gold bull and CEO of Euro Pacific Capital tweeted: “Now that #Bitcoin has hit $50,000 I must admit that a move up to $100,000 can’t be ruled out. However a move down to zero can’t be ruled out either. While a temporary move up to $100K is possible, a permanent move down to zero is inevitable. If you don’t want to gamble buy #gold.”
Holger Zschäpitz, Senior Editor at the Economic and Financial desk of the German daily Die Welt pointed out the stark difference in the two assets, tweeting: “#Bitcoin is eating Gold in one chart! Gold/Bitcoin ratio hit a fresh All-Time low.”
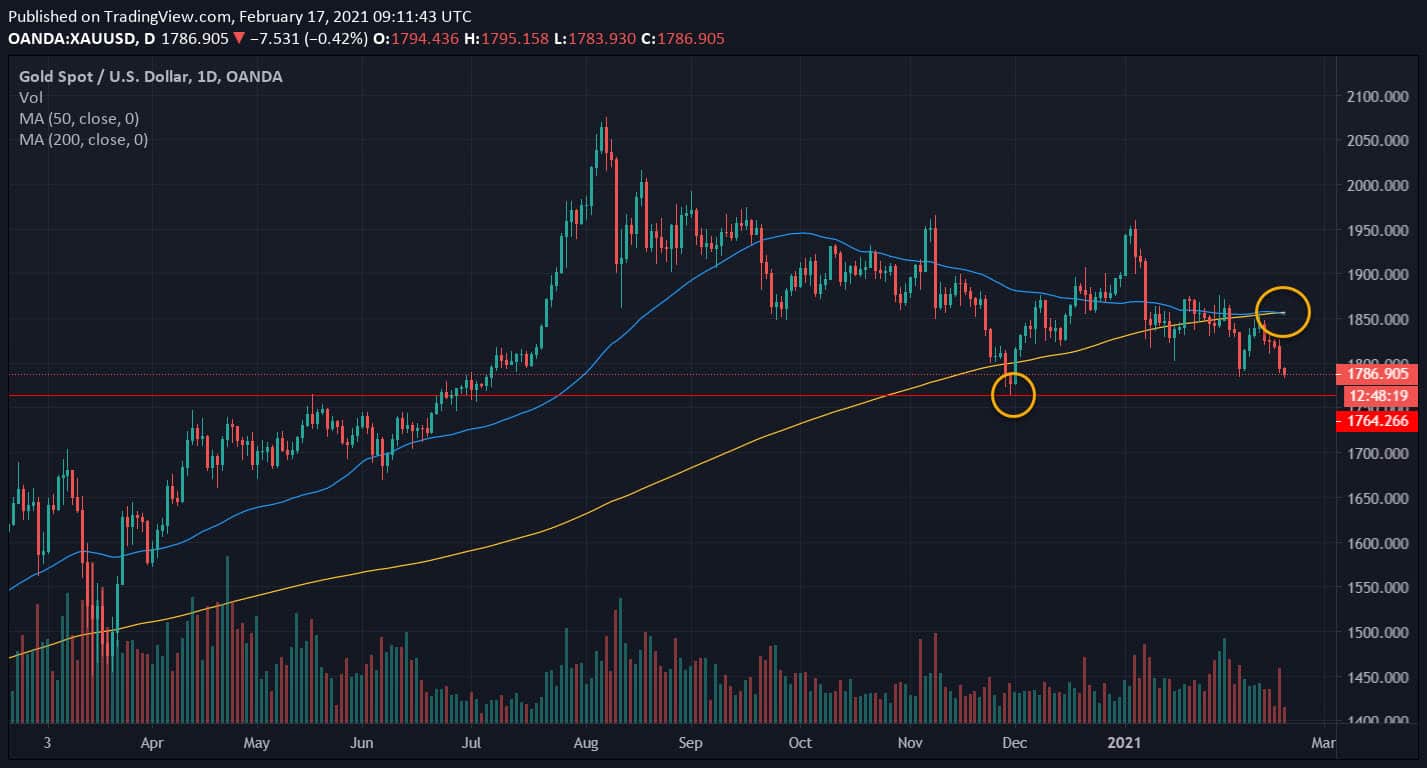
Looking at the gold daily chart we can see that a bearish ‘death cross’ pattern (50 period moving average crossing below the 200 period moving average) is forming and that prices are falling for a fifth consecutive session. The next key level of potential support lies at the prior low of $1,763. Markets now look to the US retail sales report and the minutes of the Federal Reserve’s January monetary policy meeting.
The EUR/USD lost 0.19% intraday amid positive US data. A bearish engulfing candlestick has been formed on the daily chart, which casts doubt on the growth of the pair in the short term. In the credit market, the bond yield spread widened significantly in favor of the US dollar, and the southern pullback may continue for some time.
Trading recommendations
Support levels: 1.2081, 1.2059
Resistance levels: 1.2155, 1.2189
The main trading scenario for the EUR/USD is trading in a sideways range between 1.2081 – 1.2125. The pair’s decline was stopped near the support level, which allows us to expect another northern bounce. The same is indicated by the ADX, which has reacted very weakly to the southern impulse. At the same time, the position of the MACD and moving averages indicates selling within the range as safer trades.
Alternative scenario: if the price consolidates below the level of 1.2081, the pair may continue to decline to 1.2059. A breakthrough of 1.2125 could bring the pair back to 1.2155.
News feed for 2021.02.17:
– The US Core Retail Sales (m/m) (Jan) at 15:30 (GMT+2);
– The Publication of the FOMC minutes at 21:00 (GMT+2).
The GBP/USD currency pair
Technical indicators of the currency pair:
Prev Open: 1.3901
Prev Close: 1.3898
% chg. over the last day: -0.02%
The sterling showed only a symbolic decline after the publication of data in the US on Tuesday. However, the northern trend is slowing down. A doji candlestick has formed on the daily chart, which is a signal of a stop of the movement or a possible price reversal.
Trading recommendations
Support levels: 1.3775, 1.3680
Resistance levels: 1.3950, 1.4000
The main scenario for the GBP/USD is trading sideways between 1.3860 – 1.3950. On the hourly timeframe, there are signs of the price stopping with the likelihood of further decline. The ADX reacted significantly to the southern impulse on Tuesday, suggesting the emergence of bearish strength in the pair. But until the price breaks below the SMA 100, the pair may remain in the range.
Alternative scenario: if the pair consolidates below 1.3860, it may return to 1.3775. A breakthrough of 1.3950 will resume growth.
News feed for 2021.02.17:
– The UK Consumer Prices Index (CPI) (y/y) (Jan) at 09:00 (GMT+2).
The USD/JPY currency pair
Technical indicators of the currency pair:
Prev Open: 105.35
Prev Close: 106.03
% chg. over the last day: +0.66%
On Tuesday, the dollar-yen pair showed the largest daily gain since January 7. The pair continues to catch up with the stock market, with which it usually correlates to a large extent. The rise in government bond yields is also helping to depreciate the Japanese yen.
Trading recommendations
Support levels: 105.10, 104.40
Resistance levels: 106.12, 106.55
The main scenario is buying. On Tuesday, northern momentum indicated strengthening bullish pressure. The moving averages show a sharper upward trajectory. But the ADX is already close to the overbought area, which indicates the likelihood of a stop.
An alternative scenario implies the price-fixing below 105.60. In this case, the pair may go for a correction to 105.10.
News feed for 2021.02.17:
– The US Core Retail Sales (m/m) (Jan) at 15:30 (GMT+2);
– The Publication of the FOMC minutes at 21:00 (GMT+2).
The USD/CAD currency pair
Technical indicators of the currency pair:
Prev Open: 1.2636
Prev Close: 1.2686
% chg. over the last day: +0.40%
The pair bounced off January lows, pointing to strong support around 1.2590. Corrective growth was supported by positive data in the US and a southern pullback in the oil market. However, there are no fundamental reasons for a price reversal. The growth can still be used to build up short positions.
Trading recommendations
Support levels: 1.2590, 1.2550
Resistance levels: 1.2763, 1.2781
The main scenario is buying. The ADX and the MACD have sharply changed the position. The potential trend has reversed to the north and indicates an upward direction as true. As long as the price is above the moving averages, growth may continue but will be limited by the first resistance level. The south trend can be expected to resume at any moment.
Alternative scenario: if the price manages to consolidate below 1.2679, the pair may resume its decline to the level of 1.2590.
News feed for 2021.02.17:
– The US Core Retail Sales (m/m) (Jan) at 15:30 (GMT+2);
– The Canada Core Consumer Price Index (CPI) (m/m) (Jan) at 15:30 (GMT+2);
– The Publication of the FOMC minutes at 21:00 (GMT+2).
This article reflects a personal opinion and should not be interpreted as an investment advice, and/or offer, and/or a persistent request for carrying out financial transactions, and/or a guarantee, and/or a forecast of future events.
– Hi everyone, it’s me Neil Szczepanski again and I’m back to finish off telling you why I love to trade options! If you missed the first half of this article entitled “5 Reasons Why People Prefer To Trade Options Over Stocks” then click on the title to revisit it. In this second and final installment, I will walk through how adjustments and risk management of options can help give you better control of your trades and profits. I hope everyone enjoys the information and I look forward to helping everyone win with options trading!
REDUCE RISK
Everyone has heard a story about someone who mischaracterized or misunderstood their options trade, then having their account blow up when the underlying stock goes the wrong way. This happened recently with a Robinhood trader who woke up one morning to see his account at -$730,165. In this tragic event the kid took his life because he thought he had lost $730,165 and couldn’t reach his brokerage to understand his account. We learned later that the negative balance did not represent uncollateralized indebtedness at all, but rather his temporary balance until the stocks underlying his assigned options actually settled into his account. In short it was a delay in processing of the options contracts in his account, and not the actual trade that went awry. This is why it is very important that in this game of trading you get the proper training so you understand your risk. The risk is real.
So how can options be less risky? Simple: because you can define your risk right at the outset of the trade. Further, you can adjust your risk/reward ratio 24/7, and not just during market hours with a stop loss like stocks. In very volatile markets risk management becomes even more important and your exposure to unlimited risk can destroy your account very quickly. Think back to the tech bubble in 2002, or the subprime mortgage crisis, and don’t forget the consequneces of the great recession. Or even the Covid-19 pandemic of 2020! The most successful traders are good at maximizing their winners, but more importantly, they are even better at minimizing their losses on losing trades. This includes making sure you prepare for black swan events.
One of the questions I always get is how do you control and/or manage your risk with options? In the following diagram, you can see that if you use options around your existing positions you can cap your max loss at about $7. To achieve this, the trade-off is to cap your upside at about $13. In this scenario, we own stock the orange line represents this. Let’s assume the price is $110 so the profit is about $3. We sell a call to pay for a put that we buy. So the max profit in the line created by selling the call and the max loss is defined by the buying of the put. This is called collaring your stock position using stock options. As I mentioned this trade is on 24/7 and not just during market hours like a stop for stocks.
FLEXIBILITY TO REACT TO MARKET VOLATILITY
You don’t need to always be right on direction. With options, you can put on a position and adjust and move with the market minimizing your losses or turning a losing trade into a winning trade. You can sell premium with options and make money even when the underline stock goes nowhere. You get paid for the time by selling the rights to the stock that you can either own or not own. With stocks it is more limiting, you can either buy more or sell and take your loss if the price goes against you, that’s it.
If you are trading options you have way more flexibility than stock. With stock you can buy, sell short and buy more. I hate adding to a losing position and quite frankly not sure why anyone would do that. With options you can roll out of a leg in your option spread and adjust to where the market is going. Think of this as steering a boat through a series of rocks rather than just running them over and damaging the ship. You control where you want to go and avoid the disasters. You can also turn losing positions into winning ones by adjusting. With my new Options Trading Signals newsletter (“OTS”) we will go through these steps and show how you can create winning positions or minimize your losses in ways that is simply not possible with stocks.
CONSISTENT RETURNS WITH less severe DRAWDOWNS
Consistent returns and less dramatic drawdowns can be achieved with an options strategy rather than a just buying stock strategy. I usually only allocate 50% or less of my overall account into options positions yet achieve better returns than if I were to invest 100% into stocks. I also don’t have nearly the same levels of drawdowns, or the sudden trend reversal risk, that one would take by being 100% in stocks. Holding cash also allows me to capitalize on opportunities like if a black swan event. When such an event does eventually hit, I have cash available to buy in while all stocks are on sale. So, I can still get a better return, with fewer drawdowns, and with cash to be ready to jump on buying opportunities. One can get all of the best of all worlds!
I am really excited about sharing my knowledge and strategies with you. I will be writing another article this week that walks you through my simple strategy to consistently generate profits from the market. I will be walking through a few trades with you so make sure you don’t miss out.
Selling options is the best way to get consistent returns that are undeniable and consistent. Nothing in the market is guaranteed except the premium you sell on an options contract. The best part about selling premium is the stock can go against you, with you, or do nothing and you can profit on any of those scenarios. Today’s current market conditions are RIPE for selling premium since there are many new options traders piling into the market, buying options, and inflating the premium on options. This is a supply and demand game and because the demand is high and the supply is low this is creating a premium price skew to the upside.
This is clearly an edge we can take advantage of but in order to do so, you must understand how the market works and more importantly how options work. My new OTS service will detail our weekly trades and walk you through how to take advantage of this edge.
To further my point that options can simply provide better returns, let us look at the below Silver chart to see why buy and hold is a tough game to play. If you entered Silver in August 2020 at roughly $25, then you would have zero gains 7 months later if you had bought the stock. However had you sold a Put Option at $24 for 7 months it would have expired worthless and paid you the entire premium that you sold it for. Currently, an option contract 7 months out on Silver is trading at $296 at the time of this article being written, so, this trade would have netted a $256 gain even though the underlying SLV stock went absolutely nowhere.
If you want to learn more about options, then join me in March when I will start teaching basic options trading, as well as offering courses on more advanced strategies. Anyone can learn how options work but the most important thing is what strategy you use. You also need to know how and when to use the right strategy. I love teaching people how to trade options and live by two principles when doing so: “Trading can be simple but it is not easy” and “I want EVERYONE to win not just me and in fact, I have no desire to win if everyone else loses.”. I am really excited to get to know some of you soon when I launch my LIVE options courses and get you on the path to winning trades!
I will also be running The Technical Traders’ new service – Options Trading Signals – where I will share my knowledge, model portfolio, a weekly trade, and opportunities report, and trade alerts with subscribers. Look for the launch of my newsletter and courses at the end of February! Make sure you sign up to keep informed of the launch of my newsletter and courses. You can sign up now at www.thetechnicaltraders.com/options-trading.
The largest retailer in the US is due to announce its latest quarterly results before US markets open on Thursday, 18 February.
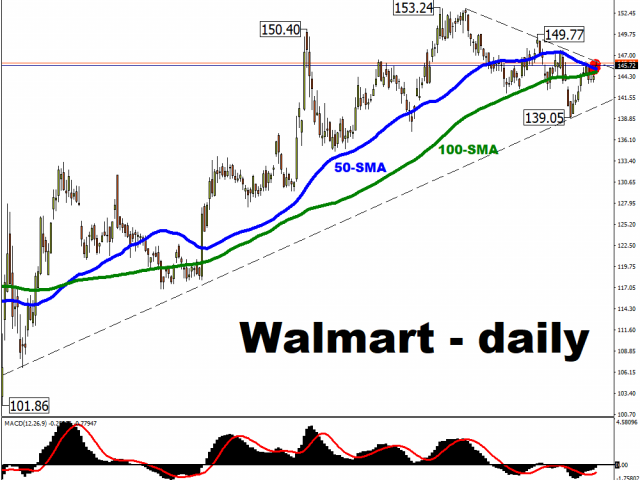
In the lead up to the earnings announcement, Walmart’s share prices have breached the resistance that had been offered by its 50-day simple moving average (SMA). Walmart’s share prices must climb back above its January high of $149.77 in order to send a strong message to markets that it can arrest its downward trend from the past couple of months.
With its 50-SMA is now threatening to cross below its 100-day counterpart, this stock is in need of a positive catalyst to prevent a significant widening of the 4.67% gap from its highest-ever closing price of $152.79 which was registered on 30 November.
What are analysts expecting for Walmart’s Q4 results?
For the three months ending 31 January, markets are expecting a 4.7% year-on-year growth to Walmart’s top line, even as quarterly revenue moves closer to that psychologically-important $150 billion mark.
Its earnings per share (EPS) for the period is slated to come in at $1.50, which would mark an 8.3% increase compared to the fourth quarter of its 2020 fiscal year.
Same-store sales in the US may have increased by 5%, which is about half of the growth seen in its fiscal first quarter (February-April), as the pandemic tailwinds taper off.
A digital focus amid the pandemic
Walmart’s e-commerce sales are expected to have surged by 66%, as the retail behemoth focuses on its omnichannel push. With the pandemic having driven consumers to purchasing their groceries online, coupled with shoppers being more budget-conscious amid the economic uncertainty, that should serve as a major boost to its digital revenue streams.
That should help propel Walmart’s net income for its entire 2021 fiscal year to a record high of $17.9 billion for the 12 months ending 31 January.
How do Walmart stocks tend to react on earnings day?
Market participants are already pricing in a single-day absolute move of 4.06% for Thursday. Over the past decade, the stock has averaged a 3.08% absolute move (either upwards or downwards) on earnings day.
However, note that Walmart’s stock has fallen after 4 out of the past 5 earnings announcements, suggesting that shareholders tend to indulge in some profit-taking on the day.
What other key factors/events are moving Walmart’s share price?
The sale of TikTok’s US operations appears to have hit a snag, after the Biden administration said that the deal is still being reviewed. The plan was for a group which includes Walmart to make the acquisition, allowing the mega retailer to leverage on TikTok’s user base and boost Walmart’s digital reach to consumers (imagine buying groceries via social media). Should this plan be officially declared dead, that could prompt the unwinding of some of Walmart’s gains, as markets dampen their optimism surrounding the retailer’s social-media synergies.
The Department of Justice’s lawsuit against Walmart regarding alleged opioid dispensing violations may result in a financial settlement totalling hundreds of millions of dollars, even though the DOJ is seeking civil penalties in the billions. For context, back in December, the US government accused Walmart of contributing to the opioid crisis by unlawfully dispensing and distributing prescription opioids via Walmart’s 5000 in-store pharmacies. This nationwide lawsuit comes on top of the more than 2,000 suits brought by states, cities, and counties that are contending with the fallout of the opioid crisis. The risk of such a financial hit may dampen the stock’s upside, even as observers await the trial’s commencement, which is slated for October 2021.
Although the conclusion to either the TikTok acquisition or DOJ lawsuit appears far off at this juncture, it could still cast a cloud over Walmart’s share prices in the interim.
Walmart bulls are likely to focus on the company’s fundamentals, especially its push into the digital and fintech realms, in order to keep the stock’s uptrend intact.
Disclaimer: The content in this article comprises personal opinions and should not be construed as containing personal and/or other investment advice and/or an offer of and/or solicitation for any transactions in financial instruments and/or a guarantee and/or prediction of future performance. ForexTime (FXTM), its affiliates, agents, directors, officers or employees do not guarantee the accuracy, validity, timeliness or completeness, of any information or data made available and assume no liability as to any loss arising from any investment based on the same.
The global rally of equities discontinued on Tuesday, despite the continued growth in bond yields. The strategists of large banks have a suspicion that a correction in risky assets is approaching. For example, Citigroup expects a 10% pullback in US stocks, which seems highly probable as the markets are balanced on a risk-reward basis.
But no one expects a sharp fall. The market continues to remain optimistic, as the economy is gradually emerging from the recession, and the soft monetary policy will support bulls on the stock markets for at least another year.
The positive data from the US manufacturing sector continue to be received. The NY Empire State Manufacturing Index increased the most in February in five months to 12.1 from 3.5 a month earlier. This was mainly due to the rise in prices for raw materials from 12.3 to 57.8. The Producer Price Index increased by 8.2 to 23.4, both values are the highest since May 2011. More and more manufacturers expect higher raw material costs and the continued growth in producer prices over the next six months. In addition, new orders increased from 6.6 to 10.8 and the employment rate increased slightly too. Optimism about economic conditions in the next six months among manufacturers increased to 34.9 from 31.9 earlier.
Against this background, the American dollar moved to strengthening. Treasury yields were at their highest level since February last year, reaching 1.33%.
There is also positive data from Germany. The ZEW Indicator of Economic Sentiment increased by 9.4 points this month reaching 71.2 compared to the previous month, well above market forecasts. This is the highest indicator since September as markets are optimistic about the future of the German economy, which is expected to return to growth over the next six months. In particular, a significant recovery in consumption and retail trade is expected, accompanied by higher inflationary expectations. But at the same time, the index of current conditions fell to -67.2 from -66.4, indicating a slow recovery at the beginning of the year.
Main market quotes:
S&P 500 (F) 3,928.12 +0.37 (+0.01%)
Dow Jones 31,522.75 +64.35 (+0.20%)
DAX 14,018.55 -46.05 (-0.33%)
FTSE 100 6,728.85 -20.01 (-0.30%)
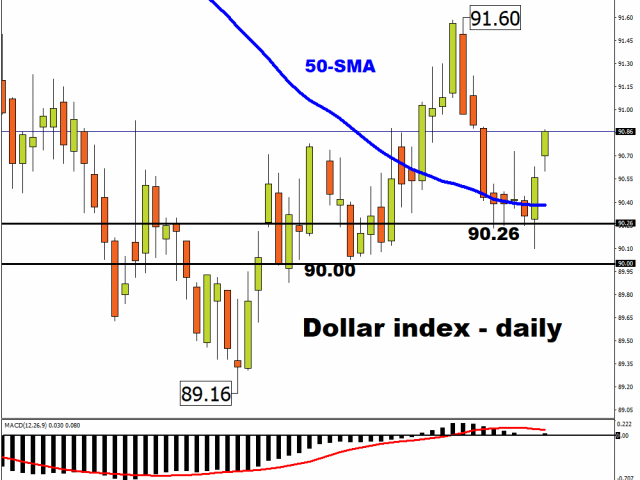
USD Index 90.737 +0.234 (+0.26%)
Important events:
– UK Consumer Price Index (y/y) (Jan) at 09:00 (GMT+2);
– US Core Retail Sales (m/m) (Jan) at 15:30 (GMT+2);
– Canada Core Consumer Price Index m/m) (Jan) at 15:30 (GMT+2);
– Publication of the FOMC minutes at 21:00 (GMT+2).
This article reflects a personal opinion and should not be interpreted as an investment advice, and/or offer, and/or a persistent request for carrying out financial transactions, and/or a guarantee, and/or a forecast of future events.
While we pause for breath in equity markets, bond markets continue to grab the attention of Wall Street with US 10-year yields pushing up above 1.30% which is almost pre-Covid.
The return in real yields is an important issue here as this means markets are getting more optimistic about economic growth expectations.
But the pace of the bond market sell-off too is worrying as we’ve gone from 1.1% to 1.3% in just three days, and if this continues, then risk markets will do an about-turn very sharply.
Focus is increasingly on the US Federal Reserve to provide some reassurance that it won’t seek to tighten its monetary polices and measures more aggressively than the market thinks, in the face of faster inflation. Overnight, a couple of Fed members struck a dovish tone (phew!) dismissing fears of policy tightening and emphasising how it would harm job creation.
Nothing new in the FOMC Minutes
Talking of the Fed, we get to see the minutes of the January meeting later today.
Remember that while the bigger forecast upgrades were seen in the December meeting, last month’s rendez-vous delivered small statement changes that sounded a bit more optimistic. Expectations are for these minutes to repeat that it’s premature to talk about tapering just yet and that the Fed will be patient in assessing progress toward full employment and its overshoot of 2% inflation for “some time”. As is the way with such fast moving times regarding the pandemic, the minutes may be a bit stale with regard to both fiscal policy and vaccines amid more positive expectations since the meeting.
The pick of today’s economic data releases will be the US January retail sales.
Data has surprised to the upside everywhere on a regular basis in recent months and consumer spending numbers are expected to turn much higher too, following a very weak December. Headline sales should print north of 1% helped by firm auto sales, while the control group, used for GDP purposes and seen as a more reliable gauge of underlying consumer demand, is set for a strong rebound.
Along with today’s industrial production, the data should continue the recent trend of US outperformance among developed nations, with the momentum in forecasts remaining robust. This should mean a continuation in the reflation story, albeit potentially at slower pace in rising yields, as the bar for a hawkish surprise with the “stale” minutes especially, is set quite high.
With the bond market fragile, the dollar may find some support, which shouldn’t interfere too much with buoyant stock markets.
Disclaimer: The content in this article comprises personal opinions and should not be construed as containing personal and/or other investment advice and/or an offer of and/or solicitation for any transactions in financial instruments and/or a guarantee and/or prediction of future performance. ForexTime (FXTM), its affiliates, agents, directors, officers or employees do not guarantee the accuracy, validity, timeliness or completeness, of any information or data made available and assume no liability as to any loss arising from any investment based on the same.
After an incredible +400% run higher in Berkshire Hathaway’s stock price from the lows of 2009 to the highs of 2018, the share price has spent much of the past few years stuck in a range. In fact, from 2018 to early this year its share price has traded in a consolidation pattern between $232 and $158, as shown in the long-term monthly chart below.
Source: Admiral Markets MetaTrader 5, #BRKB, Monthly – Data range: from Aug 1, 2004, to Feb 16, 2021, performed on Feb 16, 2021, at 8:30 pm GMT. Please note: Past performance is not a reliable indicator of future results.
The 20-period (blue), 50-period (red) and 100-period (green) exponential moving averages still continue to point upwards, confirming the long-term trend is still up. While Berkshire Hathaway’s share price has ranged for quite a few years a technical breakout has now developed.
In the chart above, February’s monthly candle is trading well above the upper resistance level of the range drawn on in the green box. While the month has not yet closed, a strong close above this level could pave the way for further upside. The weekly chart shows the break more clearly below.
Source: Admiral Markets MetaTrader 5, #BRKB, Weekly – Data range: from Jun 11, 2017, to Feb 16, 2021, performed on Feb 16, 2021, at 8:30 pm GMT. Please note: Past performance is not a reliable indicator of future results.
While the breakout of technical resistance is still fresh, traders may wait for the price to pull back and then test the appetite of buyers to purchase more shares at a better price. With breakout trading, there is always the risk the market may present a false breakout with price coming back inside of the consolidation or range.
However, the daily price chart shows there has been recent buying from investors. Most recently buyers stepped in around the 50-day exponential moving average while the MACD histogram is above the 0 level suggesting the momentum to the upside is still strong.
Source: Admiral Markets MetaTrader 5, #BRKB, Daily – Data range: from May 12, 2020, to Feb 16, 2021, performed on Feb 16, 2021, at 8:30 pm GMT. Please note: Past performance is not a reliable indicator of future results.
Berkshire Hathaway stock is certainly one to watch for the future! Did you know that you can use the Trading Central Technical Ideas Lookup indicator to find actionable trading ideas on this index and thousands of other instruments across Forex, stocks, indices, commodities and more?
You can get this indicator completely FREE by upgrading your MetaTrader 5 trading platform provided by Admiral Markets UK Ltd to the exclusive Admiral Markets Supreme Edition! You’ll also receive a whole range of advanced trading tools such as correlation and sentiment indicators!
Start your free download by clicking on the banner below:
INFORMATION ABOUT ANALYTICAL MATERIALS:
The given data provides additional information regarding all analysis, estimates, prognosis, forecasts, market reviews, weekly outlooks or other similar assessments or information (hereinafter “Analysis”) published on the websites of Admiral Markets investment firms operating under the Admiral Markets trademark (hereinafter “Admiral Markets”) Before making any investment decisions please pay close attention to the following:
This is a marketing communication. The content is published for informative purposes only and is in no way to be construed as investment advice or recommendation. It has not been prepared in accordance with legal requirements designed to promote the independence of investment research, and that it is not subject to any prohibition on dealing ahead of the dissemination of investment research.
Any investment decision is made by each client alone whereas Admiral Markets shall not be responsible for any loss or damage arising from any such decision, whether or not based on the content.
With view to protecting the interests of our clients and the objectivity of the Analysis, Admiral Markets has established relevant internal procedures for prevention and management of conflicts of interest.
The Analysis is prepared by an independent analyst, Jitan Solanki (analyst), (hereinafter “Author”) based on their personal estimations.
Whilst every reasonable effort is taken to ensure that all sources of the content are reliable and that all information is presented, as much as possible, in an understandable, timely, precise and complete manner, Admiral Markets does not guarantee the accuracy or completeness of any information contained within the Analysis.
Any kind of past or modeled performance of financial instruments indicated within the content should not be construed as an express or implied promise, guarantee or implication by Admiral Markets for any future performance. The value of the financial instrument may both increase and decrease and the preservation of the asset value is not guaranteed.
Leveraged products (including contracts for difference) are speculative in nature and may result in losses or profit. Before you start trading, please ensure that you fully understand the risks involved.
– One of the big contributors to climate change is right beneath your feet, and transforming it could be a powerful solution for keeping greenhouse gases out of the atmosphere.
Given the scale of the industry and its greenhouse gas emissions, technologies that can reinvent concrete could have profound impacts on climate change.
As engineersworkingon issuesinvolving infrastructure and construction, we have been designing the next generation of concrete technology that can reduce infrastructure’s carbon footprint and increase durability. That includes CO2-infused concrete that locks up the greenhouse gas and can be stronger and even bendable.
The industry is ripe for dramatic change, particularly with the Biden administration promising to invest big in infrastructure projects and cut U.S. emissions at the same time. However, to put CO2 to work in concrete on a wide scale in a way that drastically cuts emissions, all of its related emissions must be taken into account.
Rethinking concrete
Concrete is made up of aggregate materials – primarily rocks and sand – along with cement and water.
Industrial byproducts such as iron slag and coal fly ash are now frequently used to reduce the amount of cement needed. The resulting concrete can have significantly lower emissions because of that change. Alternative binders, such as limestone calcined clay, can also reduce cement use. One study found that using limestone and calcinated clay could reduce emissions by at least 20% while also cutting production costs.
Apart from developing blended cements, researchers and companies are focusing on ways to use captured CO2 as an ingredient in the concrete itself, locking it away and preventing it from entering the atmosphere. CO2 can be added in the form of aggregates – or injected during mixing. Carbonation curing, also known as CO2 curing, can also be used after concrete has been cast.
These processes turn CO2 from a gas to a mineral, creating solid carbonates that may also improve the strength of concrete. That means structures may need less cement, reducing the amount of related emissions. Companies such as CarbonCure and Solidia have developed technologies to use these processes for concrete poured at construction sites and in precast concrete, such as cinder blocks and other construction materials.
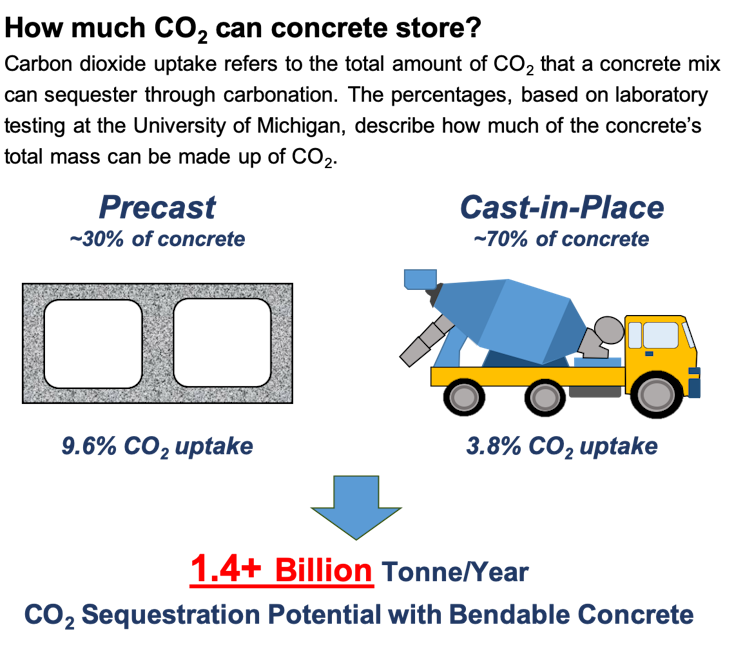
Carbon dioxide can make up a significant percentage of concrete mass. Lucca Henrion/University of Michigan, CC BY-NDThe Kitahama building, the tallest residential tower in Japan, is built with bendable concrete for earthquake resistance. MC681/Wikimedia Commons
At the University of Michigan, we are working on composites that produce a bendable concrete material that allows thinner, less brittle structures that require less steel reinforcement, further reducing related carbon emissions. The material can be engineered to maximize the amount of CO2 it can store by using smaller particles that readily react with CO2, turning it to mineral.
The CO2-based bendable concrete can be used for general buildings, water and energy infrastructure, as well as transportation infrastructure. Bendable concrete was used in the 61-story Kitahama tower in Osaka, Japan, and roadway bridge slabs in Ypsilanti, Michigan.
The challenge of lifecycle emissions
These cutting-edge technologies can start addressing concrete infrastructure’s carbon footprint, but barriers still exist.
In a study published Feb. 8, three of us looked at the lifecycle emissions from infusing CO2 into concrete and found that estimates did not always account for emissions from CO2 capture, transportation and use. With colleagues, we came up with strategies for ensuring that carbon curing has a strong emissions benefit.
Overall, we recommend developing a standard CO2 curing protocol. Lab experiments show that CO2 curing can improve concrete’s strength and durability, but results vary with specific curing procedures and concrete mixes. Research can improve the conditions and the timing of steps in the curing process to increase concrete’s performance. Electricity use – the largest emissions source during curing – can also be reduced by streamlining the process and possibly by using waste heat.
Advanced concrete mixes, bendable concrete in particular, already begin to address these issues by increasing durability.
Merging infrastructure and climate policy
In 2020, a wide range of companies announced steps to reduce their emissions. However, government investment and procurement policies are still needed to transform the construction industry.
In New York and New Jersey, lawmakers have proposed state-level policies that would provide price discounts in the bidding process to proposals with the lowest emissions from concrete. These policies could serve as a blueprint for reducing carbon emissions from concrete production and other building materials.
Nationally, the crumbling of federally managed infrastructure has been a steadily growing crisis. The Biden administration could start to address those problems, as well as climate change, and create jobs through a strategic infrastructure program.
Secretary of Transportation Pete Buttigieg recently declared that there were “enormous opportunities for job creation, equity and climate achievement when it comes to advancing America’s infrastructure.” Policies that elevate low-carbon concrete to a nationwide climate solution could follow.











 Article by