
Gold prices extended their losses in early trading on Wednesday, pressured by rising bond yields and a firmer US dollar. On Tuesday, the US 10-year Treasury yield reached a level not seen since February 2020, while the US dollar index bounced back from a three-week low.
The rise in bond interest rates has been spurred by the optimistic outlook in the market, amid positive news on COVID-19 vaccine rollouts and the $1.9 trillion US stimulus package. Rising bond yields make non-yielding assets such as gold a less appealing investment.
The mandatory Securities and Exchange Commission’s (SEC) 13F filing of BlackRock, the world’s largest asset manager, revealed that it is exiting gold and buying silver. The filing showed that in the fourth quarter of 2020 BlackRock sold 2.7 million SPDR Gold Shares (GLD) and bought 1.18 million shares of iShares Silver Trust (SLV).
Meanwhile, Bitcoin, the asset increasingly touted as ‘digital gold’, crossed the mega psychological level of $50,000 in Tuesday trading. The latest surge came as large companies including Tesla, Mastercard and BNY Mellon showed support for cryptocurrencies.
Peter Schiff, notable gold bull and CEO of Euro Pacific Capital tweeted: “Now that #Bitcoin has hit $50,000 I must admit that a move up to $100,000 can’t be ruled out. However a move down to zero can’t be ruled out either. While a temporary move up to $100K is possible, a permanent move down to zero is inevitable. If you don’t want to gamble buy #gold.”
Free Reports:
 Get our Weekly Commitment of Traders Reports - See where the biggest traders (Hedge Funds and Commercial Hedgers) are positioned in the futures markets on a weekly basis.
 Download Our Metatrader 4 Indicators – Put Our Free MetaTrader 4 Custom Indicators on your charts when you join our Weekly Newsletter
Holger Zschäpitz, Senior Editor at the Economic and Financial desk of the German daily Die Welt pointed out the stark difference in the two assets, tweeting: “#Bitcoin is eating Gold in one chart! Gold/Bitcoin ratio hit a fresh All-Time low.”
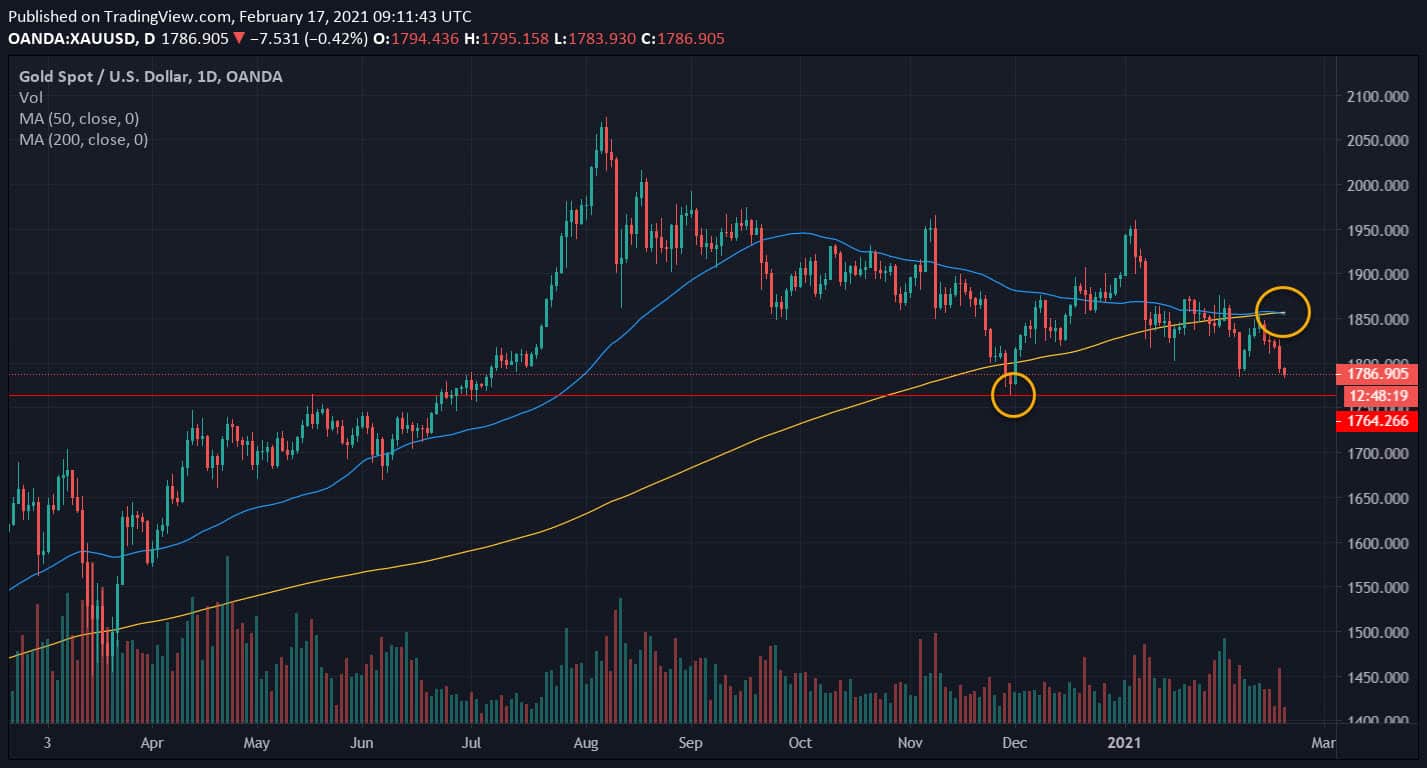
Looking at the gold daily chart we can see that a bearish ‘death cross’ pattern (50 period moving average crossing below the 200 period moving average) is forming and that prices are falling for a fifth consecutive session. The next key level of potential support lies at the prior low of $1,763. Markets now look to the US retail sales report and the minutes of the Federal Reserve’s January monetary policy meeting.
By Dan Blystone, TradersLog.com

- Australian trade balance returned to positive territory Aug 6, 2026
- Results in Line for Most Reporting Companies Aug 5, 2026
- Stock indices continue to break records. Oil is falling amid intensified diplomatic dialogue between the US and Iran Aug 5, 2026
- USD/JPY Holds Steady After Intervention: Outlook Remains Uncertain Aug 5, 2026
- EUR/USD: Busy Week Ahead Aug 3, 2026
- Positive sentiment in the AI sector supported stock indices. Oil prices remain volatile Aug 3, 2026
- The Tech‑heavy NASDAQ Index jumped by more than 3.3%. The offshore yuan is trading at its highest level since 2023 Jul 31, 2026
- USD/JPY After Volatility: Multiple Events in One Day Jul 31, 2026
- The US indices sell off amid renewed US-Iran clashes. Oil jumps by 7% Jul 30, 2026
- USD/JPY Temporary in Equilibrium: Multiple Factors in Focus Jul 30, 2026
