
By InvestMacro

Here are the latest charts and statistics for the Commitment of Traders (COT) data published by the Commodities Futures Trading Commission (CFTC).
The latest COT data is updated through Tuesday May 20th and shows a quick view of how large traders (for-profit speculators and commercial entities) were positioned in the futures markets.
Weekly Speculator Changes led by Platinum & Gold

The COT metals markets speculator bets were overall higher this week as four out of the six metals markets we cover had higher positioning while the other two markets had lower speculator contracts.
Leading the gains for the metals was Platinum (8,080 contracts) with Gold (2,772 contracts), Silver (2,288 contracts) and Palladium (2,109 contracts) also showing positive weeks.
The market leading the declines in speculator bets for the week was Steel (-618 contracts) and with Copper (-484 contracts) also registering lower bets on the week.
Metals Data:

Legend: Weekly Speculators Change | Speculators Current Net Position | Speculators Strength Score compared to last 3-Years (0-100 range)
Strength Scores led by Silver & Steel

COT Strength Scores (a normalized measure of Speculator positions over a 3-Year range, from 0 to 100 where above 80 is Extreme-Bullish and below 20 is Extreme-Bearish) showed that Silver (79 percent) and Steel (73 percent) lead the metals markets this week.
On the downside, Gold (42 percent) and Palladium (42 percent) come in at the lowest strength level currently.
Strength Statistics:
Gold (42.5 percent) vs Gold previous week (41.4 percent)
Silver (79.4 percent) vs Silver previous week (76.5 percent)
Copper (52.8 percent) vs Copper previous week (53.3 percent)
Platinum (57.1 percent) vs Platinum previous week (38.0 percent)
Palladium (41.8 percent) vs Palladium previous week (25.9 percent)
Steel (73.1 percent) vs Palladium previous week (76.1 percent)
Platinum & Palladium top the 6-Week Strength Trends

COT Strength Score Trends (or move index, calculates the 6-week changes in strength scores) showed that Platinum (43 percent) and Palladium (18 percent) lead the past six weeks trends for metals.
Gold (-14 percent) leads the downside trend scores currently with Steel (-11 percent) as the next market with lower trend scores.
Move Statistics:
Gold (-14.0 percent) vs Gold previous week (-29.3 percent)
Silver (4.5 percent) vs Silver previous week (-12.0 percent)
Copper (-3.0 percent) vs Copper previous week (-7.9 percent)
Platinum (43.0 percent) vs Platinum previous week (-13.4 percent)
Palladium (17.8 percent) vs Palladium previous week (-19.5 percent)
Steel (-10.5 percent) vs Steel previous week (-9.0 percent)
Individual Markets:
Gold Comex Futures:
 The Gold Comex Futures large speculator standing this week equaled a net position of 163,981 contracts in the data reported through Tuesday. This was a weekly gain of 2,772 contracts from the previous week which had a total of 161,209 net contracts.
This week’s current strength score (the trader positioning range over the past three years, measured from 0 to 100) shows the speculators are currently Bearish with a score of 42.5 percent. The commercials are Bullish with a score of 51.2 percent and the small traders (not shown in chart) are Bullish-Extreme with a score of 100.0 percent.
Price Trend-Following Model: Uptrend
Our weekly trend-following model classifies the current market price position as: Uptrend.
| Gold Futures Statistics | SPECULATORS | COMMERCIALS | SMALL TRADERS |
| – Percent of Open Interest Longs: | 53.1 | 20.1 | 12.1 |
| – Percent of Open Interest Shorts: | 16.5 | 64.3 | 4.6 |
| – Net Position: | 163,981 | -197,648 | 33,667 |
| – Gross Longs: | 238,062 | 90,256 | 54,053 |
| – Gross Shorts: | 74,081 | 287,904 | 20,386 |
| – Long to Short Ratio: | 3.2 to 1 | 0.3 to 1 | 2.7 to 1 |
| NET POSITION TREND: | |||
| – Strength Index Score (3 Year Range Pct): | 42.5 | 51.2 | 100.0 |
| – Strength Index Reading (3 Year Range): | Bearish | Bullish | Bullish-Extreme |
| NET POSITION MOVEMENT INDEX: | |||
| – 6-Week Change in Strength Index: | -14.0 | 12.4 | 8.6 |
Silver Comex Futures:
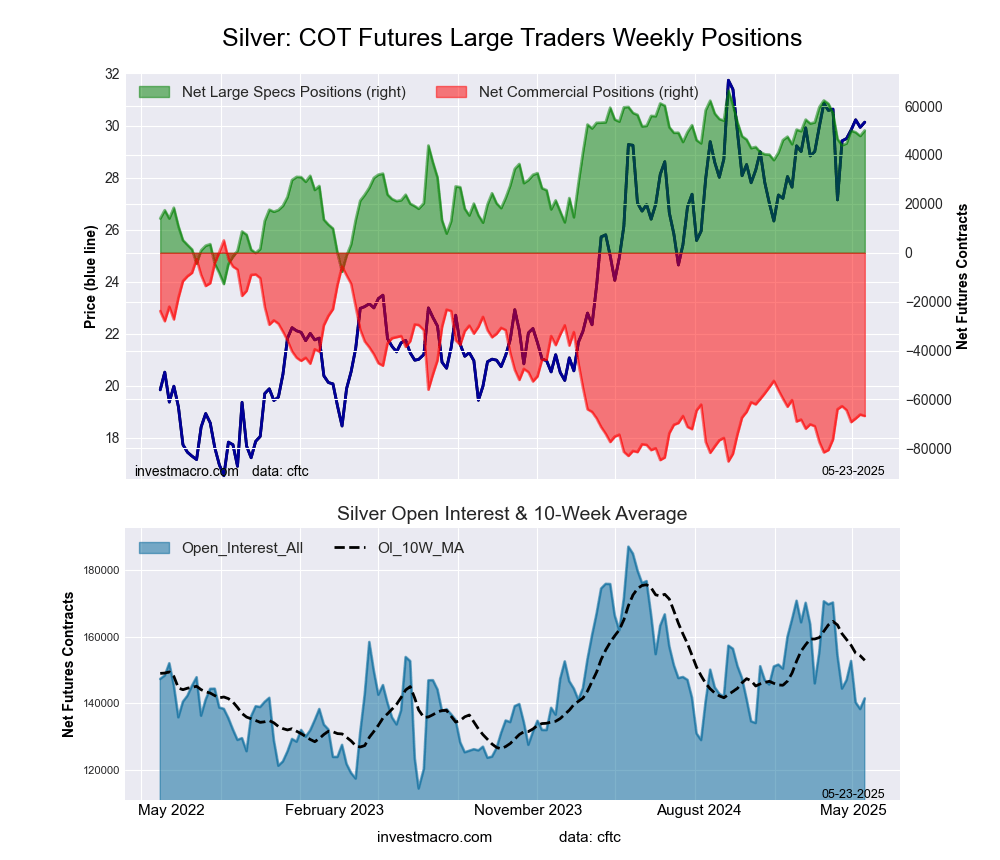 The Silver Comex Futures large speculator standing this week equaled a net position of 50,042 contracts in the data reported through Tuesday. This was a weekly boost of 2,288 contracts from the previous week which had a total of 47,754 net contracts.
This week’s current strength score (the trader positioning range over the past three years, measured from 0 to 100) shows the speculators are currently Bullish with a score of 79.4 percent. The commercials are Bearish with a score of 20.5 percent and the small traders (not shown in chart) are Bullish with a score of 51.6 percent.
Price Trend-Following Model: Strong Uptrend
Our weekly trend-following model classifies the current market price position as: Strong Uptrend.
| Silver Futures Statistics | SPECULATORS | COMMERCIALS | SMALL TRADERS |
| – Percent of Open Interest Longs: | 50.1 | 23.9 | 19.0 |
| – Percent of Open Interest Shorts: | 14.7 | 71.1 | 7.1 |
| – Net Position: | 50,042 | -66,779 | 16,737 |
| – Gross Longs: | 70,891 | 33,798 | 26,826 |
| – Gross Shorts: | 20,849 | 100,577 | 10,089 |
| – Long to Short Ratio: | 3.4 to 1 | 0.3 to 1 | 2.7 to 1 |
| NET POSITION TREND: | |||
| – Strength Index Score (3 Year Range Pct): | 79.4 | 20.5 | 51.6 |
| – Strength Index Reading (3 Year Range): | Bullish | Bearish | Bullish |
| NET POSITION MOVEMENT INDEX: | |||
| – 6-Week Change in Strength Index: | 4.5 | -3.0 | -3.7 |
Copper Grade #1 Futures:
 The Copper Grade #1 Futures large speculator standing this week equaled a net position of 21,038 contracts in the data reported through Tuesday. This was a weekly decrease of -484 contracts from the previous week which had a total of 21,522 net contracts.
This week’s current strength score (the trader positioning range over the past three years, measured from 0 to 100) shows the speculators are currently Bullish with a score of 52.8 percent. The commercials are Bullish with a score of 50.3 percent and the small traders (not shown in chart) are Bearish with a score of 32.2 percent.
Price Trend-Following Model: Uptrend
Our weekly trend-following model classifies the current market price position as: Uptrend.
| Copper Futures Statistics | SPECULATORS | COMMERCIALS | SMALL TRADERS |
| – Percent of Open Interest Longs: | 33.6 | 31.5 | 6.9 |
| – Percent of Open Interest Shorts: | 23.4 | 42.9 | 5.7 |
| – Net Position: | 21,038 | -23,423 | 2,385 |
| – Gross Longs: | 69,015 | 64,580 | 14,164 |
| – Gross Shorts: | 47,977 | 88,003 | 11,779 |
| – Long to Short Ratio: | 1.4 to 1 | 0.7 to 1 | 1.2 to 1 |
| NET POSITION TREND: | |||
| – Strength Index Score (3 Year Range Pct): | 52.8 | 50.3 | 32.2 |
| – Strength Index Reading (3 Year Range): | Bullish | Bullish | Bearish |
| NET POSITION MOVEMENT INDEX: | |||
| – 6-Week Change in Strength Index: | -3.0 | -1.7 | 31.5 |
Platinum Futures:
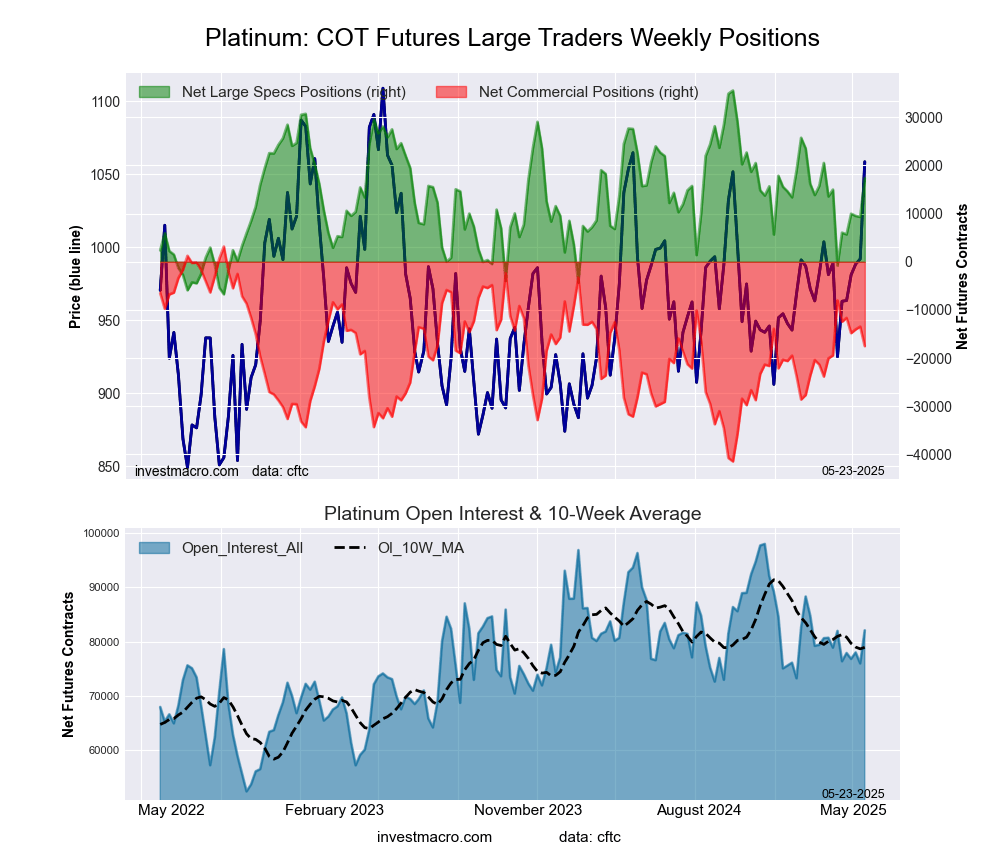 The Platinum Futures large speculator standing this week equaled a net position of 17,396 contracts in the data reported through Tuesday. This was a weekly lift of 8,080 contracts from the previous week which had a total of 9,316 net contracts.
This week’s current strength score (the trader positioning range over the past three years, measured from 0 to 100) shows the speculators are currently Bullish with a score of 57.1 percent. The commercials are Bullish with a score of 53.7 percent and the small traders (not shown in chart) are Bearish-Extreme with a score of 0.0 percent.
Price Trend-Following Model: Strong Uptrend
Our weekly trend-following model classifies the current market price position as: Strong Uptrend.
| Platinum Futures Statistics | SPECULATORS | COMMERCIALS | SMALL TRADERS |
| – Percent of Open Interest Longs: | 61.3 | 20.8 | 9.1 |
| – Percent of Open Interest Shorts: | 40.1 | 42.1 | 9.0 |
| – Net Position: | 17,396 | -17,517 | 121 |
| – Gross Longs: | 50,293 | 17,049 | 7,490 |
| – Gross Shorts: | 32,897 | 34,566 | 7,369 |
| – Long to Short Ratio: | 1.5 to 1 | 0.5 to 1 | 1.0 to 1 |
| NET POSITION TREND: | |||
| – Strength Index Score (3 Year Range Pct): | 57.1 | 53.7 | 0.0 |
| – Strength Index Reading (3 Year Range): | Bullish | Bullish | Bearish-Extreme |
| NET POSITION MOVEMENT INDEX: | |||
| – 6-Week Change in Strength Index: | 43.0 | -21.3 | -100.0 |
Palladium Futures:
 The Palladium Futures large speculator standing this week equaled a net position of -8,352 contracts in the data reported through Tuesday. This was a weekly lift of 2,109 contracts from the previous week which had a total of -10,461 net contracts.
This week’s current strength score (the trader positioning range over the past three years, measured from 0 to 100) shows the speculators are currently Bearish with a score of 41.8 percent. The commercials are Bullish with a score of 55.4 percent and the small traders (not shown in chart) are Bullish with a score of 64.5 percent.
Price Trend-Following Model: Weak Downtrend
Our weekly trend-following model classifies the current market price position as: Weak Downtrend.
| Palladium Futures Statistics | SPECULATORS | COMMERCIALS | SMALL TRADERS |
| – Percent of Open Interest Longs: | 28.4 | 46.5 | 11.9 |
| – Percent of Open Interest Shorts: | 70.0 | 8.6 | 8.2 |
| – Net Position: | -8,352 | 7,622 | 730 |
| – Gross Longs: | 5,712 | 9,344 | 2,386 |
| – Gross Shorts: | 14,064 | 1,722 | 1,656 |
| – Long to Short Ratio: | 0.4 to 1 | 5.4 to 1 | 1.4 to 1 |
| NET POSITION TREND: | |||
| – Strength Index Score (3 Year Range Pct): | 41.8 | 55.4 | 64.5 |
| – Strength Index Reading (3 Year Range): | Bearish | Bullish | Bullish |
| NET POSITION MOVEMENT INDEX: | |||
| – 6-Week Change in Strength Index: | 17.8 | -17.0 | -6.7 |
Steel Futures Futures:
 The Steel Futures large speculator standing this week equaled a net position of -447 contracts in the data reported through Tuesday. This was a weekly decrease of -618 contracts from the previous week which had a total of 171 net contracts.
This week’s current strength score (the trader positioning range over the past three years, measured from 0 to 100) shows the speculators are currently Bullish with a score of 73.1 percent. The commercials are Bearish with a score of 27.9 percent and the small traders (not shown in chart) are Bearish with a score of 40.8 percent.
Price Trend-Following Model: Uptrend
Our weekly trend-following model classifies the current market price position as: Uptrend.
| Steel Futures Statistics | SPECULATORS | COMMERCIALS | SMALL TRADERS |
| – Percent of Open Interest Longs: | 27.5 | 67.1 | 1.0 |
| – Percent of Open Interest Shorts: | 28.7 | 66.1 | 0.8 |
| – Net Position: | -447 | 370 | 77 |
| – Gross Longs: | 10,209 | 24,861 | 362 |
| – Gross Shorts: | 10,656 | 24,491 | 285 |
| – Long to Short Ratio: | 1.0 to 1 | 1.0 to 1 | 1.3 to 1 |
| NET POSITION TREND: | |||
| – Strength Index Score (3 Year Range Pct): | 73.1 | 27.9 | 40.8 |
| – Strength Index Reading (3 Year Range): | Bullish | Bearish | Bearish |
| NET POSITION MOVEMENT INDEX: | |||
| – 6-Week Change in Strength Index: | -10.5 | 10.1 | 8.8 |
Article By InvestMacro – Receive our weekly COT Newsletter
*COT Report: The COT data, released weekly to the public each Friday, is updated through the most recent Tuesday (data is 3 days old) and shows a quick view of how large speculators or non-commercials (for-profit traders) were positioned in the futures markets.
The CFTC categorizes trader positions according to commercial hedgers (traders who use futures contracts for hedging as part of the business), non-commercials (large traders who speculate to realize trading profits) and nonreportable traders (usually small traders/speculators) as well as their open interest (contracts open in the market at time of reporting). See CFTC criteria here.


