By ForexTime
- EURUSD ↑ 3% MTD, trading near 4-year highs
- ECB forum in Sintra + key EU/US data = fresh volatility?
- EURUSD forecasted to move ↑ 0.3% or ↓ 0.7% post NFP
- Bloomberg FX model: EURUSD has 75% of trading within 1.1557 – 1.1880 over 1-week period
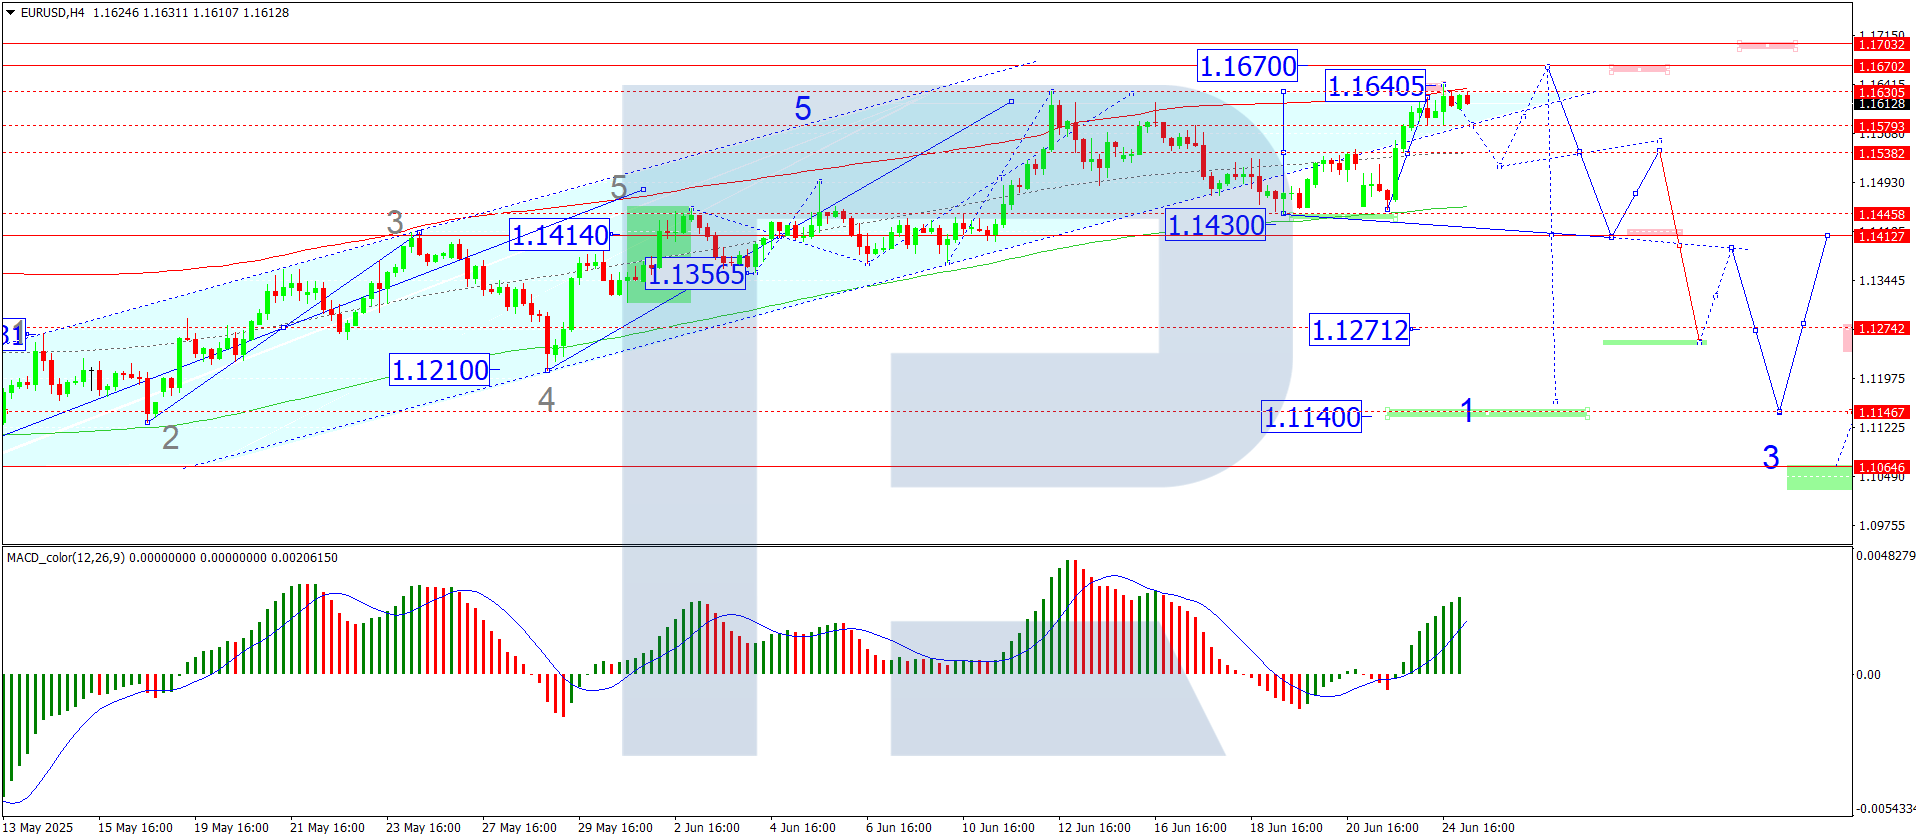
- Technical level: 1.1700
The world’s most-traded FX pair is on a tear, hitting levels not seen since September 2021!
At the time of writing, EURUSD has gained over 3% this month with prices knocking on key resistance at 1.17.
Why is the EURUSD rallying?
A broadly weaker dollar:
- The greenback has been hit by growing bets on a more dovish-leaning Fed amid reports that Trump will announce Powell’s replacement sooner than expected.
- Easing geopolitical tensions in the Middle East also reduced appetite for safe-haven assets, enforcing more pressure on the dollar.
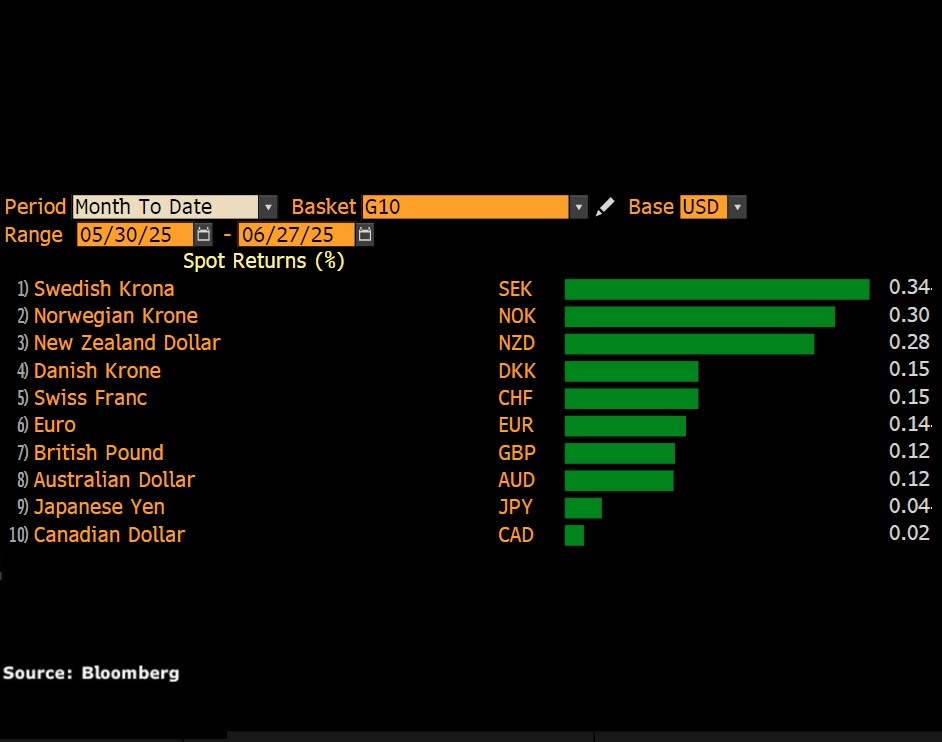
We have seen the dollar not only weaken against the euro but against every single G10 currency month-to-date.
With the dollar under pressure, could this mean more upside for the EURUSD ahead of another event-heavy week?
Monday, 30th June
- CN50: China PMI’s
- GER40: Germany CPI
- JP225: Japan industrial production
- UK100: UK GDP
- US500: Atlanta Fed President Raphael Bostic speech
- ECB Forum on Central Banking in Sintra
Tuesday, 1st July
- CN50: China Caixin manufacturing PMI
- EUR: Germany Manufacturing PMI, Eurozone CPI, ECB President Lagarde speech
- JPY: Japan S&P Global Manufacturing PMI, BOJ Governor Ueda speech
- GBP: UK S&P Global Manufacturing PMI, BOE Governor Bailey speech
- USDInd: US ISM Manufacturing, S&P Global PMI, Fed Chair Powell speech
Wednesday, 2nd July
- AUD: Australia retail sales, building approvals
- CAD: Canada S&P Global Manufacturing PMI
- EUR: Eurozone unemployment
- US400: US ADP employment
- Tesla: Second-quarter vehicle sales figures
Thursday, 3rd July
- AUD: Australia trade
- CN50: China Caixin services PMI
- EUR: Eurozone HCOB Services PMI, ECB meeting minutes
- JPY: Japan S&P Global Services PMI
- USDInd: US June nonfarm payrolls, initial jobless claims
Friday, 4th July
- SG20: Singapore retail sales
- EUR: Eurozone PPI, Germany factory orders
- Senate vote for signing a Republican-backed tax and spending bill.
- US markets closed: Independence Day holiday
Here are 4 key events that could rattle the EURUSD:
1) ECB’s annual forum in Sintra
European Central Bank President Christine Lagarde will kick off the ECB forum with a keynote speech on Monday, 30th June.
Lagarde will be under the spotlight again on Tuesday, with Fed Chair Jerome Powell and other central bank heads discussing “macroeconomic shifts and policy responses”. Should Lagarde or Powell offer any fresh clues about future monetary policy, this could result in heightened volatility on the EURUSD.
2) Eurozone June CPI + data dump
Inflation data from Europe on Tuesday, 1st July could influence expectations around when the ECB will cut interest rates.
Markets are forecasting:
- CPI year-on-year (June 2024 vs. June 2025) is expected to rise 1.9%
- Core CPI year-on-year to remain unchanged at 2.3%
- CPI month-on-month (June 2025 vs May 2025) to rise 0.2% from 0.0%.
EURUSD is forecasted to move as much as 0.4% or decline 0.3% in a 6-hour window post release.
- A softer inflation may fuel speculation around lower rates in Europe, dragging the EURUSD lower.
- A hotter-than-expected inflation report could shave ECB cut bets, resulting in a stronger Euro.
Traders are currently pricing a 55% probability of a 25-basis point ECB cut by September.
Note: Beyond the Eurozone CPI data, it will be wise to keep an eye on the German CPI report, Manufacturing PMI’s, Eurozone unemployment and PPI which may influence the euro.
3) US June nonfarm payrolls (NFP)
Here is what markets predict for the key US jobs report on Thursday 3rd July:
June headline NFP number: 120,000
If so, that would be lower than the 139k new jobs created in May.
June unemployment rate: 4.3%
This would represent a 0.1% increase from the 4.2% in May.
- A weaker-than-expected US jobs report may weaken the dollar, pushing the EURUSD higher as a result.
- Should the US jobs report print stronger than expected, the EURUSD may sink as the Dollar strengthens.
EURUSD is forecasted to move 0.30% up or 0.73% down in the 6 hours after this US NFP release
4) Technical forces
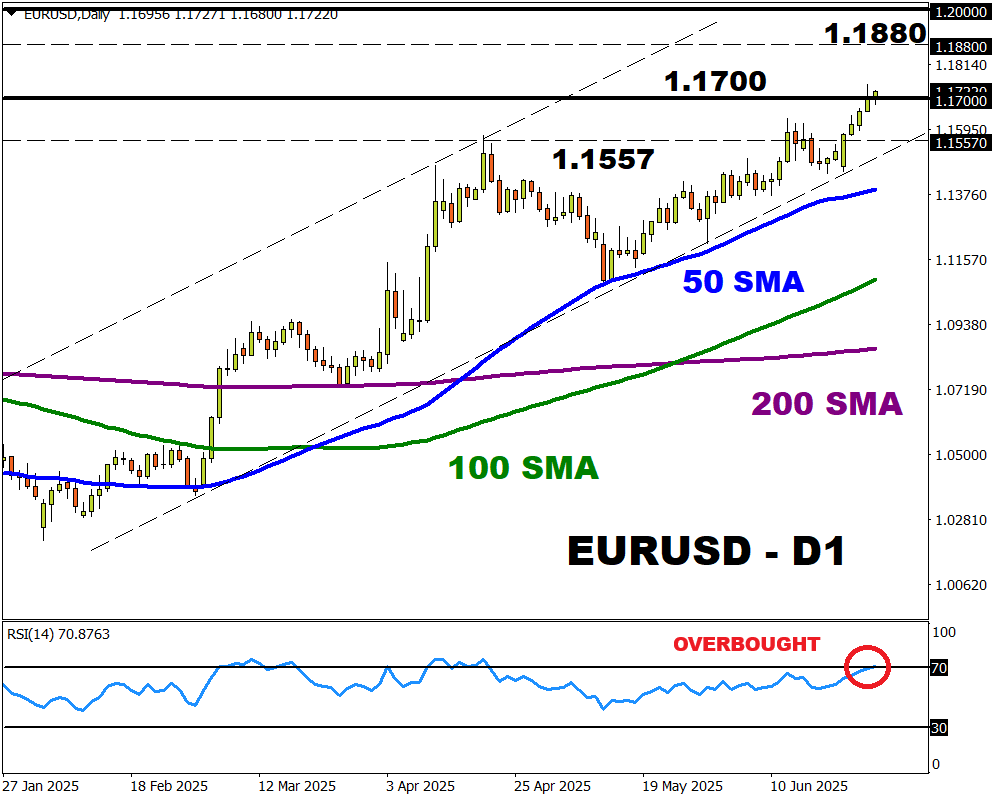
The EURUSD is firmly bullish on the daily timeframe with prices trading above the 50, 100 and 200-day SMA. However, the Relative Strength Index signals that prices are heavily overbought.
- A solid daily close above 1.1700 may signal a move toward 1.1800 and 1.1880 – the upper limit of the Bloomberg FX model.
- Should 1.1700 prove to be a tough resistance, this could trigger a decline back toward 1.1620 and 1.1557 – the lower limit of the Bloomberg FX model.
Bloomberg’s FX model forecasts a 75% chance that EURUSD will trade within the 1.1557 – 1.1880 range, using current levels as a base, over the next one-week period.
![]() Article by ForexTime
Article by ForexTime
ForexTime Ltd (FXTM) is an award winning international online forex broker regulated by CySEC 185/12 www.forextime.com