
By RoboForex Analytical Department
The price of gold rose to $3,303 per troy ounce on Wednesday, nearing a two-week high. The precious metal gained for the third consecutive day, following a 2% surge the previous day as investors sought safety amid heightened geopolitical uncertainty.
Key drivers behind the rally
Middle East Tensions: fears of escalation increased over a potential Israeli strike on Iran’s nuclear facilities, which could trigger retaliatory measures from Tehran.
US Political Uncertainty: President Donald Trump’s remarks on peace talks between Russia and Ukraine added to market unease, though he distanced himself from a mediating role.
Dollar Weakness: the US dollar remained under pressure after the Federal Reserve’s cautious economic outlook and Moody’s downgrade of the US credit rating, citing rising government debt.
Free Reports:
 Download Our Metatrader 4 Indicators – Put Our Free MetaTrader 4 Custom Indicators on your charts when you join our Weekly Newsletter
 Get our Weekly Commitment of Traders Reports - See where the biggest traders (Hedge Funds and Commercial Hedgers) are positioned in the futures markets on a weekly basis.
Trade & Fiscal Policy: investor confidence in the dollar was further dented by uncertainty over trade tariffs and the pending vote on Trump’s proposed tax reforms.
As a result, the dollar’s weakness has made gold more attractive to international buyers.
Technical analysis: XAU/USD
H4 Chart:
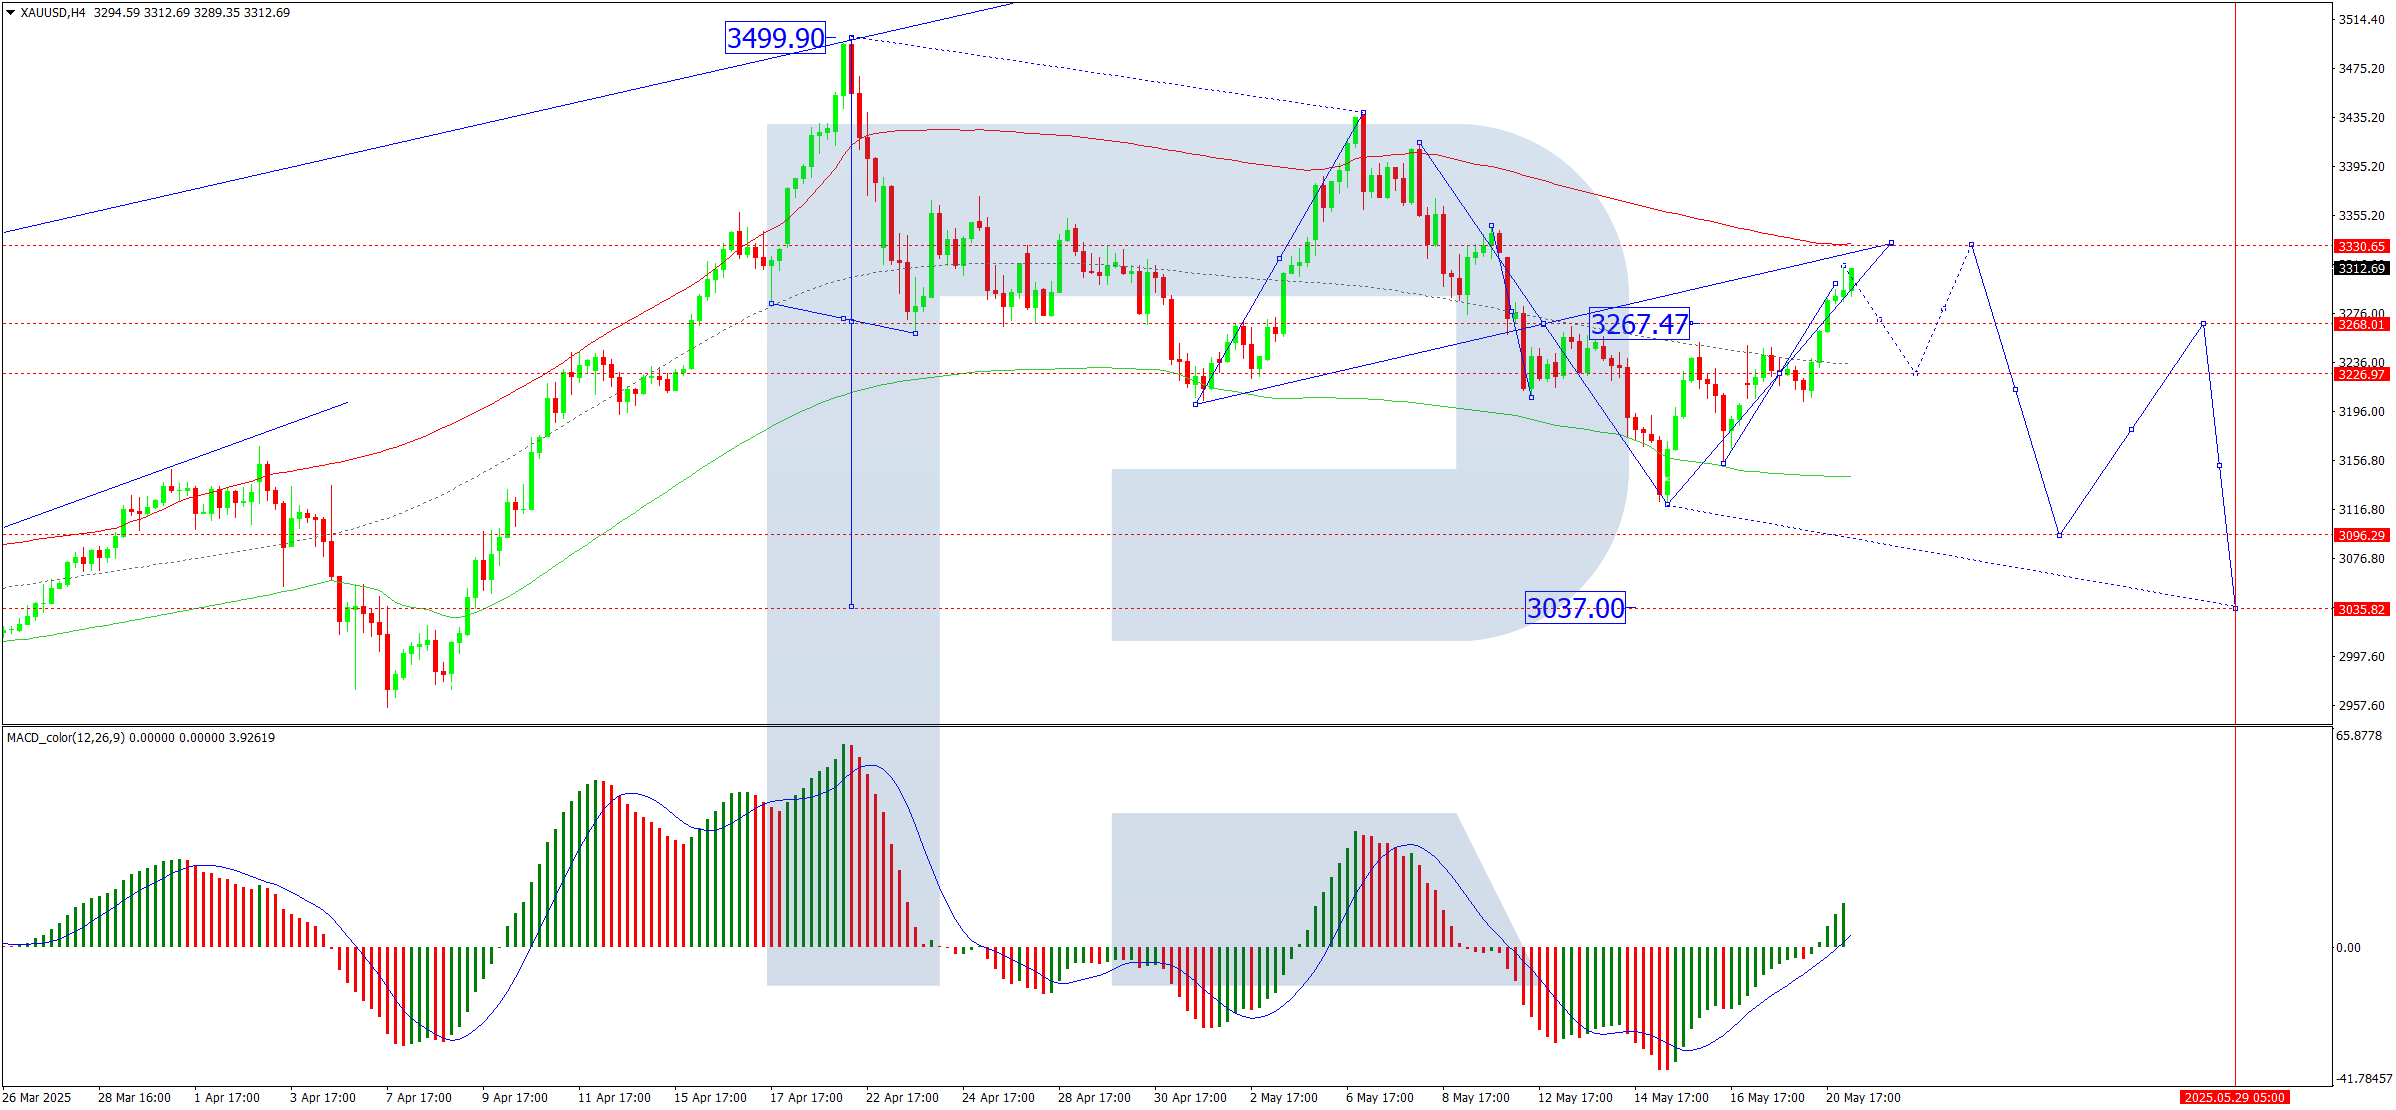
- The market consolidated near 3,222 before breaking upward
- The immediate upside target of 3,312 has now been met
- A pullback to retest 3,222 (from above) is likely, followed by a potential rise towards 3,333
- MACD Indicator: The signal line remains above zero and points upward, supporting further gains
H1 Chart:

- The pair broke through 3,250 and continued its upward trajectory towards 3,333
- A short-term correction to 3,222 is expected before another push higher
- The current uptrend is viewed as corrective; once complete, a downward wave towards 3,222 may follow
- Stochastic Oscillator: The signal line is below 80 and trending downward towards 20, indicating potential near-term weakness
Conclusion
Gold’s rally reflects its role as a haven amid geopolitical risks and dollar softness. While technical indicators point to a temporary correction, the broader uptrend remains intact, with 3,333 as the next key resistance level.
Disclaimer
Any forecasts contained herein are based on the author’s particular opinion. This analysis may not be treated as trading advice. RoboForex bears no responsibility for trading results based on trading recommendations and reviews contained herein.

- EUR/USD: Busy Week Ahead Aug 3, 2026
- Positive sentiment in the AI sector supported stock indices. Oil prices remain volatile Aug 3, 2026
- The Tech‑heavy NASDAQ Index jumped by more than 3.3%. The offshore yuan is trading at its highest level since 2023 Jul 31, 2026
- USD/JPY After Volatility: Multiple Events in One Day Jul 31, 2026
- The US indices sell off amid renewed US-Iran clashes. Oil jumps by 7% Jul 30, 2026
- USD/JPY Temporary in Equilibrium: Multiple Factors in Focus Jul 30, 2026
- GBP/USD at Month’s Lows: The Outlook Remains Weak Jul 29, 2026
- Crude oil falls below $80 per barrel. Australia sees inflation slowdown Jul 29, 2026
- The US Tech sector hit by sell‑off. Oil prices decline on renewed negotiations Jul 28, 2026
- Gold Declines, Focus on Fed and Falling Oil Prices Jul 28, 2026