The EUR/USD pair dropped to 1.1746 on Tuesday, with the US dollar holding a slight edge before correcting. The greenback faced pressure after Donald Trump announced new tariffs on 14 countries that have yet to secure trade agreements with the US.
Among the affected nations were major exporters such as Japan and South Korea, which will face a 25% duty on their goods starting 1 August.
Trump also signed an executive order delaying the deadline for reciprocal tariffs from 9 July to 1 August, granting more time for negotiations.
Additionally, he warned of a further 10% tariff on countries aligned with the anti-American BRICS policy, coinciding with the bloc’s summit in Brazil.
Earlier in the week, the US dollar had strengthened as trade tensions eased, and expectations of a Federal Reserve rate cut diminished. A robust June labour market report weakened the case for imminent monetary easing, with markets now all but dismissing the likelihood of a July rate reduction.
Technical Analysis: EUR/USD
H4 Chart:
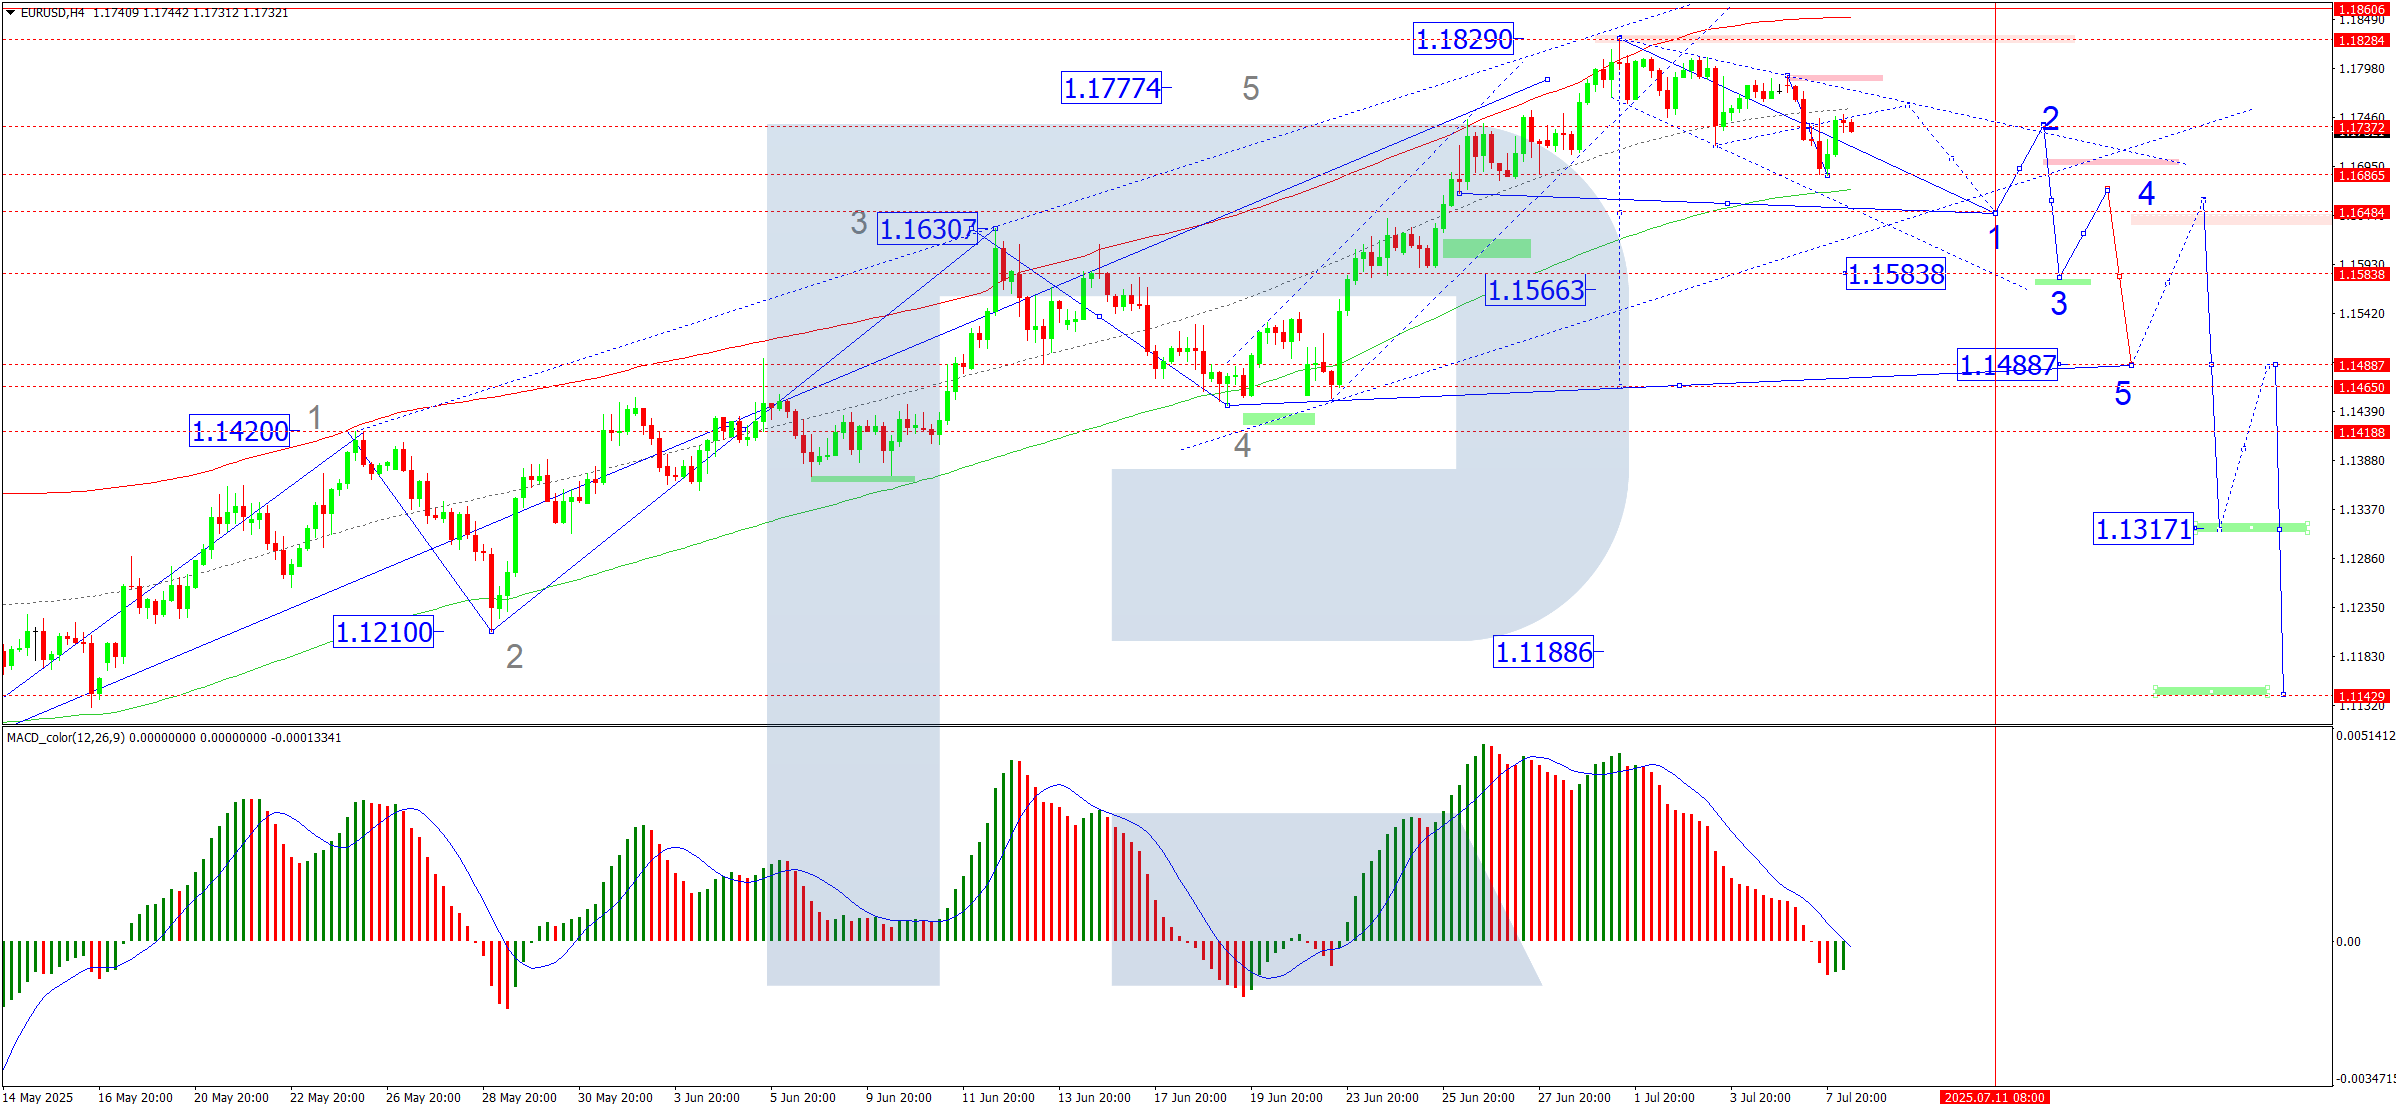
On the H4 chart, EUR/USD saw an upward wave to 1.1747, with a consolidation range now forming around this level. A potential expansion to 1.1760 is possible, followed by a likely decline to 1.1650, which would set the boundaries of this range. If the pair breaks above the range, gains could extend towards 1.1885. Conversely, a downside break may trigger a fall to 1.1611, with further downside potential towards 1.1570. This outlook is supported by the MACD indicator, where the signal line remains below zero, indicating a sharp downward trend.
H1 Chart:
On the H1 chart, the pair continues consolidating around 1.1717, with an expected upward expansion to 1.1777. However, the bullish momentum appears exhausted, and a downward wave to 1.1700 could materialise at any moment, potentially extending to 1.1611. The Stochastic oscillator reinforces this view, with its signal line below 80 and trending downward towards 20.
Conclusion
The EUR/USD remains under pressure amid uncertainties over tariffs and shifting expectations for the Fed’s rate outlook. Technically, the pair shows limited upside potential, with key support levels at 1.1650 (H4) and 1.1611 (H1). A break lower could accelerate declines, while an upward breakout may signal a short-term recovery.
Disclaimer
Any forecasts contained herein are based on the author’s particular opinion. This analysis may not be treated as trading advice. RoboForex bears no responsibility for trading results based on trading recommendations and reviews contained herein.
The US stock indices did not trade on Friday due to the US Independence Day holiday.
The dispute between Republican President Donald Trump and his campaign’s chief financier, Elon Musk, took a new turn on Saturday when the billionaire space and car industry magnate announced the creation of a new political party, saying that Trump’s “big and beautiful” tax bill would bankrupt America. Earlier last week, Trump threatened to strip Musk’s companies of the billions of dollars in federal subsidies they receive. Despite Musk’s deep pockets, breaking the Republican-Democratic duopoly will not be easy, given that it has dominated American political life for more than 160 years, and Trump’s approval rating in polls during his second term has generally remained above 40%.
BRICS leaders are expected to sign a joint statement condemning the “rise of unjustified unilateral protectionist measures” and “disorderly increases” in tariffs. The final wording is unlikely to mention the US directly. But the group is sending an unambiguous signal to the Trump administration ahead of July 9, when his tariffs are set to take effect. US President Donald Trump announced on Sunday that any country that joins the BRICS bloc’s “anti-American policy” will face additional 10% tariffs.
The Mexican peso strengthened to 18.65 per US dollar, its strongest level since mid-August 2024. In the external market, the unexpectedly large US budget package in June and the approaching deadline for Trump’s tariffs weakened the dollar, while Mexico’s trade surplus in May was US$1.03 billion, and record remittances of US$5.5 billion ensured an inflow of hard currency into the country. In the domestic market, Banxico’s decision on June 26 to cut its key rate by 50 basis points to 8%, while confirming that further cuts would occur in anticipation of sustained disinflation, maintained an attractive real interest rate that supported the yield differential between the peso and the dollar.
Equity markets in Europe were mostly down on Friday. The German DAX (DE40) fell by 0.61% (-1.33% for the week), the French CAC 40 (FR40) closed down 0.75% (-0.24% for the week), the Spanish IBEX35 (ES35) Index lost 1.48% (-0.40% for the week), and the British FTSE 100 (UK100) closed down 0.01% (+0.27% for the week). On Friday, European stocks closed lower amid ongoing tensions in trade relations with the United States. The EU Commission said it was close to developing a framework trade agreement with the US to avoid the reintroduction of aggressive tariffs by the July 9 deadline. In turn, ECB officials noted that they may not reach their 2% inflation target if the euro remains at $1.20 for an extended period.
OPEC+ countries agreed to a larger-than-expected increase in oil production in August. The eight countries that comprise the OPEC+ oil-producing alliance agreed to increase oil production in August by 548,000 barrels per day, exceeding expectations. The group includes the largest oil producers — Russia and Saudi Arabia — as well as Algeria, Iraq, Kazakhstan, Kuwait, Oman, and the United Arab Emirates. These countries are winding down their voluntary production cuts of 2.2 million barrels per day. The increase in production by 548,000 barrels per day, coupled with the winding down of voluntary cuts of 2.2 million barrels per day, means a significant increase in supply. If demand does not grow proportionally, this will lead to an oversupply in the market, which could potentially lower oil prices. On the other hand, seasonal growth in demand in the summer may partially offset the effect of increased supply.
On Friday, silver prices (XAG/USD) remained above $36.80 per ounce, approaching 13-year highs, as renewed tensions in global trade boosted demand for safe-haven assets. Investors remained on edge after President Donald Trump announced plans to begin sending letters describing new trade tariffs or potential extensions as early as Friday, adding to uncertainty in global markets. Further market anxiety was caused by the US House of Representatives passing Trump’s tax and spending bill, which is now headed to the White House for signing. The bill is expected to increase the federal budget deficit by more than $3 trillion, raising long-term fiscal concerns.
Asian markets traded without any clear trend last week. Japan’s Nikkei 225 (JP225) fell by 1.82%, China’s FTSE China A50 (CHA50) rose by 1.60%, Hong Kong’s Hang Seng (HK50) lost 2.19%, and Australia’s ASX 200 (AU200) showed a positive result of 1.04% over the past week.
Vietnam’s annual GDP growth rate in the second quarter of 2025 was 7.96% year-over-year (y/y), accelerating from 6.93% in the first quarter and marking the highest rate since the third quarter of 2022. The latest result reflects significant progress toward Hanoi’s target of at least 8% economic growth. Washington and Hanoi have signed a trade agreement under which Vietnamese goods will be subject to a 20% tariff, and transshipment of goods from third countries through Vietnam will be subject to a 40% tax. In return, Vietnam can import American goods without tariffs. Vietnam’s annual inflation rate rose to 3.57% in June 2025, from 3.24% in the previous month, marking the highest level since January. Core inflation, which excludes volatile items, rose to 3.46%, the highest since September 2023.
S&P 500 (US500) 6,279.35 0 (0%)
Dow Jones (US30) 44,828.53 0 (0%)
DAX (DE40) 23,787.45 23,787.45 −146.68 (−0.61%)
FTSE 100 (UK100) 8,822.91 −0.29 (−0.01%)
USD index 96.99 −0.19 (−0.20%)
News feed for: 2025.07.07
Japan Average Cash Earnings (m/m) at 02:30 (GMT+3);
German Industrial Production (m/m) at 09:00 (GMT+3);
This article reflects a personal opinion and should not be interpreted as an investment advice, and/or offer, and/or a persistent request for carrying out financial transactions, and/or a guarantee, and/or a forecast of future events.
The USD/JPY pair edged higher on Monday, reaching 144.81, as the yen relinquished its earlier gains. The currency faced downward pressure following the release of disappointing wage figures, which dampened expectations for further monetary policy tightening by the Bank of Japan.
Japan’s nominal wages rose by just 1.0% year-on-year in May, falling well short of the 2.4% forecast and marking a third consecutive monthly slowdown. Meanwhile, real wages, which reflect actual purchasing power, declined by 2.9% – the sharpest drop in nearly two years and the fifth straight month of contraction.
Notably, the official data does not yet fully account for the impact of this spring’s record wage agreements, negotiated with trade unions. Several smaller and non-unionised firms have been slower to implement these changes, delaying their effect on broader wage trends.
Further weighing on the yen were remarks from Prime Minister Shigeru Ishiba, who stated on Sunday that Japan would not make “easy concessions” in trade talks with the US, despite the threat of 35% tariffs on Japanese exports. Negotiations are expected to resume this week.
Technical Analysis: USD/JPY
H4 Chart:
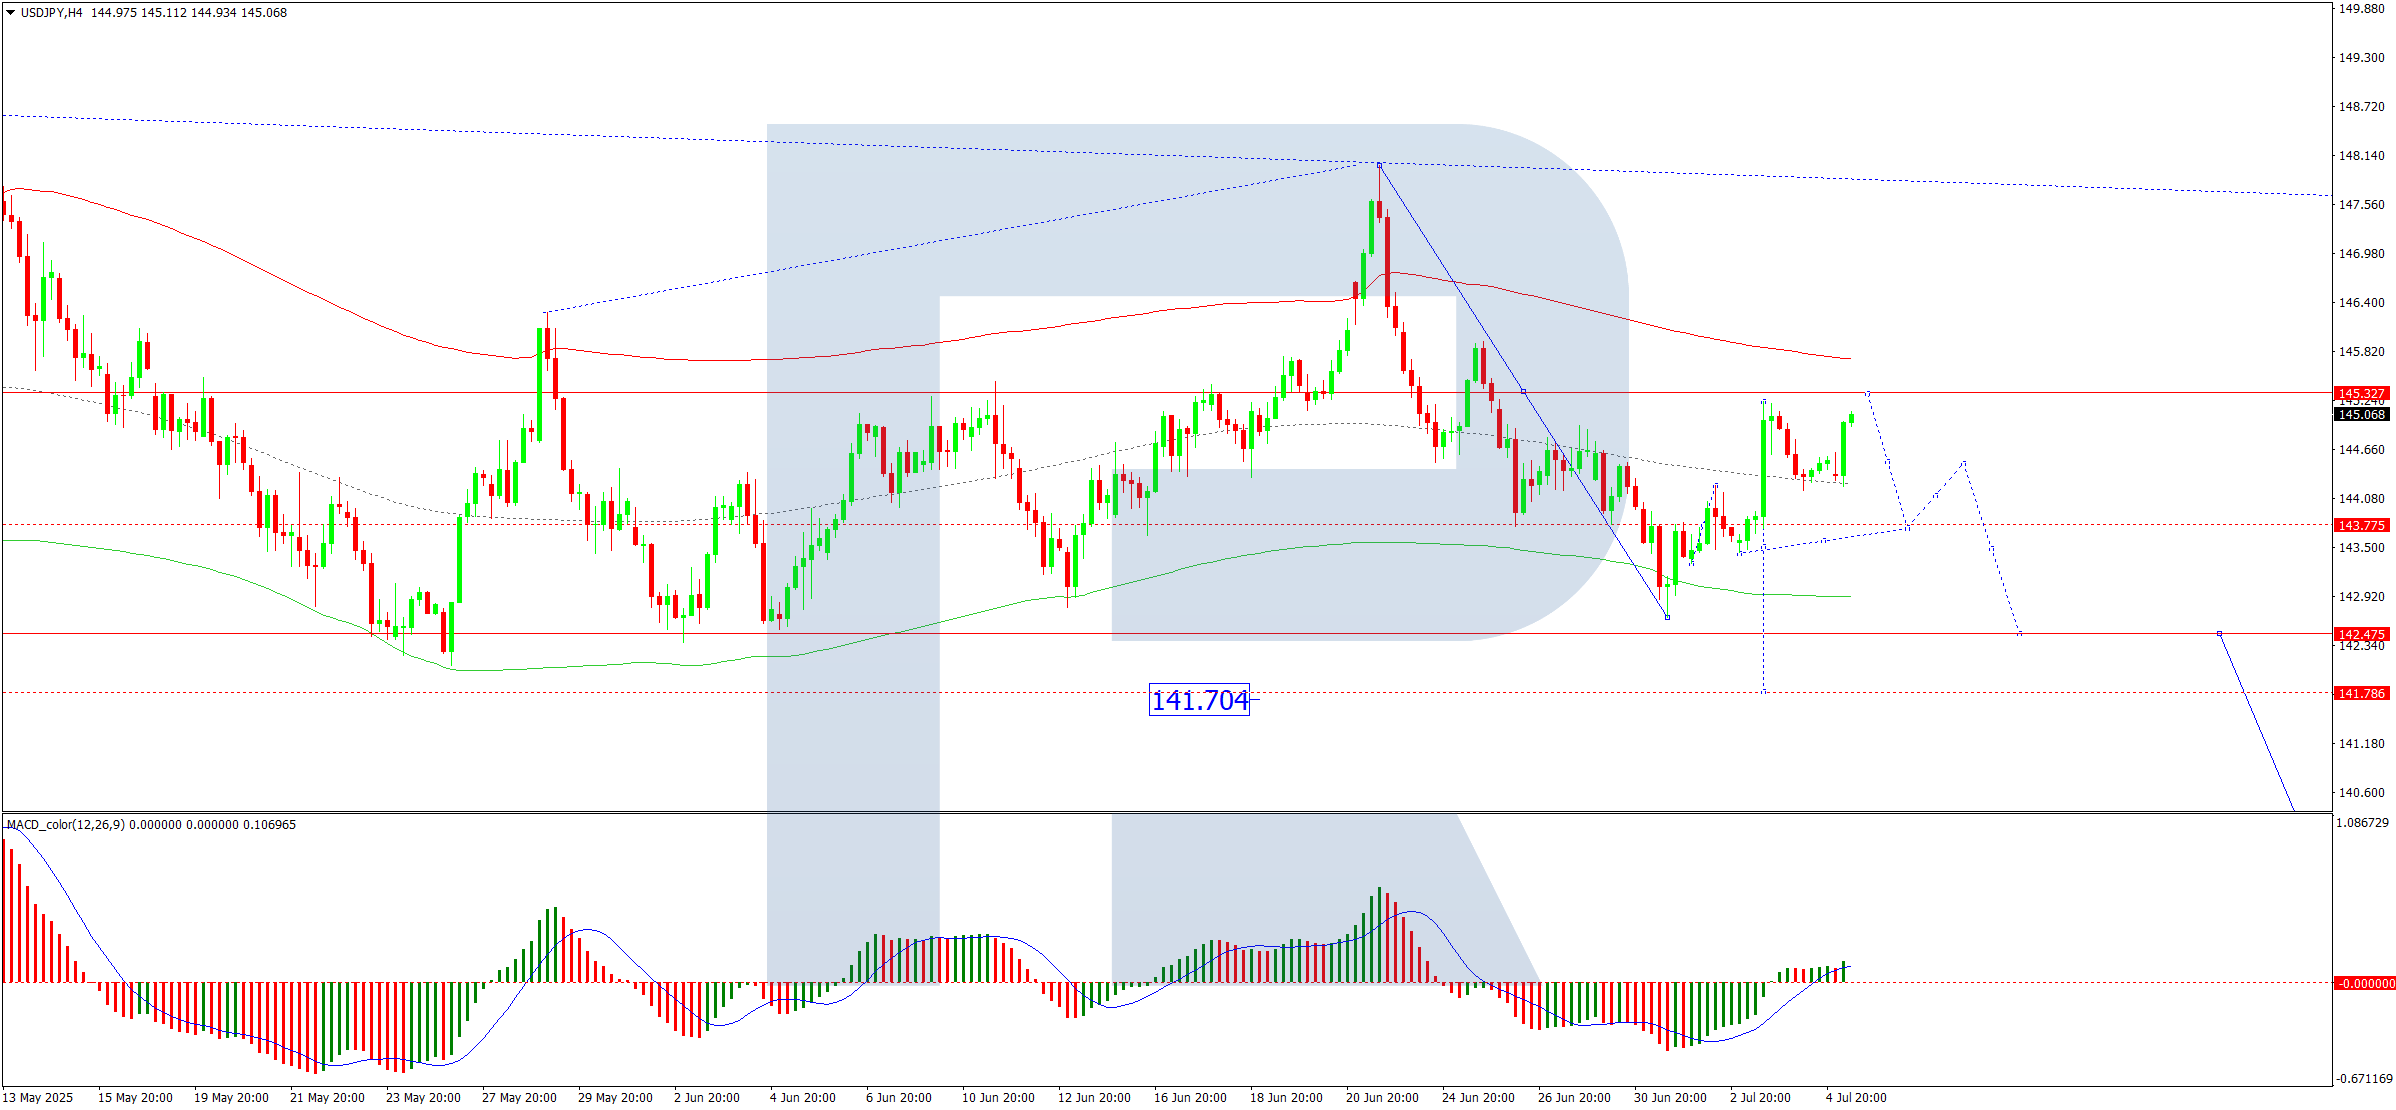
On the H4 chart, USD/JPY has formed a consolidation range around 144.33 before pushing upward. The immediate target is 145.33, after which we anticipate a downward correction towards 142.45, with potential for further declines to 141.70. This scenario is supported by the MACD indicator, where the signal line remains above zero and points firmly upward.
H1 Chart:
On the H1 chart, the pair corrected to 144.11 before resuming its upward trajectory, targeting 146.26. Upon reaching this level, we expect a new decline towards 143.90. A break below this level could extend losses to 141.70. The Stochastic oscillator aligns with this view, with its signal line currently at 80 and turning downward.
Conclusion
The yen’s weakness reflects subdued wage growth and lingering trade uncertainties, while technical indicators suggest potential volatility ahead.
Disclaimer
Any forecasts contained herein are based on the author’s particular opinion. This analysis may not be treated as trading advice. RoboForex bears no responsibility for trading results based on trading recommendations and reviews contained herein.
About 600 miles off the west coast of Africa, large clusters of thunderstorms begin organizing into tropical storms every hurricane season. They aren’t yet in range of Hurricane Hunter flights, so forecasters at the National Hurricane Center rely on weather satellites to peer down on these storms and beam back information about their location, structure and intensity.
The satellite data helps meteorologists create weather forecasts that keep planes and ships safe and prepare countries for a potential hurricane landfall.
Now, meteorologists are about to lose access to three of those satellites.
On June 25, 2025, the Trump administration issued a service change notice announcing that the Defense Meteorological Satellite Program, DMSP, and the Navy’s Fleet Numerical Meteorology and Oceanography Center would terminate data collection, processing and distribution of all DMSP data no later than June 30. The data termination was postponed until July 31 following a request from the head of NASA’s Earth Science Division.
How hurricanes form. NOAA
I am a meteorologist who studies lightning in hurricanes and helps train other meteorologists to monitor and forecast tropical cyclones. Here is how meteorologists use the DMSP data and why they are concerned about it going dark.
Looking inside the clouds
At its most basic, a weather satellite is a high-resolution digital camera in space that takes pictures of clouds in the atmosphere.
These are the satellite images you see on most TV weather broadcasts. They let meteorologists see the location and some details of a hurricane’s structure, but only during daylight hours.
Hurricane Flossie spins off the Mexican coast on July 1, 2025. Images show the top of the hurricane from space as day turns to night. NOAA GOES
Meteorologists can use infrared satellite data, similar to a thermal imaging camera, at all hours of the day to find the coldest cloud-top temperatures, highlighting areas where the highest wind speeds and rainfall rates are found.
But while visible and infrared satellite imagery are valuable tools for hurricane forecasters, they provide only a basic picture of the storm. It’s like a doctor diagnosing a patient after a visual exam and checking their temperature.
Infrared bands show more detail of Hurricane Flossie’s structure on July 1, 2025. NOAA GOES
For more accurate diagnoses, meteorologists rely on the DMSP satellites.
The three satellites orbit Earth 14 times per day with special sensor microwave imager/sounder instruments, or SSMIS. These let meteorologists look inside the clouds, similar to how an MRI in a hospital looks inside a human body. With these instruments, meteorologists can pinpoint the storm’s low-pressure center and identify signs of intensification.
Precisely locating the center of a hurricane improves forecasts of the storm’s future track. This lets meteorologists produce more accurate hurricane watches, warnings and evacuations.
About 80% of major hurricanes – those with wind speeds of at least 111 mph (179 kilometers per hour) – rapidly intensify at some point, ramping up the risks they pose to people and property on land. Finding out when storms are about to undergo intensification allows meteorologists to warn the public about these dangerous hurricanes.
Where are the defense satellites going?
NOAA’s Office of Satellite and Product Operations described the reason for turning off the flow of data as a need to mitigate “a significant cybersecurity risk.”
The three satellites have already operated for longer than planned.
The DMSP satellites were launched between 1999 and 2009 and were designed to last for five years. They have now been operating for more than 15 years. The United States Space Force recently concluded that the DMSP satellites would reach the end of their lives between 2023 and 2026, so the data would likely have gone dark soon.
The advanced technology microwave sounder, or ATMS, can provide data similar to the special sensor microwave imager/sounder, or SSMIS, but at a lower resolution. It provides a more washed-out view that is less useful than the SSMIS for pinpointing a storm’s location or estimating its intensity.
Images of Hurricane Erick off the coast of Mexico, viewed from NOAA-20’s ATMS (left) and DMPS SSMIS (right) on June 18 show the difference in resolution and the higher detail provided by the SSMIS data. U.S. Naval Research Laboratory, via Michael Lowry
ML-1A is a microwave satellite that will help replace some of the DMSP satellites’ capabilities. However, the government hasn’t announced whether the ML-1A data will be available to forecasters, including those at the National Hurricane Center.
Why are satellite replacements last minute?
Satellite programs are planned over many years, even decades, and are very expensive. The current geostationary satellite program launched its first satellite in 2016 with plans to operate until 2038. Development of the planned successor for GOES-R began in 2019.
Scientists prepare a GOES-R satellite for packing aboard a rocket in 2016. NASA/Charles Babir
Delays in developing the satellite instruments and funding cuts caused the National Polar-orbiting Operational Environmental Satellite System and Defense Weather Satellite System to be canceled in 2010 and 2012 before any of their satellites could be launched.
The 2026 NOAA budget request includes an increase in funding for the next-generation geostationary satellite program, so it can be restructured to reuse spare parts from existing geostationary satellites. The budget also terminates contracts for ocean color, atmospheric composition and advanced lightning mapper instruments.
Hurricane forecasters will continue to use all available tools, including satellite, radar, weather balloon and dropsonde data, to monitor the tropics and issue hurricane forecasts. But the loss of satellite data, along with other cuts to data, funding and staffing, could ultimately put more lives at risk.
“The Diamond Age” depicted a post-cyberpunk sectarian future, in which society is fragmented into tribes, called phyles. In this future world, sophisticated nanotechnology is ubiquitous, and a new type of AI is introduced.
Though inspired by MIT nanotech pioneer Eric Drexler and Nobel Prize winner Richard Feynman, the advanced nanotechnology depicted in the novel still remains out of reach. However, the AI that’s portrayed, particularly a teaching device called the Young Lady’s Illustrated Primer, isn’t only right in front of us; it also raises serious issues about the role of AI in labor, learning and human behavior.
In Stephenson’s novel, the Primer looks like a hardcover book, but each of its “pages” is really a screen display that can show animations and text, and it responds to its user in real time via AI. The book also has an audio component, which voices the characters and narrates stories being told by the device.
It was originally created for the young daughter of an aristocrat, but it accidentally falls into the hands of a girl named Nell who’s living on the streets of a futuristic Shanghai. The Primer provides Nell personalized emotional, social and intellectual support during her journey to adulthood, serving alternatively as an AI companion, a storyteller, a teacher and a surrogate parent.
The AI is able to weave fairy tales that help a younger Nell cope with past traumas, such as her abusive home and life on the streets. It educates her on everything from math to cryptography to martial arts. In a techno-futuristic homage to George Bernard Shaw’s 1913 play “Pygmalion,” the Primer goes so far as to teach Nell the proper social etiquette to be able to blend into neo-Victorian society, one of the prominent tribes in Stephenson’s balkanized world.
No need for ‘ractors’
Three recent developments in AI – in video games, wearable technology and education – reveal that building something like the Primer should no longer be considered the purview of science fiction.
In May 2025, the hit video game “Fortnite” introduced an AI version of Darth Vader, who speaks with the voice of the late James Earl Jones.
While it was popular among fans of the game, the Screen Actors Guild lodged a labor complaint with Epic Games, the creator of “Fortnite.” Even though Epic had received permission from the late actor’s estate, the Screen Actors Guild pointed out that actors could have been hired to voice the character, and the company – in refusing to alert the union and negotiate terms – violated existing labor agreements.
In “The Diamond Age,” while the Primer uses AI to generate the fairy tales that train Nell, for the voices of these archetypal characters, Stephenson concocted a low-tech solution: The characters are played by a network of what he termed “ractors” – real actors working in a studio who are contracted to perform and interact in real time with users.
The Darth Vader “Fortnite” character shows that a Primer built today wouldn’t need to use actors at all. It could rely almost entirely on AI voice generation and have real-time conversations, showing that today’s technology already exceeds Stephenson’s normally far-sighted vision.
Recording and guiding in real time
Synthesizing James Earl Jones’ voice in “Fortnite” wasn’t the only recent AI development heralding the arrival of Primer-like technology.
I recently witnessed a demonstration of wearable AI that records all of the wearer’s conversations. Their words are then sent to a server so they can be analyzed by AI, providing both summaries and suggestions to the user about future behavior.
Several startups are making these “always on” AI wearables. In an April 29, 2025, essay titled “I Recorded Everything I Said for Three Months. AI Has Replaced My Memory,” Wall Street Journal technology columnist Joanna Stern describes the experience of using this technology. She concedes that the assistants created useful summaries of her conversations and meetings, along with helpful to-do lists. However, they also recalled “every dumb, private and cringeworthy thing that came out of my mouth.”
AI wearable devices that continuously record the conversations of their users have recently hit the market.
These devices also create privacy issues. The people whom the user interacts with don’t always know they are being recorded, even as their words are also sent to a server for the AI to process them. To Stern, the technology’s potential for mass surveillance becomes readily apparent, presenting a “slightly terrifying glimpse of the future.”
Relying on AI engines such as ChatGPT, Claude and Google’s Gemini, the wearables work only with words, not images. Behavioral suggestions occur only after the fact. However, a key function of the Primer – coaching users in real time in the middle of any situation or social interaction – is the next logical step as the technology advances.
Education or social engineering?
In “The Diamond Age,” the Primer doesn’t simply weave interactive fairy tales for Nell. It also assumes the responsibility of educating her on everything from her ABCs when younger to the intricacies of cryptography and politics as she gets older.
There are certainly advantages to AI tutors: Tutoring and college tuition can be exorbitantly expensive, and the technology can offer better access to education to people of all income levels.
Pulling together these latest AI advances – interactive avatars, behavioral guides, tutors – it’s easy to envision how an AI device like the Young Lady’s Illustrated Primer could be created in the near future. A young person might have a personalized AI character that accompanies them at all times. It can teach them about the world and offer up suggestions for how to act in certain situations. The AI could be tailored to a child’s personality, concocting stories that include AI versions of their favorite TV and movie characters.
But “The Diamond Age” offers a warning, too.
Toward the end of the novel, a version of the Primer is handed out to hundreds of thousands of young Chinese girls who, like Nell, didn’t have access to education or mentors. This leads to the education of the masses. But it also opens the door to large-scale social engineering, creating an army of Primer-raised martial arts experts, whom the AI then directs to act on behalf of “Princess Nell,” Nell’s fairy tale name.
It’s easy to see how this sort of large-scale social engineering could be used to target certain ideologies, crush dissent or build loyalty to a particular regime. The AI’s behavior could also be subject to the whims of the companies or individuals that created it. A ubiquitous, always-on, friendly AI could become the ultimate monitoring and reporting device. Think of a kinder, gentler face for Big Brother that people have trusted since childhood.
While large-scale deployment of a Primer-like AI could certainly make young people smarter and more efficient, it could also hamper one of the most important parts of education: teaching people to think for themselves.
At the end of Wednesday, the Dow Jones Index (US30) fell by 0.02%. The S&P 500 Index (US500) rose by 0.47% and reached a new all-time high. The Nasdaq Technology Index (US100) closed higher by 0.73%. Markets were buoyed by strong gains in technology stocks and news of a trade agreement between the US and Vietnam. President Donald Trump announced on Wednesday that the US would impose 20% tariffs on imports from Vietnam under a new trade deal struck in last-minute negotiations. Previously, Vietnamese goods were to be subject to 46% duties starting next week as part of the “reciprocal” tariff policy introduced by Trump in April. Meanwhile, other major economies, such as the EU and Japan, are still trying to conclude their own agreements with the US.
The latest ADP data showed that private sector employment unexpectedly declined in June, the first decline in more than two years, raising new concerns about the strength of the labor market and supporting the case for monetary policy easing.
Today, important data on the US labor market will be released in the US, namely the Non-Farm Payrolls report. The publication date has been moved up a day due to the US holiday on Friday, July 4 (Independence Day). If the data is in line with analysts’ expectations, such a report will indicate a continuing slowdown in the labor market, but without a sharp deterioration. Higher wage growth rates may alarm the Fed in the context of inflationary pressure, reducing the likelihood of an early easing of monetary policy. The market reaction is neutral for both the US dollar and gold and stocks. A weak labor market report may reinforce expectations of a Fed rate cut in the coming months. We can expect a negative reaction from the US dollar, growth in risk assets (EUR, GBP, AUD), growth in stock indices and gold.
Stock markets in Europe were mostly up on Wednesday. The German DAX (DE40) rose by 0.49%, the French CAC 40 (FR40) closed up 0.99%, the Spanish IBEX35 (ES35) added 0.41%, and the British FTSE 100 (UK100) closed down 0.12%. The Frankfurt DAX Index rose by about 0.5%, interrupting two days of losses, amid growing expectations of a positive outcome to trade negotiations. The US is reportedly insisting on introducing 10% tariffs, while the EU is seeking exemptions for sectors such as alcohol, aircraft manufacturing, pharmaceuticals, and semiconductors. Meanwhile, ECB officials at the Sintra summit expressed growing concern that the strengthening of the euro could affect inflation.
WTI crude oil prices fell below $67 a barrel on Thursday, cutting gains from the previous session, as an increase in US crude oil inventories heightened concerns about weak demand from the main consumer. Official data showed that crude oil inventories rose by 3.85 million barrels last week, defying expectations of a 2 million barrel decline and marking the largest increase in three months. Adding further pressure is the fact that OPEC+ appears set to increase production by 411,000 barrels per day in August, bringing the total increase through 2025 to 1.78 million barrels per day, equivalent to more than 1.5% of global demand.
Asian markets were mostly up yesterday. Japan’s Nikkei 225 (JP225) fell by 0.56%, China’s FTSE China A50 (CHA50) rose by 0.11%, Hong Kong’s Hang Seng (HK50) added 0.62%, and Australia’s ASX 200 (AU200) showed a positive result of 0.66%.
The Bank of Japan should resume raising rates after a temporary pause to assess the impact of US tariffs on the Japanese economy, a BoJ board member said on Thursday. According to Takata, Japan is approaching its 2% inflation target, helped by strong corporate earnings, labor shortages, and wage growth. He also warned that if the Fed resumes cutting rates, it could reduce the Bank of Japan’s policy flexibility. However, Takata sees no signs of a recession in the US.
The Australian dollar fell to $0.657 on Thursday, ending a three-session winning streak amid weak trade data. Australia’s trade surplus narrowed sharply to 2.24 billion Australian dollars in May, well below expectations of 5.09 billion Australian dollars and the revised figure of 4.86 billion Australian dollars in April. This was the smallest surplus in nearly five years, with exports falling to a three-month low due to weaker shipments from the US, which were affected by tariffs. Additional pressure came from data on the PMI index in the services sector of China, Australia’s main trading partner, which fell to a nine-month low and failed to meet expectations.
S&P 500 (US500) 6,227.42 +29.41 (+0.47%)
Dow Jones (US30) 484,44.42 −10.52 (−0.024%)
DAX (DE40) 23,790.11 +116.82 (+0.49%)
FTSE 100 (UK100) 8,774.69 −10.64 (−0.12%)
USD Index 96.79 −0.03 (−0.03%)
News feed for: 2025.07.03
Australia Services PMI (m/m) at 02:00 (GMT+3);
Japan Services PMI (m/m) at 03:30 (GMT+3);
Australia Trade Balance (m/m) at 04:30 (GMT+3);
China Caixin Services PMI (m/m) at 04:45 (GMT+3);
Switzerland Inflation Rate (m/m) at 09:30 (GMT+3);
German Services PMI (m/m) at 10:55 (GMT+3);
Eurozone Services PMI (m/m) at 11:00 (GMT+3);
UK Services PMI (m/m) at 11:30 (GMT+3);
Eurozone ECB Monetary Policy Meeting Accounts at 14:30 (GMT+3);
This article reflects a personal opinion and should not be interpreted as an investment advice, and/or offer, and/or a persistent request for carrying out financial transactions, and/or a guarantee, and/or a forecast of future events.
On Thursday, the price of gold fell to 3,340 USD per troy ounce, partially correcting the previous day’s gains. The decline reflects growing optimism over trade agreements, which reduced demand for gold as a safe-haven asset.
Trade optimism weighs on gold, while geopolitical risks provide support
US President Donald Trump announced the conclusion of a trade agreement with Vietnam, under which the US will remove some tariffs on Vietnamese goods in exchange for greater market access for American products. This boosted hopes for new bilateral trade deals, easing global trade tensions.
However, gold’s losses were contained by the weak US dollar, which remains under pressure due to fiscal risks and expectations of further Fed easing. Additional support came from the ADP private sector employment report, which showed an unexpected decline, the first since early 2022. The disappointing data raised concerns about the stability of the labour market and strengthened expectations of interest rate cuts.
Meanwhile, Iran’s decision to end cooperation with the IAEA added a geopolitical risk factor, which traditionally supports gold prices.
Technical analysis of XAU/USD
On the H4 chart, XAU/USD completed a downward wave to 3,250 USD. A correction towards 3,385 USD is expected today. Once the rebound is complete, another decline to 3,250 USD remains likely. A break below this level would suggest a continuation of the downtrend towards the next local target at 3,180 USD. The MACD indicator confirms the bearish scenario, with its signal line above zero and pointing firmly upwards, indicating a corrective movement before a potential resumption of the decline.
On the H1 chart, the market formed a consolidation range around 3,336 USD. An upward breakout suggests the development of a fifth growth wave towards 3,385 USD. At this level, the growth potential may be exhausted, and a subsequent decline back to 3,336 USD is likely. A break below 3,336 USD would open the way for a further drop to 3,313 USD, with the prospect of continuing towards 3,250 USD. The Stochastic oscillator confirms this view, with its signal line above 50 and heading strictly towards 80, indicating short-term upward momentum before potential reversal.
Conclusion
Gold remains under pressure due to trade optimism, but weakness in the dollar and geopolitical risks continue to provide support. Technically, a correction to 3,385 USD is expected before potential further declines to 3,250 USD and 3,180 USD. The short-term outlook favours consolidation and corrective upward movements, followed by a likely continuation of the broader downward trend.
Disclaimer
Any forecasts contained herein are based on the author’s particular opinion. This analysis may not be treated as trading advice. RoboForex bears no responsibility for trading results based on trading recommendations and reviews contained herein.
You wake up in the morning and, first thing, you open your weather app. You close that pesky ad that opens first and check the forecast. You like your weather app, which shows hourly weather forecasts for your location. And the app is free!
But do you know why it’s free? Look at the app’s privacy settings. You help keep it free by allowing it to collect your information, including:
What devices you use and their IP and Media Access Control addresses.
Information you provide when signing up, such as your name, email address and home address.
App settings, such as whether you choose Celsius or Fahrenheit.
Your interactions with the app, including what content you view and what ads you click.
Inferences based on your interactions with the app.
Your location at a given time, including, depending on your settings, continuous tracking.
What websites or apps that you interact with after you use the weather app.
Information you give to ad vendors.
Information gleaned by analytics vendors that analyze and optimize the app.
This type of data collection is standard fare. The app company can use this to customize ads and content. The more customized and personalized an ad is, the more money it generates for the app owner. The owner might also sell your data to other companies.
Many apps, including the weather channel app, send you targeted advertising and sell your personal data by default. Jack West, CC BY-ND
You might also check a social media account like Instagram. The subtle price that you pay is, again, your data. Many “free” mobile apps gather information about you as you interact with them.
As an associate professor of electrical and computer engineering and a doctoral student in computer science, we follow the ways software collects information about people. Your data allows companies to learn about your habits and exploit them.
It’s no secret that social media and mobile applications collect information about you. Meta’s business model depends on it. The company, which operates Facebook, Instagram and WhatsApp, is worth US$1.48 trillion. Just under 98% of its profits come from advertising, which leverages user data from more than 7 billion monthly users.
What your data is worth
Before mobile phones gained apps and social media became ubiquitous, companies conducted large-scale demographic surveys to assess how well a product performed and to get information about the best places to sell it. They used the information to create coarsely targeted ads that they placed on billboards, print ads and TV spots.
Mobile apps and social media platforms now let companies gather much more fine-grained information about people at a lower cost. Through apps and social media, people willingly trade personal information for convenience. In 2007 – a year after the introduction of targeted ads – Facebook made over $153 million, triple the previous year’s revenue. In the past 17 years, that number has increased by more than 1,000 times.
Five ways to leave your data
App and social media companies collect your data in many ways. Meta is a representative case. The company’s privacy policy highlights five ways it gathers your data:
First, it collects the profile information you fill in. Second, it collects the actions you take on its social media platforms. Third, it collects the people you follow and friend. Fourth, it keeps track of each phone, tablet and computer you use to access its platforms. And fifth, it collects information about how you interact with apps that corporate partners connect to its platforms. Many apps and social media platforms follow similar privacy practices.
Your data and activity
When you create an account on an app or social media platform, you provide the company that owns it with information like your age, birth date, identified sex, location and workplace. In the early years of Facebook, selling profile information to advertisers was that company’s main source of revenue. This information is valuable because it allows advertisers to target specific demographics like age, identified gender and location.
And once you start using an app or social media platform, the company behind it can collect data about how you use the app or social media. Social media keeps you engaged as you interact with other people’s posts by liking, commenting or sharing them. Meanwhile, the social media company gains information about what content you view and how you communicate with other people.
Advertisers can find out how much time you spent reading a Facebook post or that you spent a few more seconds on a particular TikTok video. This activity information tells advertisers about your interests. Modern algorithms can quickly pick up subtleties and automatically change the content to engage you in a sponsored post, a targeted advertisement or general content.
Your devices and applications
Companies can also note what devices, including mobile phones, tablets and computers, you use to access their apps and social media platforms. This shows advertisers your brand loyalty, how old your devices are and how much they’re worth.
Because mobile devices travel with you, they have access to information about where you’re going, what you’re doing and who you’re near. In a lawsuit against Kochava Inc., the Federal Trade Commission called out the company for selling customer geolocation data in August 2022, shortly after Roe v Wade was overruled. The company’s customers, including people who had abortions after the ruling was overturned, often didn’t know that data tracking their movements was being collected, according to the commission. The FTC alleged that the data could be used to identify households.
Information that apps can gain from your mobile devices includes anything you have given an app permission to have, such as your location, who you have in your contact list or photos in your gallery.
If you give an app permission to see where you are while the app is running, for instance, the platform can access your location anytime the app is running. Providing access to contacts may provide an app with the phone numbers, names and emails of all the people that you know.
Cross-application data collection
Companies can also gain information about what you do across different apps by acquiring information collected by other apps and platforms.
The settings on an Android phone show that Meta uses information it collects about you to target ads it shows you in its apps – and also in other apps and on other platforms – by default. Jack West, CC BY-ND
This is common with social media companies. This allows companies to, for example, show you ads based on what you like or recently looked at on other apps. If you’ve searched for something on Amazon and then noticed an ad for it on Instagram, it’s probably because Amazon shared that information with Instagram.
Companies, including Google, Meta, X, TikTok and Snapchat, can build detailed user profiles based on collected information from all the apps and social media platforms you use. They use the profiles to show you ads and posts that match your interests to keep you engaged. They also sell the profile information to advertisers.
Meanwhile, researchers have found that Meta and Yandex, a Russian search engine, have overcome controls in mobile operating system software that ordinarily keep people’s web-browsing data anonymous. Each company puts code on its webpages that used local IPs to pass a person’s browsing history, which is supposed to remain private, to mobile apps installed on that person’s phone, de-anonymizing the data. Yandex has been conducting this tracking since 2017, while Meta began in September 2024, according to the researchers.
What you can do about it
If you use apps that collect your data in some way, including those that give you directions, track your workouts or help you contact someone, or if you use social media platforms, your privacy is at risk.
Aside from entirely abandoning modern technology, there are several steps you can take to limit access – at least in part – to your private information.
Read the privacy policy of each app or social media platform you use. Although privacy policy documents can be long, tedious and sometimes hard to read, they explain how social media platforms collect, process, store and share your data.
Check a policy by making sure it can answer three questions: what data does the app collect, how does it collect the data, and what is the data used for. If you can’t answer all three questions by reading the policy, or if any of the answers don’t sit well with you, consider skipping the app until there’s a change in its data practices.
Remove unnecessary permissions from mobile apps to limit the amount of information that applications can gather from you.
Be aware of the privacy settings that might be offered by the apps or social media platforms you use, including any setting that allows your personal data to affect your experience or shares information about you with other users or applications.
These privacy settings can give you some control. We recommend that you disable “off-app activity” and “personalization” settings. “Off-app activity” allows an app to record which other apps are installed on your phone and what you do on them. Personalization settings allow an app to use your data to tailor what it shows you, including advertisements.
Review and update these settings regularly because permissions sometimes change when apps or your phone update. App updates may also add new features that can collect your data. Phone updates may also give apps new ways to collect your data or add new ways to preserve your privacy.
Use private browser windows or reputable virtual private networks software, commonly referred to as VPNs, when using apps that connect to the internet and social media platforms. Private browsers don’t store any account information, which limits the information that can be collected. VPNs change the IP address of your machine so that apps and platforms can’t discover your location.
Finally, ask yourself whether you really need every app that’s on your phone. And when using social media, consider how much information you want to reveal about yourself in liking and commenting on posts, sharing updates about your life, revealing locations you visited and following celebrities you like.
This article is part of a series on data privacy that explores who collects your data, what and how they collect, who sells and buys your data, what they all do with it, and what you can do about it.
John Newell of John Newell & Associates reviews the copper market and shares some copper stocks he believes are worth keeping an eye on.
For years, copper has quietly built a case for being one of the most strategically important — and structurally underappreciated — commodities in the global economy.
Today, that case is no longer just about long-term fundamentals.
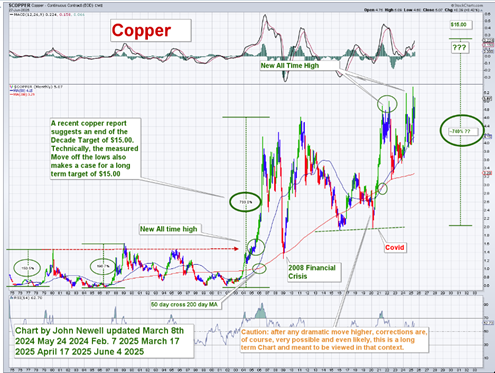
Technically, copper may be on the verge of a historic breakout, with the gold-to-copper ratio flashing one of the clearest signals in decades.
The Coming Copper Supercycle
The world is entering a period of compounding copper demand across sectors that didn’t even exist a generation ago. Clean energy infrastructure, electric vehicles, artificial intelligence, and data center expansion are all rapidly growing copper consumers. By some estimates, copper demand could double by 2035, from ~25 million tonnes to nearly 50 Mt.
This surge is colliding with mounting supply constraints. Ore grades have declined ~40% since 1991, permitting timelines now average more than 15 years, and only a handful of major discoveries have been made in the last decade. Mine development delays, social license challenges, and geopolitical instability in key regions are adding even more friction.
According to the International Energy Agency, even in its most optimistic scenario, a copper supply deficit of at least 1.6 million tonnes will persist by 2035, and under more aggressive climate targets, this deficit could exceed 10 million tonnes annually. With energy transition goals looming, this shortfall threatens to delay or derail critical electrification projects worldwide.
Meanwhile, new demand centers are emerging. Both India and Vietnam are poised to become major copper consumers, while China continues to dominate refining capacity with a 45% global share. Supply, however, remains concentrated in jurisdictions such as Chile and the Democratic Republic of Congo, increasing geopolitical and logistical risk.
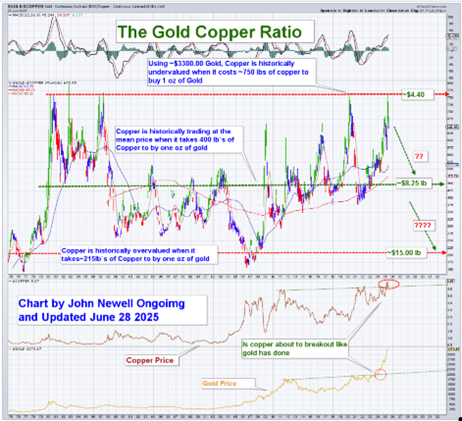
The Gold-to-Copper Ratio: A Hidden Signal
While most headlines focus on copper supply and demand, the gold-to-copper ratio may offer the most striking indicator of what’s coming next.
Historically, this ratio oscillates around a long-term mean, but today, it’s signaling copper is historically cheap relative to gold.
At $3,300 gold, the ratio currently implies copper is undervalued at ~$5.00 per lb historically
At $3,300 gold, the ratio implies copper should be trading at approximately $8.00/lb to revert to the mean
A return to the lower bound of historical undervaluation could imply copper over $15/lb
Technically, the ratio has reached levels not seen since the early 2000s, just before copper launched into a multi-year bull market
This isn’t just a valuation story, it’s a sentiment shift. When gold leads, copper often follows. And gold’s 2024 breakout may be the prelude to a similar move in copper.
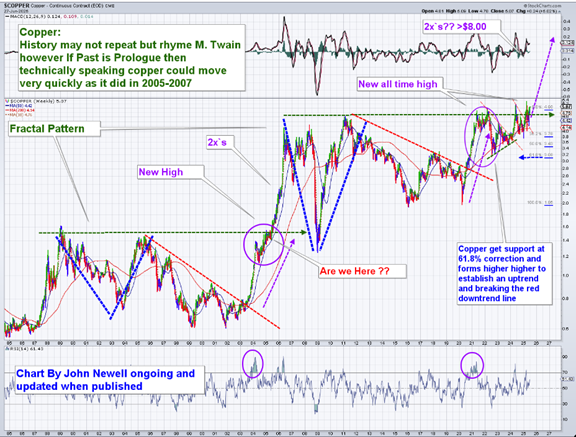
Fractal Patterns and Price Projection
Copper’s price chart is showing a clear fractal pattern resembling its 2003–2007 breakout period. Key technical levels have already been tested and held, and copper appears to be forming a bullish base with higher lows.
The breakout above $5.00/lb could confirm a long-term trend reversal.
Using Fibonacci extensions and historical symmetry:
A 2x move from the current base projects copper to ~$8.00–$9.00/lb
Longer-term targets range up to $12.00–$15.00/lb, particularly if inflation and energy transition tailwinds persist
Fundamental Tailwinds Align
Beyond charts and ratios, the copper bull thesis is grounded in urgent global realities:
Electrification & Renewables: EVs use 3–4x more copper than internal combustion engines. Offshore wind, solar farms, and smart grid infrastructure require unprecedented copper input.
AI and Data Centers: AI infrastructure and high-powered computing require heavy-duty copper wiring and cooling systems. This sector alone could consume 1–2% of global copper demand by 2030.
Falling Ore Grades: As copper grades decline globally, more energy and capital are needed to produce each tonne, raising costs and limiting supply elasticity.
Lack of Discoveries: less than 20 new copper deposits have been discovered in the last decade, compared to over 200 in the prior 23 years.
Capital Intensity and Timelines: New mine development now averages 17+ years, making it nearly impossible to respond quickly to demand shocks.
Recycling Limitations: While helpful, recycling cannot offset primary demand growth in the next two decades.
Strategic Implications for Investors
For investors, the opportunity lies in positioning before the re-rate. Major mining companies are already investing in juniors, particularly in stable jurisdictions like British Columbia, Arizona, Ontario, and Australia.
As copper breaks out technically, capital will chase leverage, and junior explorers offer the highest torque to rising copper prices.
This isn’t about chasing hype. It’s about reading the signals that the market is quietly flashing:
Geopolitical risks realigning the global copper map
New Generation Copper Developers Are Stepping Up
Amid mounting supply pressures and accelerating global demand, a new wave of copper exploration and development companies is emerging to meet the challenge. These juniors are advancing well-positioned projects with strategic advantages, from shorter development timelines to favorable jurisdictions, that could help close the widening copper gap.
As majors increasingly turn to partnerships and acquisitions to secure future supply, these agile explorers and developers are becoming vital players in the next chapter of copper’s story.
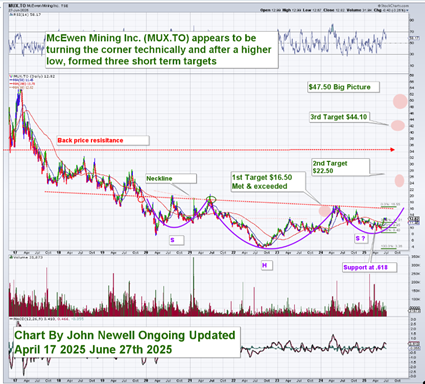
McEwen Mining Inc. (MUX:TSX; MUX:NYSE ) is advancing the massive Los Azules copper project in Argentina, one of the largest undeveloped copper projects in the world.
With over 10 billion pounds of contained copper, Los Azules represents a cornerstone asset with tremendous long-term leverage to rising copper prices.
Recent technical work and a defined development plan are moving the project toward pre-feasibility.
The company has also announced progress on infrastructure, permitting, and funding strategy, positioning itself as a potential takeover target or future producer as the copper cycle matures.
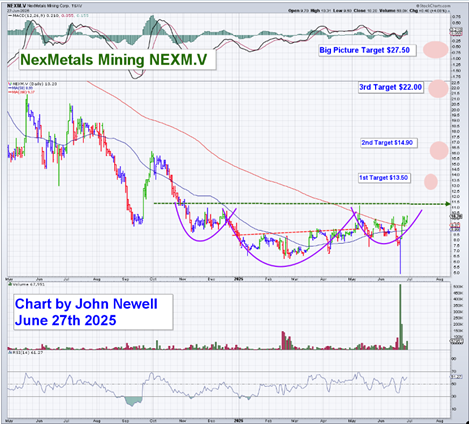
NexMetals Mining Corp. (NEXM:TSX.V) is quietly drilling into one of Botswana’s past-producing copper-nickel mines, and the story is picking up speed.
The Selkirk Mine already has a known copper-nickel-PGE footprint, and the company has completed 2,050 meters of new drilling with assays expected shortly.
A second drill rig is now turning, and NexMetals is also resampling historical holes and running metallurgical tests to define recovery parameters.
All this work is feeding into an updated mineral resource estimate, as the company positions Selkirk for a potential copper-Ni-PGE revival at a time when global supply remains tight.
It’s early days, but with the fundamentals behind copper and the right rocks in the right address, this is a name to keep an eye on.
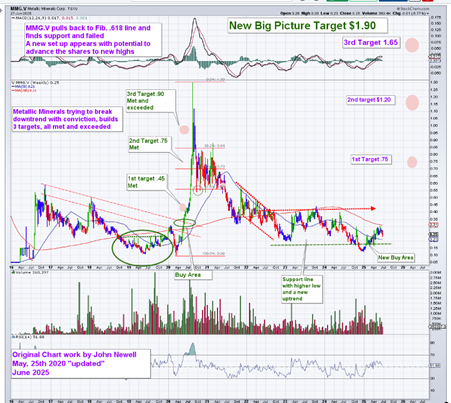
With Newmont (formerly Newcrest) holding a 9.5% stake and Eric Sprott at 12.5%, the company’s flagship La Plata Project in southwest Colorado is drawing comparisons to world-class porphyry systems like Cadia.
The 2023 resource at the Allard deposit shows 1.2 billion lbs of copper and 17.6 million oz of silver, with the next update expected to include gold and PGEs.
What stands out is the scale of the alteration system, over 25 km² with multiple untested targets, including Ridgeway-style zones that could host much higher grades.
With permits in place and Newmont technical input in the field, 2025 could be a breakout year.
Final Thoughts
Copper is no longer just a metal. It’s the backbone of electrification, data, mobility, and decarbonization. The market is beginning to wake up to this. But the technical charts suggest the real move hasn’t even started.
For investors who understand both the fundamental and technical case, copper could represent the most asymmetric opportunity of the next decade.
Important Disclosures:
Metallic Minerals Corp. is a billboard sponsor of Streetwise Reports and pays SWR a monthly sponsorship fee between US$4,000 and US$5,000.
John Newell: I, or members of my immediate household or family, own securities of: [None]. My company has a financial relationship with [None]. My company has purchased stocks mentioned in this article for my management clients: [None].I determined which companies would be included in this article based on my research and understanding of the sector.
Statements and opinions expressed are the opinions of the author and not of Streetwise Reports, Street Smart, or their officers. The author is wholly responsible for the accuracy of the statements. Streetwise Reports was not paid by the author to publish or syndicate this article. Streetwise Reports requires contributing authors to disclose any shareholdings in, or economic relationships with, companies that they write about. Any disclosures from the author can be found below. Streetwise Reports relies upon the authors to accurately provide this information and Streetwise Reports has no means of verifying its accuracy.
This article does not constitute investment advice and is not a solicitation for any investment. Streetwise Reports does not render general or specific investment advice and the information on Streetwise Reports should not be considered a recommendation to buy or sell any security. Each reader is encouraged to consult with his or her personal financial adviser and perform their own comprehensive investment research. By opening this page, each reader accepts and agrees to Streetwise Reports’ terms of use and full legal disclaimer. Streetwise Reports does not endorse or recommend the business, products, services or securities of any company.
As always it is important to note that investing in precious metals like silver carries risks, and market conditions can change violently with shock and awe tactics, that we have seen over the past 20 years. Before making any investment decisions, it’s advisable consult with a financial advisor if needed. Also the practice of conducting thorough research and to consider your investment goals and risk tolerance.
At the end of Tuesday, the Dow Jones Index (US30) rose by 0.91%. The S&P 500 Index (US500) fell by 0.11%. The Nasdaq (US100) Tech Index closed down 0.82%. The US stocks closed mixed on Tuesday after the Senate passed President Trump’s massive budget bill, while investors also kept an eye on trade developments. Enthusiasm about potential economic stimulus was tempered by concerns about the bill’s multi-trillion-dollar cost. The bill is projected to increase the national debt by $3.3 trillion. Tesla fell by 5.3% after Trump escalated his feud with Elon Musk, threatening to strip him of federal subsidies. Fed Chairman Jerome Powell maintained a cautious tone on rate cuts, noting tariff-related inflation risks and emphasizing the need for additional data.
European stock markets were mostly lower on Tuesday. Germany’s DAX (DE40) fell by 0.99%, France’s CAC 40 (FR40) closed down 0.04%, the Spanish IBEX35 (ES35) Index fell by 0.03%, and the British FTSE 100 (UK100) closed positive 0.28%. European stocks fell on Tuesday amid trade uncertainty and doubts that the ECB will continue to cut interest rates. According to reports, the EU is open to a deal that would impose a 10% universal tariff on many types of exports, but is demanding concessions from the US in key sectors such as pharmaceuticals, alcohol, semiconductors, and commercial aircraft. The head of the EU trade department is expected to lead a delegation to Washington this week to try to advance the negotiations. On the data front, preliminary figures showed the Eurozone inflation at 2%, as expected, and in line with the ECB’s target. Meanwhile, ECB chief economist Philip Lane said the recent cycle of Central Bank policy tightening was over.
WTI oil prices are holding steady at around $65 per barrel on Wednesday after rising in the previous session, as investors remain cautious ahead of OPEC+’s production decision. The group intends to increase production by 411,000 barrels per day in August, resulting in a total increase in production in 2025 of 1.78 million barrels per day — more than 1.5% of global demand. This move is seen both as a punishment for overproducers and as an attempt by Saudi Arabia to win market share from US shale fields and other countries.
Asian markets were mostly down yesterday. Japan’s Nikkei 225 (JP225) fell by 1.24%, China’s FTSE China A50 (CHA50) rose by 0.25%, Hong Kong’s Hang Seng (HK50) did not trade yesterday, and Australia’s ASX 200 (AU200) showed a negative result of 0.01%.
The Nikkei 225 (JP225) Index fell by 1.1% on Wednesday, marking the second consecutive day of losses for Japanese stocks. The decline came after US President Donald Trump threatened to impose 35% tariffs on Japanese imports in an attempt to pressure Tokyo into making trade concessions. Trump called negotiations with Japan “very tough,” repeating his criticism of the country’s unwillingness to accept American-made cars and rice. His comments heightened investor concerns, especially after Federal Reserve Chairman Jerome Powell said the Fed would have already cut interest rates if not for the inflationary impact of Trump’s tariffs.
On Wednesday, the New Zealand dollar traded around US$0.609, close to its highest level in more than eight months, helped by the general weakening of the US dollar. Meanwhile, investors are closely watching trade developments as many countries try to reach an agreement with the US before the July 9 deadline. In the domestic market, the Reserve Bank of New Zealand is expected to keep rates at 3.25% next week, with market prices indicating only a small chance of a 25 basis point cut.
The Australian dollar weakened to $0.656 on Wednesday, retreating from the previous session as weaker-than-expected domestic data dampened investor sentiment. The Australian Bureau of Statistics reported that retail sales rose 0.2% in May, higher than the revised April figure but below market expectations of 0.4% growth. The data reinforced expectations that the Reserve Bank of Australia will cut rates by 25 basis points to 3.60%, with markets increasingly pricing in the possibility of further easing in the second half of the year, which could see rates fall to 3.10% or even 2.85%.
S&P 500 (US500) 6,198.01 −6.94 (−0.11%)
Dow Jones (US30) 44,494.94 +400.17 (+0.91%)
DAX (DE40) 23,673.29 −236.32 (−0.99%)
FTSE 100 (UK100) 8,785.33 +24.37 (+0.28%)
USD Index 96.66 −0.21 (−0.22%)
News feed for: 2025.07.02
Australia Retail Sales (m/m) at 04:30 (GMT+3);
Eurozone Unemployment Rate (m/m) at 12:00 (GMT+3);
US ADP Nonfarm Employment Change (m/m) at 15:15 (GMT+3);
Canada Manufacturing PMI (m/m) at 16:30 (GMT+3);
Eurozone ECB President Lagarde Speaks at 17:15 (GMT+3);
This article reflects a personal opinion and should not be interpreted as an investment advice, and/or offer, and/or a persistent request for carrying out financial transactions, and/or a guarantee, and/or a forecast of future events.


