Iceland tightens further by raising capital buffer

By CentralBankNews.info

Iceland’s central bank tightened its monetary policy stance further by raising banks’ countercyclical capital buffer and capping the debt service-to-income ratios on consumer mortgages.
The Financial Stability Committee (FSN), part of the Central Bank of Iceland (CBI), raised the countercyclical capital buffer on financial institutions’ domestic exposure to 2.0 percent from zero, with the increase taking effect in 12 months.
      FSN also imposed a maximum debt service-to income ratio of 40 percent for first time home buyers and 35 percent for all other borrowers.
      CBI, which has already raised its key policy interest rate twice this year by 50 basis points, said the economic recovery, coupled with its accommodative monetary and macro prudential stance, had supported households and business while asset prices, including real estate prices, have risen markedly.
      “Uncertainly about financial institutions’ position has receded, and loan quality has improved,” FSN said, with the result they are now resilient enough to lend to households and businesses.
       In March last year CBI cut the countercyclical capital buffer to zero from 2.0 percent and today said that reduction was no longer needed.
     “The FSN is of the view that the combination of rapidly rising asset prices and increased household debt has already raised cyclical system risk to at least the pre-pandemic level,” CBI added.
      The debt service-to-income ratio measures the percentage of a borrowers’ disposable income that is used to make monthly mortgage payments and CBI said the purpose of the rules is to safeguard financial stability, shore up lenders’ and borrowers’ resilience against imbalances in the housing market, and limit the build-up of long-term systemic risk.
        The Central Bank of Iceland released following three statements:

“Statement of the Financial Stability Committee 29 September 2021

The economic recovery of the past few months, coupled with an accommodative monetary and macroprudential stance, has supported households and businesses. On the other hand, asset prices – equity securities and real estate prices in particular – have risen markedly.

The three large banks are strong, their capital and liquidity are well above regulatory minima, and they have ready access to liquidity in both krónur and foreign currencies. As a result, they are highly resilient.

In recent months, the rapid rise in house prices has gone hand-in-hand with increased household debt. Therefore, with the aim of containing long-term systemic risk, the Financial Stability Committee (FSN) has decided to adopt rules on maximum debt service-to-income (DSTI) ratios, as is provided for in Article 27 of the Act on Mortgage Lending to Consumers, no. 118/2016. In general, the maximum DSTI ratio shall be 40% for first-time buyers and 35% for all other borrowers. The ratio shall be calculated based on a specified maximum loan maturity. Lenders are granted an exemption from the rules for up to 5% of the total amount of new mortgage loans issued each quarter.

Uncertainty about financial institutions’ position has receded, and loan quality has improved. As a result, financial institutions are resilient enough to lend to households and businesses. In the FSN’s opinion, the scope it had granted to financial institutions after the pandemic reached Iceland, in the form of a reduction in the countercyclical capital buffer (CCyB), is no longer needed. The FSN is of the view that the combination of rapidly rising asset prices and increased household debt has already raised cyclical systemic risk to at least the pre-pandemic level. As a consequence, in view of the build-up of cyclical systemic risk, the FSN has decided to increase the CCyB from 0% to 2%. This decision will take effect twelve months from now, in accordance with the rules that apply to the countercyclical capital buffer. The CCyB proved its worth during the pandemic, and the Committee has given consideration to what a neutral buffer value should be in the future.

The FSN has concluded its annual review of the capital buffer for systemic importance (O-SII buffer) and has decided to hold it unchanged at 2% for all exposures at the parent company and the group level. The review of systemically important financial institutions, carried out in accordance with European Banking Authority methodology, confirmed the systemic importance of Arion Bank hf., Íslandsbanki hf., and Landsbankinn hf.

In view of recent cyberattacks and operational disruptions in payment intermediation, the FSN urges operating entities to examine the security of their systems and take steps to ensure business continuity. The Committee is of the view that, alongside payment cards, Iceland needs to have in place a domestic electronic retail payment solution that is independent of international financial infrastructure. This will bring increased operational security and efficacy. The Central Bank is preparing for the implementation of such a solution.

The Financial Stability Committee will continue to use every tool at its disposal to safeguard financial stability in Iceland.”

“Increase in countercyclical capital buffer

New Central Bank Rules on Countercyclical Capital Buffers for Financial Undertakings, no. 1076/2021, which were approved at a meeting of the Bank´s Financial Stability Committee (FSN) on 28 September 2021, were published in the Law and Ministerial Gazette today. With the new Rules, the value of the countercyclical capital buffer is increased to 2% of the risk base for financial institutions’ domestic exposures. The increase will take effect twelve months from now.

In the FSN’s opinion, the combination of rapidly rising asset prices and increased household debt has already raised cyclical systemic risk to at least the pre-pandemic level. As a result, the Committee is of the view that the scope granted to financial institutions in March 2020, with the reduction in the buffer, is no longer needed.

The countercyclical capital buffer is reviewed on a quarterly basis, and decisions to increase it generally do not take effect until twelve months later.”

“Central Bank sets new rules capping debt service-to-income ratios on consumer mortgages

The Central Bank of Iceland’s Rules on Maximum Debt Service-to-Income Ratios on Consumer Mortgages, no. 1077/2021, approved at a meeting of the Bank’s Financial Stability Committee on 28 September 2021, were published in the Law and Ministerial Gazette (Stjórnartíðindi) today. The Rules take effect on 1 December 2021.

The purpose of the Rules is to safeguard financial stability, shore up lenders’ and borrowers’ resilience against imbalances in the housing market, and limit the build-up of long-term systemic risk.

The debt service-to-income (DSTI) ratio measures the percentage of a borrower’s disposable monthly income that is used to make monthly mortgage payments. The term debt service refers to all payments of instalments and interest on loans secured by real estate. The ratio is calculated by dividing the monthly debt service on a mortgage loan by the borrower’s disposable monthly income.

According to the new Rules, debt service on new mortgage loans may not exceed 35% of the borrower’s disposable monthly income. For first-time buyers, the maximum is set at 40%. The Rules contain formulae for calculating the DSTI ratio, including provisions authorising lenders to cap loan maturities at 40 years for non-indexed mortgages and 30 years for indexed mortgages.

It should be noted that the Rules apply to mortgage loan agreements made after the Rules take effect.”


www.CentralBankNews.info

Gold, Bitcoin Prices: Expect More Pain Before Major Gains

By TheTechnicalTraders 

Chris talks with David Lin on Kitco News about Gold, Gold miners, Equities, and Bitcoin. Gold is not expected to hit new highs until next year while Bitcoin is still in a major bull pattern. Chris also went over the S&P 500 which is still in a raging bull market. Overall, both Bitcoin and gold prices have more consolidating to do before moves to new all-time highs happen.

CLICK ON THE IMAGE BELOW TO WATCH THE INTERVIEW

GET YOUR DAILY DOSE OF CHRIS’S SILVER AND GOLD ANALYSIS ALONG WITH THE HOTTEST ETFS TO TRADE WITH BAN TRADER PRO!

TheTechnicalTraders.com

Japanese Candlesticks Analysis 30.09.2021 (EURUSD, USDJPY, EURGBP)

Article By RoboForex.com

EURUSD, “Euro vs US Dollar”

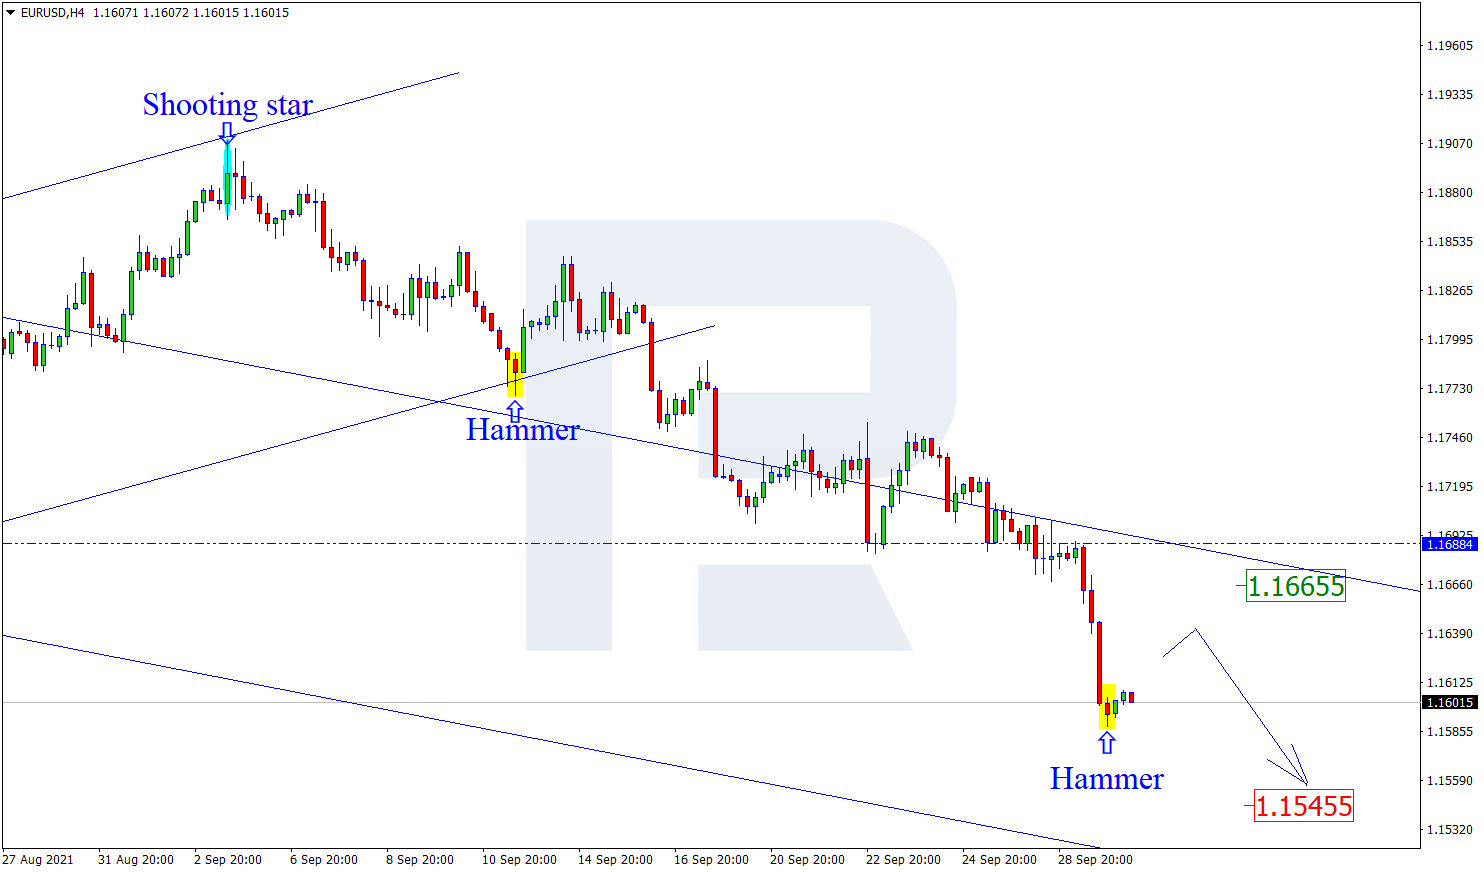
As we can see in the H4 chart, the asset has formed several reversal patterns, including Hammer, not far from the support level. At the moment, EURUSD may reverse and start a new pullback. In this case, the correctional target may be at 1.1665. Later, the market may rebound from the resistance area and resume trading downwards. However, an alternative scenario implies that the price may continue falling to reach 1.1545 without any corrections.

EURUSD
Risk Warning: the result of previous trading operations do not guarantee the same results in the future

USDJPY, “US Dollar vs Japanese Yen”

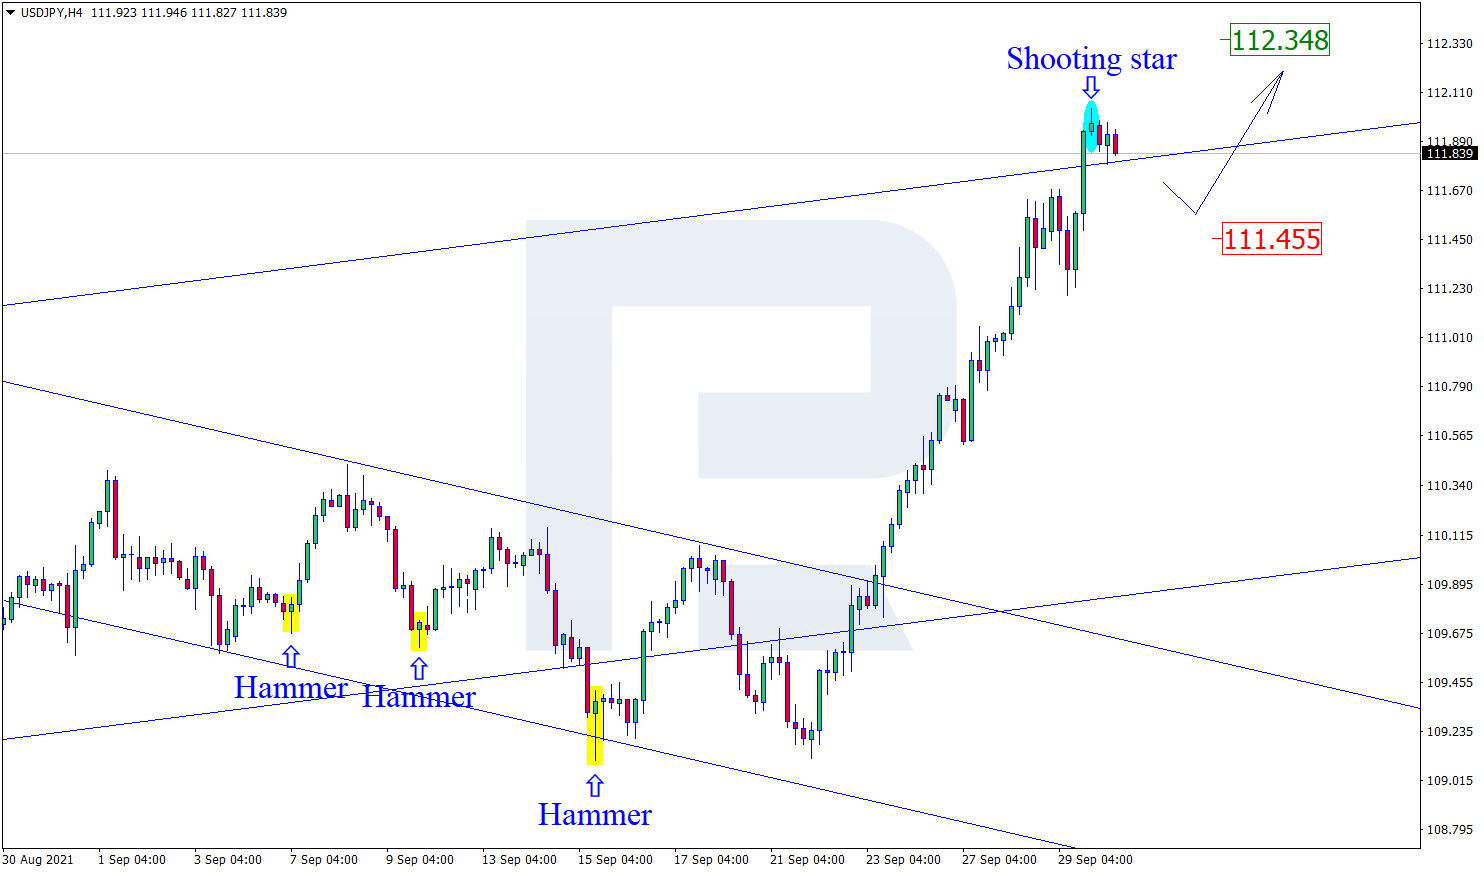
As we can see in the H4 chart, USDJPY has formed a several reversal patterns, for example, Shooting Star, close to the resistance area. At the moment, USDJPY is reversing and may start a new pullback within the uptrend. In this case, the correctional target may be at 111.45. At the same time, an opposite scenario implies that the price may continue growing to reach 112.34 without any corrections.

USDJPY
Risk Warning: the result of previous trading operations do not guarantee the same results in the future

EURGBP, “Euro vs Great Britain Pound”

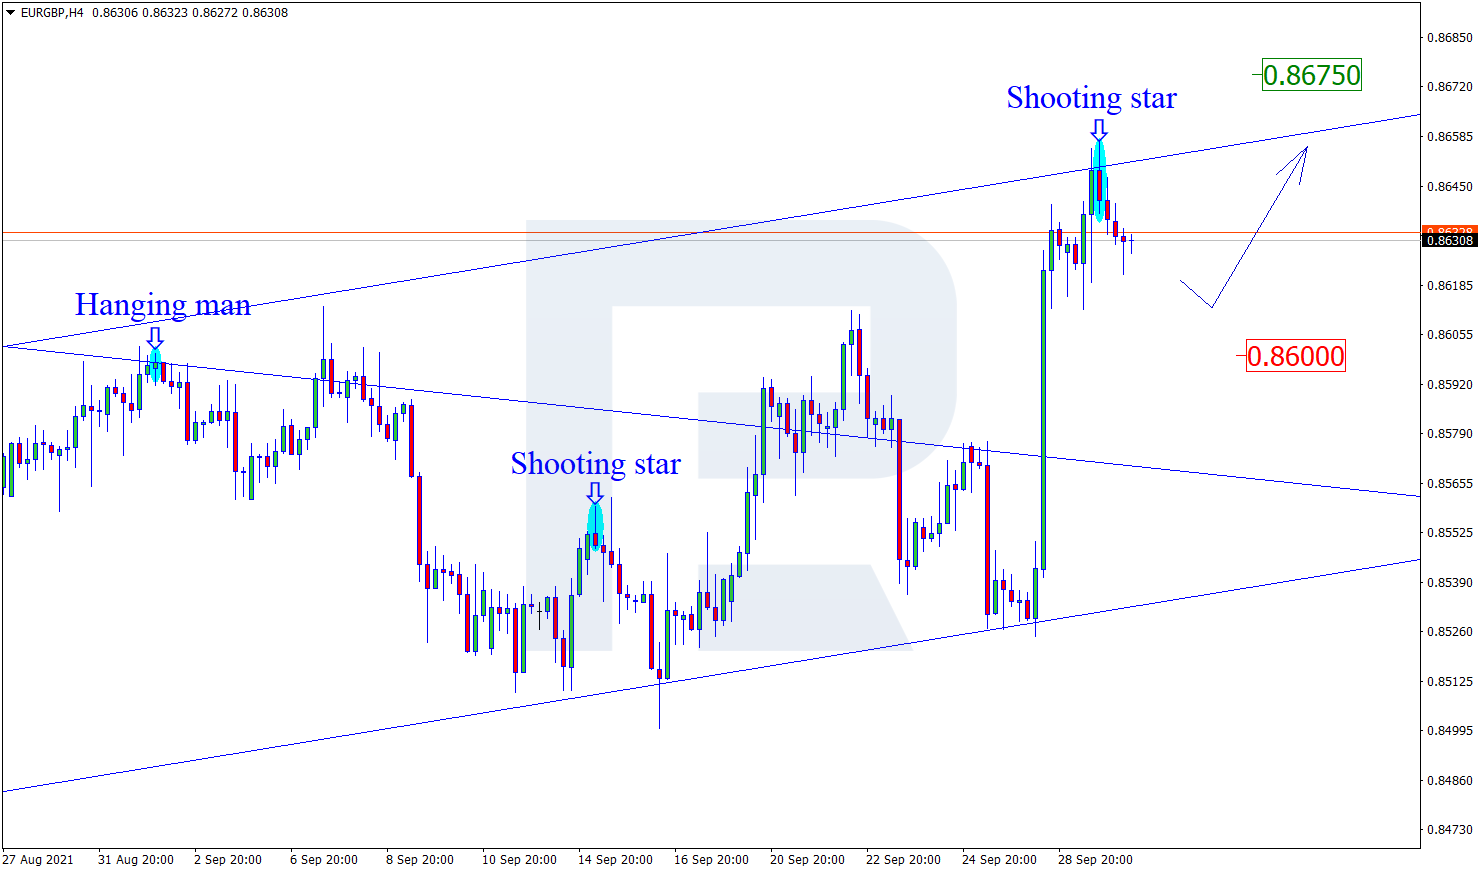
As we can see in the H4 chart, after forming a Shooting Star pattern near the resistance level, EURGBP may reverse in the form of a new pullback. In this case, the correctional target may be at 0.8600. Later, the market may test the support area, rebound from it, and resume the ascending tendency. Still, there might be an alternative scenario, according to which the asset may continue growing without any corrections towards the support area.

EURGBP

Article By RoboForex.com

Attention!
Forecasts presented in this section only reflect the author’s private opinion and should not be considered as guidance for trading. RoboForex LP bears no responsibility for trading results based on trading recommendations described in these analytical reviews.

SPX500 Bulls Target 4608.26

By Orbex

The SPX500 formation suggests the formation of a large bullish impulse.

At the time of writing, the primary wave ③ is under development. It is an impulse marked by intermediate sub-waves (1)-(2)-(3)-(4)-(5). This construction could soon come to an end.

In the near future, the price could fall slightly in the minor wave 4, then the bulls may send the market to 4608.26. At that level, intermediate wave (5) will be at the 123.6% Fibonacci extension of wave (3).

SPX500

Alternatively, the construction of the impulse wave ③ has already come to an end. Thus, in the near future, the market may begin to fall as part of the primary correction ④.

Consequently, we could expect a corrective decline near 3751.89 soon too. At that level, primary wave ④ will be at 38.2% of impulse wave ③.


Orbex-LogoArticle by Orbex

Orbex is a fully licensed broker that was established in 2011. Founded with a mission to serve its traders responsibly and provides traders with access to the world’s largest and most liquid financial markets. www.orbex.com

Murrey Math Lines 30.09.2021 (USDCHF, GOLD)

Article By RoboForex.com

USDCHF, “US Dollar vs Swiss Franc”

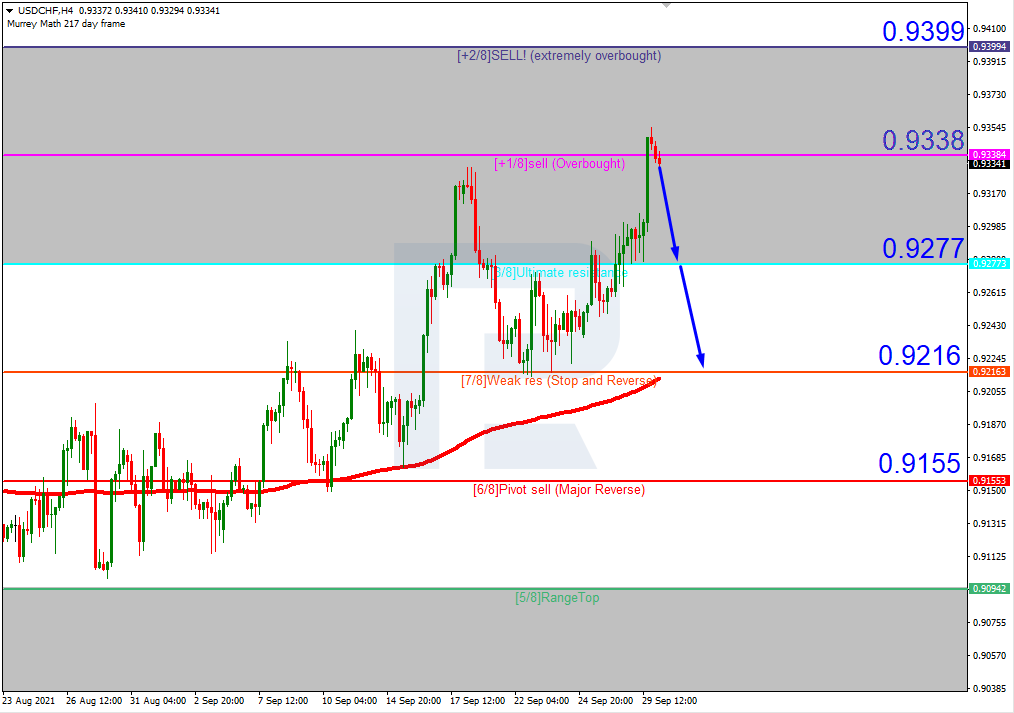
As we can see in the H4 chart, USDCHF is trading inside the “overbought area”. In this case, the price is expected to test 8/8, break it, and then continue falling to reach the support at 7/8. However, this scenario may be cancelled if the price breaks +1/8 to the upside. After that, the instrument may continue growing towards the resistance at +2/8.

USDCHFH4
Risk Warning: the result of previous trading operations do not guarantee the same results in the future

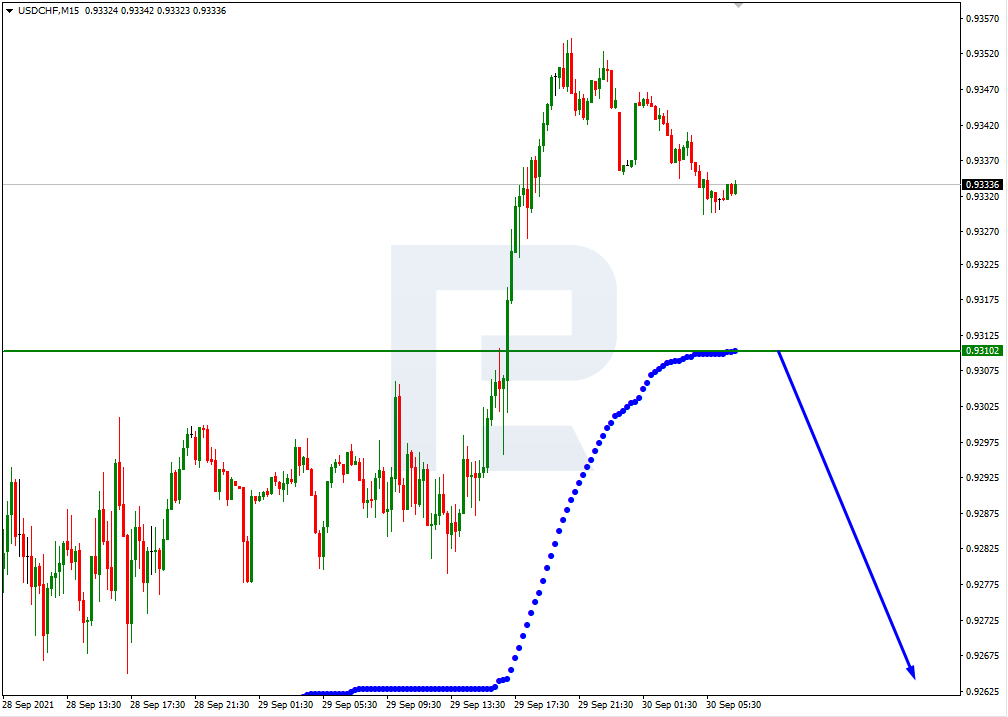
In the M15 chart, the pair may break the downside line of the VoltyChannel indicator and, as a result, continue trading downwards.

USDCHF_M15
Risk Warning: the result of previous trading operations do not guarantee the same results in the future

XAUUSD, “Gold vs US Dollar”

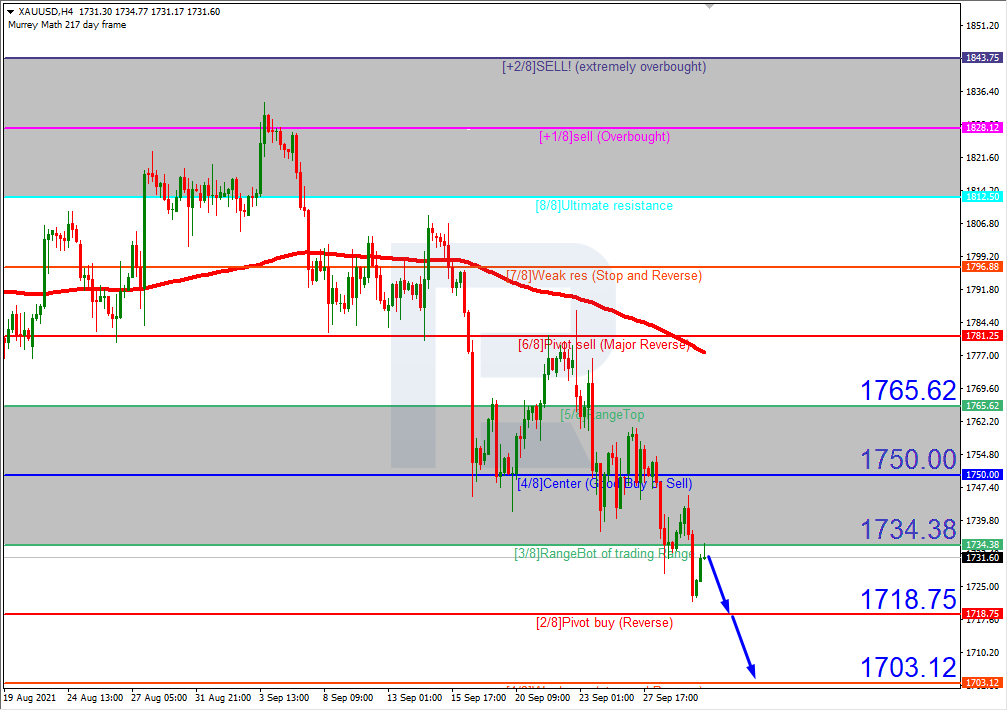
In the H4 chart, XAUUSD is trading below the 200-day Moving Average, thus indicating a descending tendency. In this case, the price is expected to break the support at 2/8 and then continue moving downwards to reach 1/8. However, this scenario may no longer be valid if the price breaks the resistance at 3/8 to the upside. After that, the instrument may reverse and grow towards 5/8.

XAUUSD_H4
Risk Warning: the result of previous trading operations do not guarantee the same results in the future

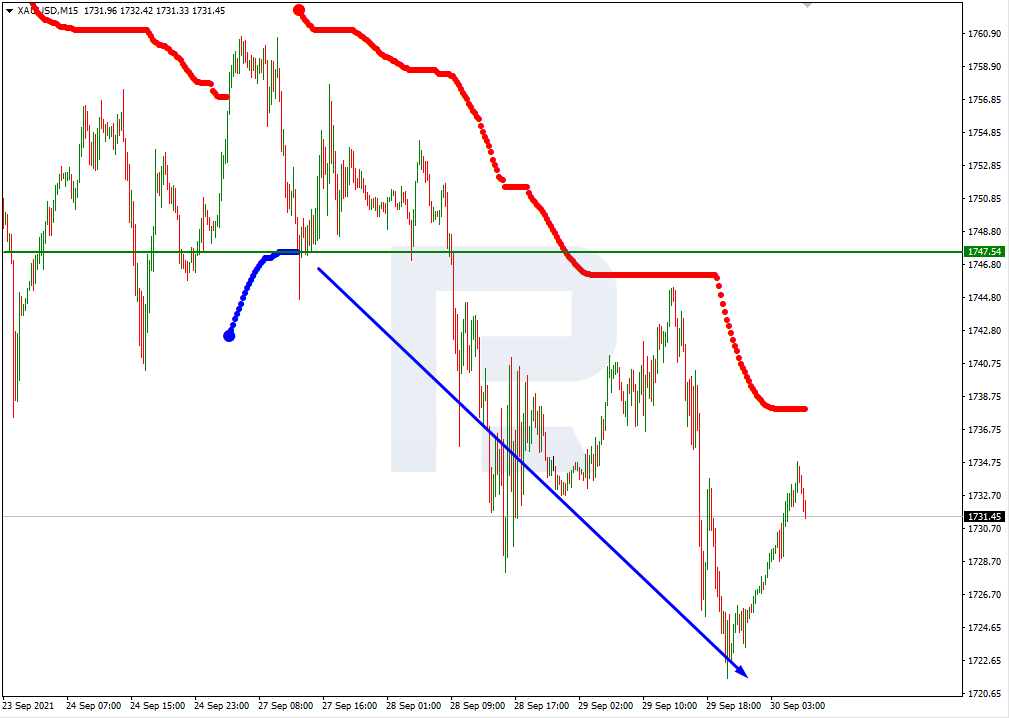
As we can see in the M15 chart, the pair has broken the downside line of the VoltyChannel indicator and, as a result, may continue its decline.

XAUUSD_M15

Article By RoboForex.com

Attention!
Forecasts presented in this section only reflect the author’s private opinion and should not be considered as guidance for trading. RoboForex LP bears no responsibility for trading results based on trading recommendations described in these analytical reviews.

America’s Revolving-Door Politics Behind the Fall of US-Sino Ties

By Dan Steinbock

– The US-Sino ties plunged in the Trump era, but the downfall has intensified in the Biden era. Without policy shifts, the tensions, fueled by defense contractors, translate to arms races and elevated nuclear risks in Asia.

In just nine months, Biden’s net ratings have plunged by a stunning 20 percent, which leaves him behind all U.S. postwar presidents except for Trump, many of whose policies his White House has embraced. Today, Biden’s performance divides the nation, just as Trump’s did before him.

True, Biden pledged to end America’s longest war in Afghanistan. That does not spell end to the “forever wars.” It only means shifts of resource allocations to new regions.  Last June, Bernie Sanders warned that such policies could “start another Cold War” against China.

The global challenges America faces – climate change, pandemics, nuclear proliferation, massive economic inequality, corruption and authoritarianism – are shared challenges. They cannot be overcome unilaterally, Sanders warned. It is “distressing and dangerous that a fast-growing consensus is emerging in Washington that views the U.S.-Chinese relationship as a zero-sum economic and military struggle.”

But if such policies are misguided, who benefits from the Cold War against China?

Revolving-door politics behind militarized foreign policy   

In 2019, Biden’s Asia Tsar Kurt Campbell and national security advisor Jake Sullivan touted a new China doctrine of stiff “competition without catastrophe.” As in the ‘50s, the effective objective is to militarize containment policy and minimize U.S. costs by diversifying risks to allies and proxy conflicts into Asia.

The new Cold War promoters like to refer to George Kennan, the architect of U.S. containment against Russia in 1947. Here’s the irony: Kennan himself began to push for dialogue with Moscow already a year later, when he denounced Truman administration’s “distorted” and “militarized” version of containment – which, he stressed to CNN in 1996, “led to 40 years of unnecessary, fearfully expensive and disoriented process of the Cold War.”

So why the disastrous doctrine? The short answer: It pays off to its promoters.

President Biden’s greatest mistake has been his willingness to let a handful of policy experts, each of whom has deep economic ties with defense contractors, to take over the US foreign policy. The credibility of each – Campbell, Sullivan, foreign affairs secretary Antony Blinken, and defense secretary Lloyd Austin – is undermined by conflicts of interests, as US government watchdogs and investigative journalists have recently reported.

The consequent US-Sino tensions were not inevitable. They are manufactured outcomes of the privatization of US foreign policy vis-a-vis campaign finance and revolving-door politics between the White House, the Pentagon and its contractors – as evidenced by the plunge of the bilateral ties.

Collapse of bilateral ties

In the Trump era, the bilateral relations plunged to a historical low. Instead of the hoped-for reset, Biden embraced Trump’s far-right anti-China policies.

High-Level Dialogues. Presidents Trump and Xi met five times in 2017-19, but the dialogue effectively collapsed. In the Biden era, bilateral ties are limited to a phone call in which Biden aimed to set “guardrails and parameters” so that “stiff competition does not veer into conflict.” But in China, unilateral directives amid an unwarranted Cold War sound like a bully’s monologue.

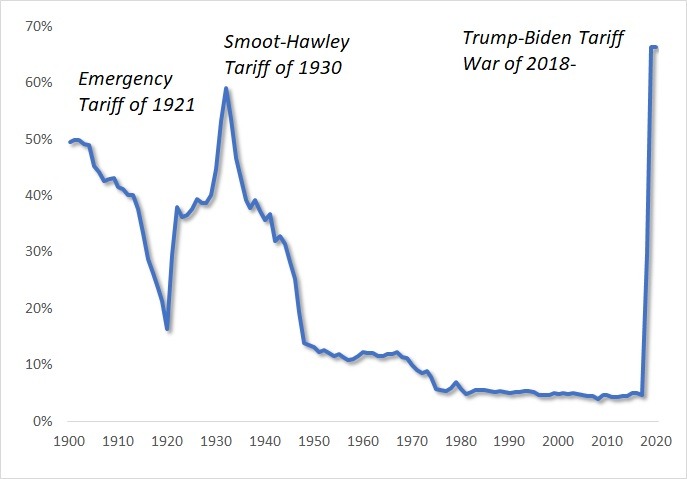
Trade. In bilateral trade, Biden embraced Trump’s protectionism and tariff wars. Both have hit hard American consumers. Similarly, US businesses are frustrated with Biden’s decision to retain Trump’s confrontational China policies. They know that Cold Wars are preludes to Hot Wars. In 1930, President Herbert Hoover signed the Smoot-Hawley Tariff Act, which worsened the effects of the Great Depression, serving as a prelude to still another world war (Figure 1).

Figure 1 The Trump-Biden Tariffs toward Hot War

Sources: Chad P. Bown and Douglas A. Irwin 2018.


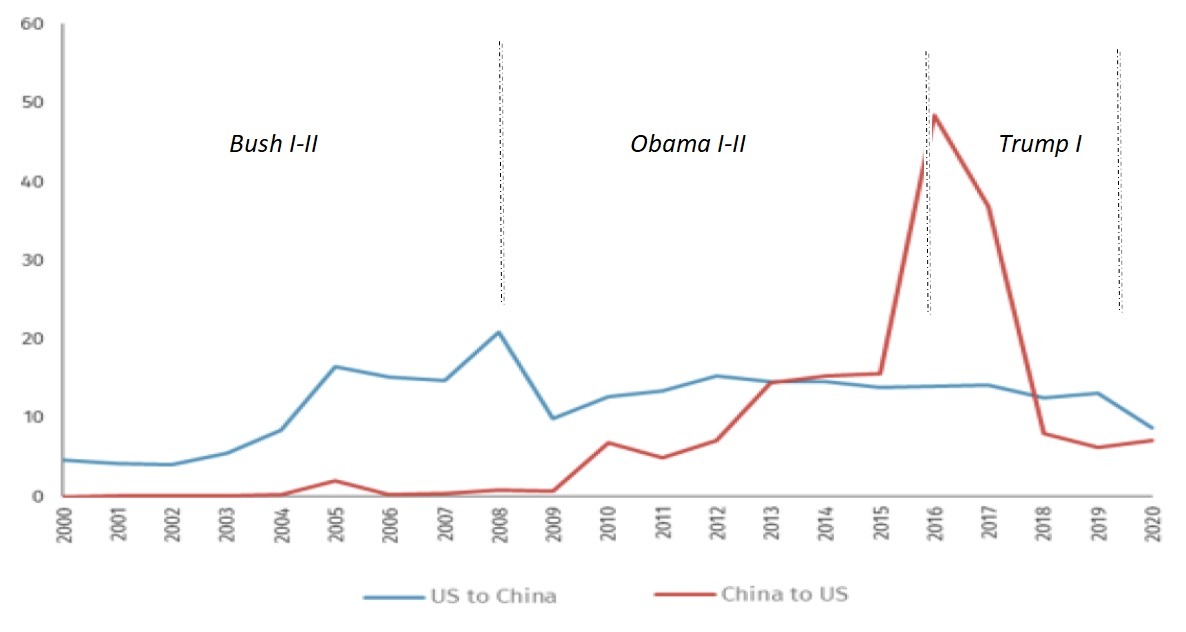
Investment. In 2016, prior to the Trump era, US foreign investment in China was $15 billion, while Chinese investment in the US soared to more than $50 billion. Today, each figure is closer to $8 billion or so (Figure 2).

Figure 2 FDI transactions between the US and China, 2000-2020 ($ bn)

Source: Rhodium Group; Difference Group


Military-to-Military Relations. If a bilateral catastrophe is to be avoided, high-level military ties play a critical role. Yet, in the Trump era, US-China military engagements fell from 30 in 2016 by more than two-thirds by 2019, while plunging in 2020. What’s left focuses narrowly on risk reduction.

Climate change. In the Obama era, climate change was the one area of bilateral ties that showed the promise of cooperation. In the Trump-Biden era, that promise is fading, as Biden’s climate diplomat John Kerry discovered recently in Beijing. When Kerry urged China to move its peak emissions target, foreign minister Wang Yi noted that when Washington’s grand strategy has targeted China as a “threat and adversary,” it puts all bilateral cooperation at risk.

The current tensions are the net effect of a decade of missed opportunities.

Opposite stances to manage Sino-US ties

In 2013, when Chinese president Xi Jinping met with president Obama at Sunnylands, he promoted the idea of a “new type of great-power relations.” When the Pax Britannica was superseded by the Pax Americana, the lingering transition resulted in two world wars. As the size of the Chinese economy is projected to exceed that of the United States by the late 2020s, Xi saw a historical opportunity to avoid misguided conflicts and to focus on economic development that would benefit both major powers.

However, the Obama administration stayed away from the idea, nixed it and replaced it with the shift to “renewed great power competition.” The new doctrine was first affirmed in the Obama administration’s National Military Strategy (Jun 2015). And it was placed at the center of the Trump administration’s National Security Strategy (Dec 2017) and National Defense Strategy (Jan 2018).

Stressing inclusion, dialogue and multilateralism in the global economy, China advocated “new type of great power relations,” which Washington rejected. Emphasizing the quest for full spectrum military supremacy, US promoted increasing force deployments and large-scale, high-end warfare capabilities against Beijing.

The contrast between the two stances could not be greater.

Sleepwalking into catastrophe

Since 1945, the only successful economic modernization worldwide has occurred in Asia, with focus on economic development. But after a decade of US pivot to the region, arms races and nuclear threats risk undermining the Asian Century.

According to the new trilateral security pact (AUKUS) between the US, the UK and Australia, Washington and London will “help” Canberra to develop and deploy nuclear-powered submarines. The $66 billion deal effectively killed Australia’s $90 billion conventional sub deal with France. Stunningly, US and Australian officials had been in secret talks for months over the plan that was hatched more than a year ago by the far-right Trump administration. Yet, it was both embraced and accelerated by the Biden White House.

The pact will dramatically escalate regional nuclear proliferation, which is strongly opposed by China and casts a dark shadow over the Southeast Asian Nuclear-Weapon-Free Zone Treaty (1995).

First tremors were felt months ago, twice. During the U.S. 2016 election and the subsequent Capitol riot, Joint Chiefs Chairman Mark Milley had reason to be concerned about President Trump’s possible use of war to distract attention from domestic turmoil. According to The Peril, the new book by Bob Woodward and Robert Costa, Milley took secret action to limit Trump and called Chinese General Li Zuochen to “convey reassurance in order to maintain strategic stability.”

Demonstrating great restraint, Milley did whatever he could to neutralize the risks. But what about the next time?

Neither the White House nor the Pentagon seems to be effectively in charge anymore. Defense contractors are.

About the Author:

Dr. Dan Steinbock is an internationally recognized strategist of the multipolar world and the founder of Difference Group. He has served at the India, China and America Institute (USA), Shanghai Institutes for International Studies (China) and the EU Center (Singapore). For more, see https://www.differencegroup.net 

A version of the commentary was originally published by China-US Focus on Sep. 29, 2021.


The Analytical Overview of the Main Currency Pairs on 2021.09.30

by JustForex

The EUR/USD currency pair

Technical indicators of the currency pair:
  • Prev Open: 1.1682
  • Prev Close: 1.1596
  • % chg. over the last day: -0.74%

The EUR/USD exchange rate decreased to its lowest level in 14 months as the energy crisis in Europe, caused by a sharp increase in natural gas prices, raises concerns about the strength of the economic recovery in the Eurozone and increases negative pressure on the currency.

Trading recommendations
  • Support levels: 1.1564, 1.1453
  • Resistance levels: 1.1671, 1.1717, 1.1772, 1.1802, 1.1835

From the technical point of view, the EUR/USD trend has changed to bearish. On the background of the weakness of the European currency, the quotes went down sharply. The price has broken through and consolidated below the priority change level. Under such market conditions, traders should consider sell deals from the resistance levels near the moving average, as the price has deviated strongly from the middle line. Buy trades should be considered only from the support levels with additional confirmation in the form of a buyers’ initiative.

Alternative scenario: if the price breaks out through the 1.1717 resistance level and fixes above, the mid-term uptrend will likely resume.

EUR/USD
News feed for 2021.09.30:
  • – German Unemployment Rate (m/m) at 10:55 (GMT+3);
  • – Eurozone Unemployment Rate (m/m) at 12:00 (GMT+3);
  • – US Initial Jobless Claims (w/w) at 15:30 (GMT+3);
  • – US GDP (q/q) at 15:30 (GMT+3);
  • – US Chicago PMI (m/m) at 16:45 (GMT+3);
  • – US FOMC Member Williams’s Speech at 17:00 (GMT+3);
  • – US FOMC Member Bostic’s Speech at 18:00 (GMT+3).

The GBP/USD currency pair

Technical indicators of the currency pair:
  • Prev Open: 1.3527
  • Prev Close: 1.3425
  • % chg. over the last day: -0.75%

The British pound is also rapidly losing its position amid the dollar index rising. In addition to problems with getting food to the store shelves and fuel to the gas stations, energy problems have also been added. Three more power suppliers in the UK have stopped working.

Trading recommendations
  • Support levels: 1.3360, 1.3282
  • Resistance levels: 1.3525, 1.3617, 1.3685, 1.3759, 1.3812, 1.3886

On the hourly time frame, the GBP/USD trend is bearish. The MACD indicator is negative, but there are signs of overselling and divergence. Buy trades should be considered only throughout the day and only with short targets from the support levels after the buyer’s initiative. Sell trades can be found at the resistance levels near the moving average line, as the price has deviated from the average values.

Alternative scenario: if the price breaks out through the 1.3759 resistance level and consolidates above, the bullish scenario will likely resume.

GBP/USD
News feed for 2021.09.30:
  • – UK GDP (q/q) at 09:00 (GMT+3).

The USD/JPY currency pair

Technical indicators of the currency pair:
  • Prev Open: 111.46
  • Prev Close: 111.97
  • % chg. over the last day: +0.46%

The Japanese Yen futures continue to decline as a result of the strengthening dollar index and a slowdown in the economic recovery in Japan. Japan’s industrial production fell by 3.2% month-on-month in August due to the weak automotive production against the background of a global shortage of chips and failures in supply chains.

Trading recommendations
  • Support levels: 111.49, 110.95, 110.65, 110.40, 109.95, 109.63, 109.27
  • Resistance levels: 112.19

The main trend of the USD/JPY currency pair is bullish. Against the background of the Japanese Yen weakness and strengthening of the dollar index, the USD/JPY quotes continue to grow. The angle of the ascending channel has decreased, while the MACD indicator continues to signal overbuying and divergence. All these are signs of the buyer’s weakness. Under such market conditions, it’s better to look for buy positions from the support levels after a small pullback. The price has deviated strongly from the moving average, and now there is a high probability of decline. Sell positions should be considered only throughout the day from the resistance levels in conjunction with the sellers’ initiative.

Alternative scenario: if the price falls below 110.45, the uptrend is likely to be broken.

USD/JPY
News feed for 2021.09.30:
  • – Japan Industrial Production (m/m) at 02:50 (GMT+3);
  • – Japan Retail Sales (m/m) at 02:50 (GMT+3);
  • – Japan BoJ Gov Haruhiko Kuroda’s Speech at 10:10 (GMT+3).

The USD/CAD currency pair

Technical indicators of the currency pair:
  • Prev Open: 1.2686
  • Prev Close: 1.2754
  • % chg. over the last day: +0.53%

The Canadian dollar is a commodity currency, so USD/CAD is highly dependent on the dynamics of the dollar index and oil prices. The dollar index sharply jumped yesterday, while oil prices remained unchanged. As a result, the USD/CAD quotes increased due to the weakness of the Canadian currency.

Trading recommendations
  • Support levels: 1.2701, 1.2611, 1.2565, 1.2518, 1.2425
  • Resistance levels: 1.2774, 1.2891

From the technical point of view, the trend on the USD/CAD currency pair is bearish. But the local trend is bullish and the price has approached the priority change level. The MACD indicator has returned to the positive zone, there are signs of buyers. Under such market conditions, it is better to look for buy deals from the support levels, but only with short targets. It is best to look for sell deals from the resistance levels after the sellers’ initiative in the form of an impulse movement.

Alternative scenario: if the price breaks out through the 1.2774 resistance level and fixes above, the uptrend will likely resume.

USD/CAD
There is no news feed for today.

by JustForex


This article reflects a personal opinion and should not be interpreted as an investment advice, and/or offer, and/or a persistent request for carrying out financial transactions, and/or a guarantee, and/or a forecast of future events.

PMI Day: Is Optimism Running Out?

By Orbex

As the first day of the month, tomorrow sees the release of PMI data from across the world.

Heading into the weekend with China closed for a holiday, we could have some extra volatility in pretty much every currency pair.

After the beat in PMI data from China yesterday, there has been some renewed optimism. In fact, the global business outlook might come in better than the initial predictions.

The general theme among the forecasts for October PMIs is a slight decline in optimism. Nonetheless, this is the norm for businesses as they calibrate their outlook throughout the winter.

This is indicative of how countries south of the equator will see a boost to their PMIs, while northern hemisphere companies could see lower numbers. Lower PMIs can also weigh on stock market performance, particularly going into a weekend.

What to look out for

Australia

Economists anticipate the Australian Markit Manufacturing PMI to jump quite a bit to 57.3 from a prior of 52,0.

This follows announcements from several Premiers that lockdowns will end before Christmas. Particularly now that Australia is going into their summer season, there will be higher economic activity and hopefully less covid spread.

The UK

On the other hand, we can expect the UK’s Markit/CIPS Manufacturing PMI to drop to 56.3 from 60.3. It could potentially go lower, as the survey was carried out just as there were media concerns of energy supply shortages.

Switzerland

Analysts expect the Swiss procure.ch Manufacturing PMI to slip slightly to 65.5 from 67.7 in the prior reading.

They are apparently factoring in the expectation that Switzerland’s largest trading partners are facing a potentially difficult winter. However, given the size of Switzerland’s health care sector, their manufacturers appear as the most optimistic in Europe.

The EU

The expectation for the Spanish Markit Manufacturing PMI is to remain quite optimistic. Nevertheless, it could dip to 58.2 from 59.5. This is in line with peripheral countries having more room to grow since covid impacted them more severely at first.

The Italian Markit Manufacturing PMI will also show a modest decline to 59.4 from 60.9 in the prior month. A factor the markets might pay more attention to is the “incoming orders” data release. They do so to see if European firms are holding back on investments going into the winter.

The forecast for the French Markit Manufacturing PMI is to drop marginally to 55.2 from the previous 57.2. This is still well in expansion, but French authorities’ refusal to rule out further lockdowns this year might not be the best for inspiring business confidence.

The German Markit Manufacturing PMI will be the most affected, dropping to 58.5 from 62.6 prior. Some of this is probably related to the expectation that supply chain shortages will get worse over the coming months. Also, China’s potential financial woes might hit Germany, as the country is the largest buyer of German-manufactured goods.

Lastly, the EU’s Market Manufacturing PMI could dip below the psychologically important level of 60, coming in at 58.7 from 61.4. A miss in expectations by over two points could significantly damage investor sentiment and weigh on the markets.

On the other hand, it’s likely that the market will be caught off guard if PMIs are higher this month than before. In turn, this could push indices higher.


Orbex-LogoArticle by Orbex

Orbex is a fully licensed broker that was established in 2011. Founded with a mission to serve its traders responsibly and provides traders with access to the world’s largest and most liquid financial markets. www.orbex.com

Intraday Market Analysis – GBP In Bearish Reversal

By Orbex

GBPUSD turns bearish

GBPUSD

The sterling struggles to stabilize as the UK braces for a fuel supply shock.

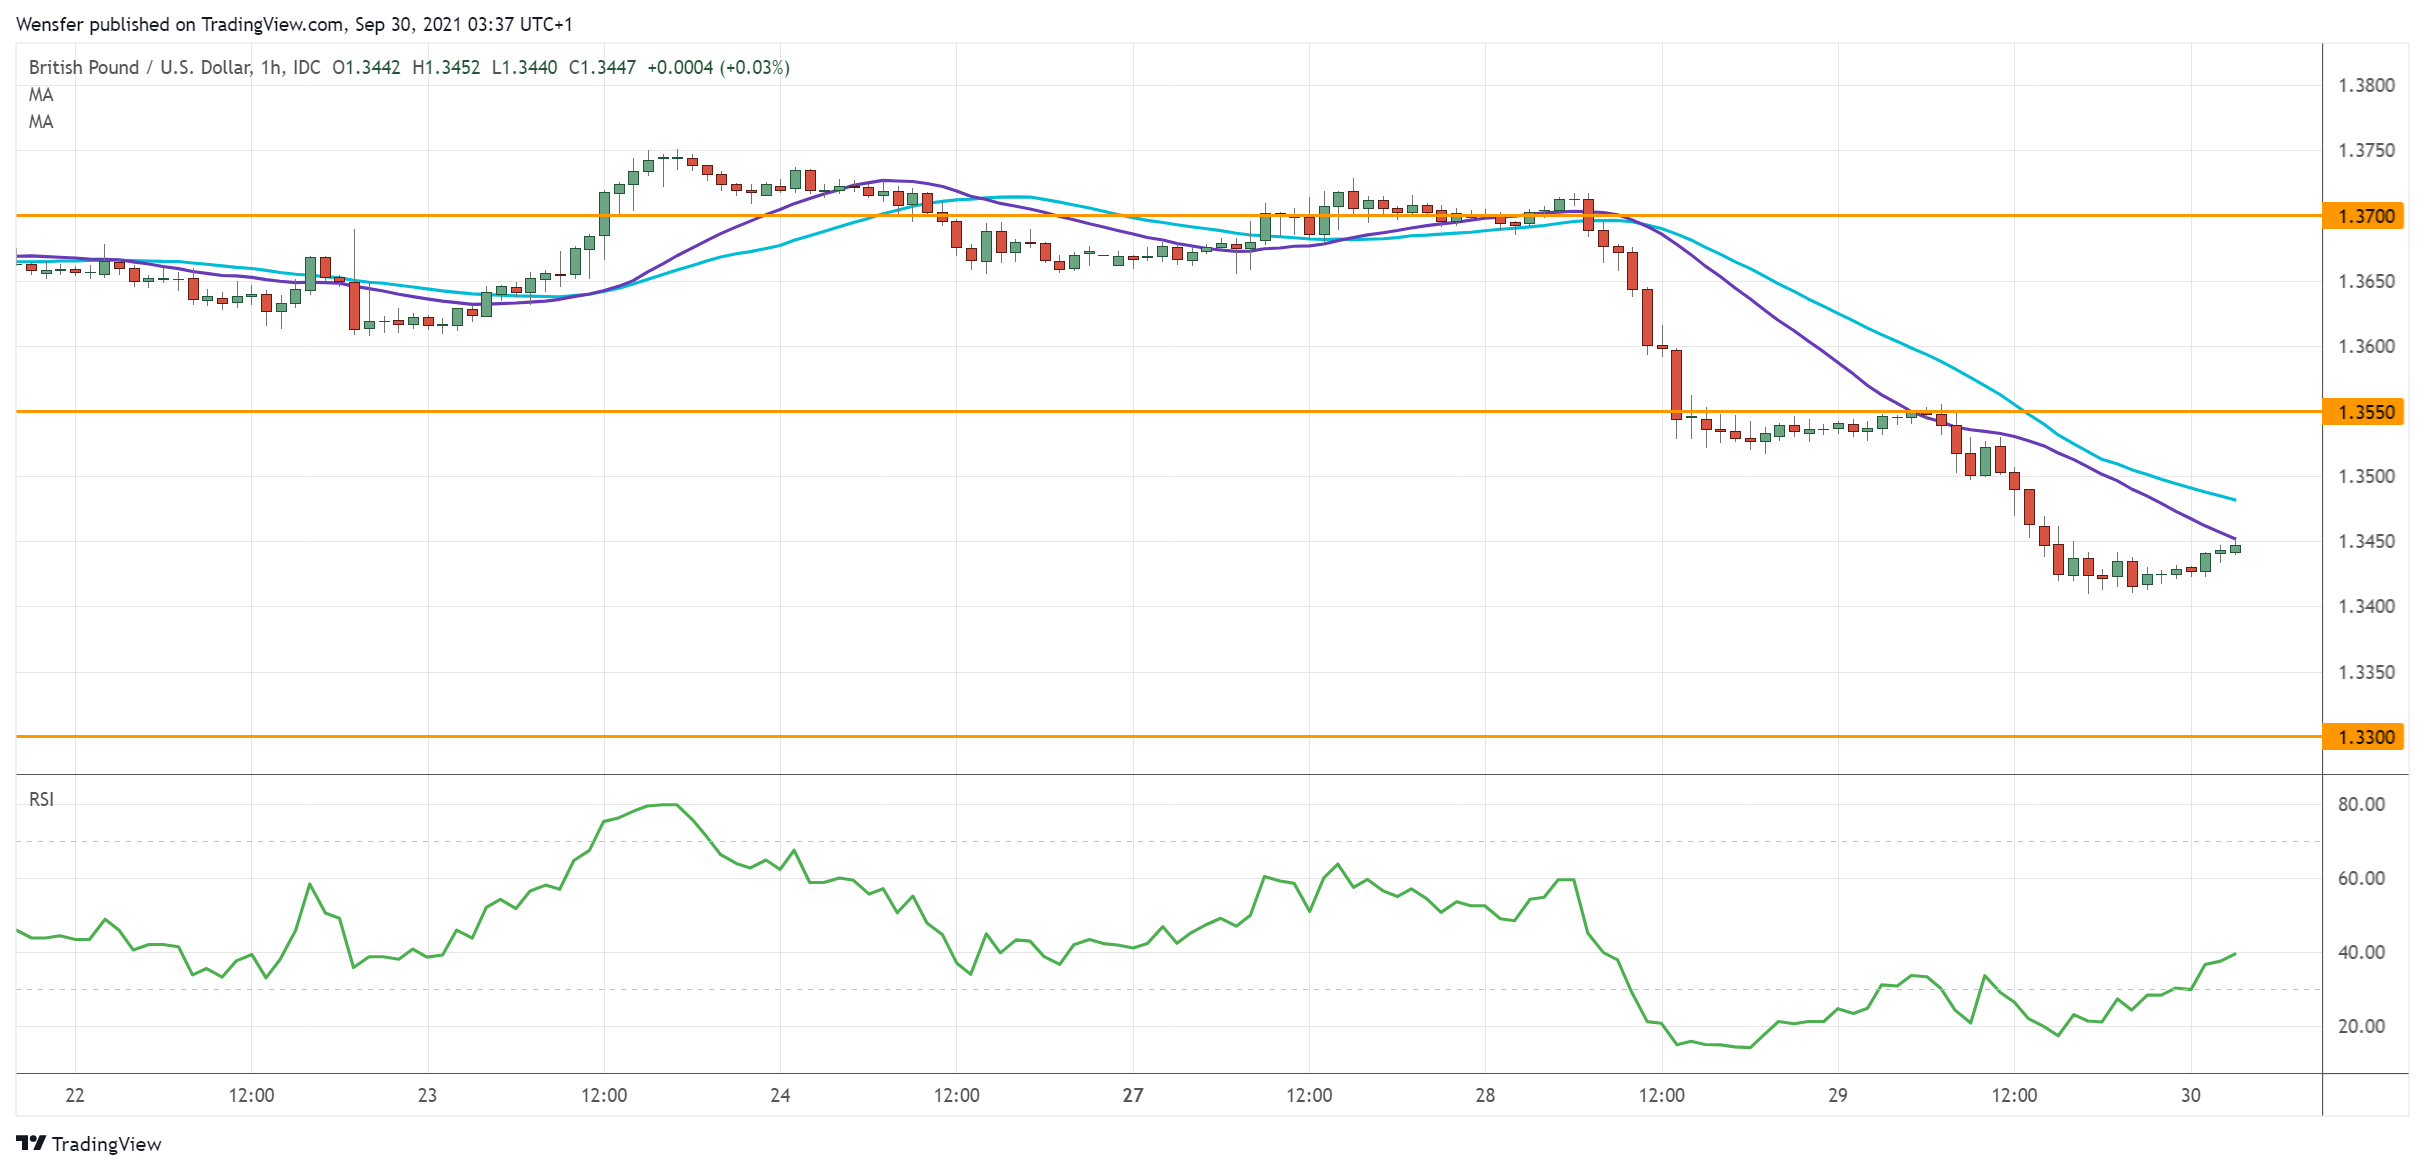
After three months of sideways action, the break below the daily support at 1.3600 could be the confirmation that the pound has sunk into a downtrend.

Strong momentum suggests that those who bought the dips had to bail out. 1.3300 is the next target.

A deeply oversold RSI would cause a limited rebound when short-term sellers take profit. 1.3550 is likely to cap the bounce with bears waiting to sell into strength.

NAS 100 tests crucial support

US100

The Nasdaq 100 tumbles as surging bond yields weigh on growth stocks.

The retest of the demand zone around 14750 from the daily chart has put the bulls under pressure. The break below 14850 has invalidated last week’s rebound, raising the odds for another round of sell-off.

The RSI’s double-dip into the oversold area has offered some temporary respite. However, unless buyers can lift 15220, a rebound would be an opportunity to sell. Below the said critical floor, the index could be vulnerable to a plunge towards 14500.

USOIL seeks support

USOIL

WTI crude dipped after the EIA reported an increase in US inventories.

The rally has met stiff selling pressure near July’s high (77.00). The RSI’s bearish divergence signaled a halt in the upward momentum.

Then a combination of profit-taking and fresh selling has pushed the price below the first support at 75.20. A bearish MA cross also points to a U-turn.

A pullback is necessary to let the bulls catch their breath. The resistance-turned-support at 73.00 would be a key level to keep the sentiment unscathed.


Orbex-LogoArticle by Orbex

Orbex is a fully licensed broker that was established in 2011. Founded with a mission to serve its traders responsibly and provides traders with access to the world’s largest and most liquid financial markets. www.orbex.com

China is ready to buy coal at any price because of the energy crisis

by JustForex

The US stock market closed without a single trend yesterday. The Dow Jones index increased by 0.26%, the S&P 500 added 0.16%, and the NASDAQ lost 0.24%. The dollar increased to its highest level in almost a year despite a possible US default and the prospect of more budget cuts than originally planned. Though, according to preliminary information, Democratic leaders have reached an agreement on a vote on the debt limit. Republicans will no longer block the vote.

Fed Chairman Jerome Powell said in his speech yesterday that the US was getting closer to cutting asset purchases. Analysts expect the official announcement to be made at the next Fed meeting in early November.

European stock indices increased yesterday. The British FTSE 100 added 1.1% to a three-week high, German DAX and French CAC 40 added 0.8% each, Italian FTSE MIB increased by 0.6%, Spanish IBEX 35 jumped by 1.3%. AstraZeneca (+4.2%) was one of the leaders in the growth of quotes on Wednesday. The pharmaceutical company announced the purchase of a stake in Caelum Biosciences Inc. for 150 million euros. Also, the quotes of the Italian UniCredit bank (+3.7%) and the Spanish Banco de Sabadell S.A. (+3.7%) significantly increased.

The balance sheet of the European Central Bank reached another record, showing that Europe keeps printing money to the max. Total assets grew by 28.6 billion. The ECB balance is >80% of Eurozone GDP against 37.3% for the Fed, 38.8% for the Bank of England, and 133.7% for the Bank of Japan. ECB President Christine Lagarde says that the EU will return to pre-pandemic levels by the end of the year, and supply chain problems should disappear in the first half of 2022.

Despite an increase of more than 500,000 barrels a day in oil production, the recovery from Hurricane Ida continues to lag as US oil production remains lower by 400,000 barrels a day.

As the dollar index and US government bond yields rise, gold and silver prices are declining. Fundamentally, there is no reason to buy these precious metals now.

Since winter is coming and natural gas prices are at record highs, economies around the world are competing for limited coal supplies. China’s energy crisis has led to a surge in shipping costs as the nation is buying up coal to power its economy this winter. China’s coal shortage means higher prices for the rest of the world. China, the world’s top coal consumer, is in dire need of more supplies and is willing to pay any price. Such a move threatens to leave less fuel for energy-starved competitors. Industrial activity in China declined in September for the first time since the pandemic began last year. It is a sign of the damage that the power shortages are doing to the economy.

Japan’s Nikkei index lost 0.36% over the day after Japan’s ruling party chose Fumio Kishida as its new leader and prime minister. Fumio Kishida supports a conservative policy.

Main market quotes:

S&P 500 (F) 4,359.46 +6.83 (+0.16%)

Dow Jones 34,390.72 +90.73 (+0.26%)

DAX 15,365.27 +116.71 (+0.77%)

FTSE 100 7,108.16 +80.06 (+1.14%)

USD Index 94.40 +0.63 (+0.67%)

Important events for today:
  • – Japan Industrial Production (m/m) at 02:50 (GMT+3);
  • – Japan Retail Sales (m/m) at 02:50 (GMT+3);
  • – China Manufacturing PMI (m/m) at 04:00 (GMT+3);
  • – UK GDP (q/q) at 09:00 (GMT+3);
  • – Japan BoJ Gov Haruhiko Kuroda’s Speech at 10:10 (GMT+3);
  • – German Unemployment Rate (m/m) at 10:55 (GMT+3);
  • – Eurozone Unemployment Rate (m/m) at 12:00 (GMT+3);
  • – US Initial Jobless Claims (w/w) at 15:30 (GMT+3);
  • – US GDP (q/q) at 15:30 (GMT+3);
  • – US Chicago PMI (m/m) at 16:45 (GMT+3);
  • – US FOMC Member Williams’s Speech at 17:00 (GMT+3);
  • – US Natural Gas Storage (w/w) at 17:30 (GMT+3);
  • – US FOMC Member Bostic’s Speech at 18:00 (GMT+3).

by JustForex


This article reflects a personal opinion and should not be interpreted as an investment advice, and/or offer, and/or a persistent request for carrying out financial transactions, and/or a guarantee, and/or a forecast of future events.