CORBEVAX, a new patent-free COVID-19 vaccine, could be a pandemic game changer globally

By Maureen Ferran, Rochester Institute of Technology

The world now has a new COVID-19 vaccine in its arsenal, and at a fraction of the cost per dose.

Two years into the COVID-19 pandemic, the world has seen over 314 million infections and over 5.5 million deaths worldwide. Approximately 60% of the world population has received at least one dose of a COVID-19 vaccine. But there is still a glaring and alarming gap in global access to these vaccines. As a virologist who has followed this pandemic closely, I contend that this vaccine inequity should be of grave concern to everyone.

If the world has learned anything from this pandemic, it’s that viruses do not need a passport. And yet approximately 72% of vaccine doses were administered in high- and upper-middle-income countries – and only 1% in low-income countries. Wealthy countries are giving boosters, and even fourth doses, while first and second doses are not available to many worldwide.

But there is hope that a new vaccine called CORBEVAX will help close this vaccination gap.

How does the CORBEVAX vaccine work?

All COVID-19 vaccines teach the immune system how to recognize the virus and prepare the body to mount an attack. The CORBEVAX vaccine is a protein subunit vaccine. It uses a harmless piece of the spike protein from the coronavirus that causes COVID-19 to stimulate and prepare the immune system for future encounters with the virus.

Recombinant vaccines commonly use yeast to produce the immune-stimulating proteins of a virus in the lab.

Unlike the three vaccines approved in the U.S. – Pfizer and Moderna’s mRNA vaccines and Johnson & Johnson’s viral vector vaccine, which provide the body instructions on how to produce the spike protein – CORBEVAX delivers the spike protein to the body directly. Like those other approved COVID-19 mRNA vaccines, CORBEVAX also requires two doses.

How was CORBEVAX developed?

CORBEVAX was developed by the co-directors of the Texas Children’s Hospital Center for Vaccine Development at Baylor College of Medicine, Drs. Maria Elena Bottazzi and Peter Hotez.

During the 2003 SARS outbreak, these researchers created a similar type of vaccine by inserting the genetic information for a portion of the SARS virus spike protein into yeast to produce large amounts of the protein. After isolating the virus spike protein from the yeast and adding an adjuvant, which helps trigger an immune response, the vaccine was ready for use.

The first SARS epidemic was short-lived, and there was little need for Bottazzi and Hotez’s vaccine – until the virus that causes COVID-19, SARS-CoV-2, emerged in 2019. So they dusted off their vaccine and updated the spike protein to match that of SARS-CoV-2, creating the CORBEVAX vaccine.

CORBEVAX received emergency use authorization in India on December 28, 2021.

A large U.S.-based clinical trial found the vaccine to be safe, well tolerated and over 90% effective at preventing symptomatic infections. The vaccine received emergency use authorization in India, and other developing countries are expected to follow.

Interestingly, the group at Baylor was not able to drum up interest or funding in the U.S. for their vaccine. Instead, newer technologies such as mRNA vaccines raced ahead, even though Bottazzi and Hotez’s vaccine design was more advanced, thanks to their previous work during the 2003 SARS and 2012 MERS outbreaks.

A vaccine built for the world

Protein subunit vaccines have an advantage over mRNA vaccines in that they can be readily produced using well-established recombinant DNA technology that is relatively inexpensive and fairly easy to scale up. A similar protein recombinant technology that’s been around for 40 years has been used for the Novavax COVID-19 vaccine, which is available for use in 170 countries, and the recombinant hepatitis B vaccine.

This vaccine can be produced at a much larger scale because appropriate manufacturing facilities are already available. Also key to global access is that CORBEVAX can be stored in a regular refrigerator. Therefore, it is possible to produce millions of doses rapidly and distribute them relatively easily. In comparison, producing mRNA vaccines is more expensive and complicated because they are based on newer technologies, rely on highly skilled workers and often require ultralow temperatures for storage and transport.

Another major difference is that the CORBEVAX vaccine was developed with global vaccine access in mind. The goal was to make a low-cost, easy-to-produce and -transport vaccine using a well-tested and safe method. Key to this, the researchers were not concerned with intellectual property or financial benefit. The vaccine was produced without significant public funding; the US$7 million needed for development was provided by philanthropists.

COBREVAX is currently licensed patent-free to Biological E. Limited (BioE), India’s largest vaccine maker, which plans to manufacture at least 100 million doses per month starting in February 2022. This patent-free arrangement means that other low- and middle-income countries can produce and distribute this cheap, stable and relatively easy-to-scale vaccine locally.

Combined, this means that CORBEVAX is one of the cheapest vaccines currently available. How well it works against the omicron variant is under investigation. However, the CORBEVAX story can be used as a model to address vaccine inequity when it is necessary to vaccinate the world population – against COVID-19 and other diseases on the horizon.

The necessity of vaccine equity

There are many reasons global access to vaccines is inequitable. For example, the governments of wealthy nations purchase vaccines in advance, which limits supply. While developing countries do have vaccine production capacity, low- and middle-income countries in Africa, Asia and Latin America still need to be able to afford the cost of placing orders.

The Indian government has ordered 300 million doses of CORBEVAX, and BioE plans to produce more than 1 billion shots for people in developing countries. For context, the U.S. and other G7 nations have pledged to donate over 1.3 billion doses of COVID vaccines, yet only 591 million doses have been shipped. These numbers mean that if BioE is able to produce 1.3 billion doses of CORBEVAX as planned, this vaccine will reach more people than those vaccinated by what’s been donated and shipped by the wealthiest nations.

As the omicron variant has shown, new variants can spread across the world quickly and are much more likely to develop in unvaccinated people and continue to emerge as long as global vaccination rates remain low. It is unlikely that boosters will end this pandemic. Rather, developing globally accessible vaccines like CORBEVAX represent an important first step in vaccinating the world and ending this pandemic.The Conversation

About the Author:

Maureen Ferran, Associate Professor of Biology, Rochester Institute of Technology

This article is republished from The Conversation under a Creative Commons license. Read the original article.
 

How ‘mechanical trees’ pull carbon dioxide from the air and lock it away – an inventor of direct air capture tech explains

By Klaus Lackner, Arizona State University

Two centuries of burning fossil fuels has put more carbon dioxide, a powerful greenhouse gas, into the atmosphere than nature can remove. As that CO2 builds up, it traps excess heat near Earth’s surface, causing global warming. There is so much CO2 in the atmosphere now that most scenarios show ending emissions alone won’t be enough to stabilize the climate – humanity will also have to remove CO2 from the air.

The U.S. Department of Energy has a new goal to scale up direct air capture, a technology that uses chemical reactions to capture CO2 from air. While federal funding for carbon capture often draws criticism because some people see it as an excuse for fossil fuel use to continue, carbon removal in some form will likely still be necessary, IPCC reports show. Technology to remove carbon mechanically is in development and operating at a very small scale, in part because current methods are prohibitively expensive and energy intensive. But new techniques are being tested this year that could help lower the energy demand and cost.

We asked Arizona State University Professor Klaus Lackner, a pioneer in direct air capture and carbon storage, about the state of the technology and where it’s headed.

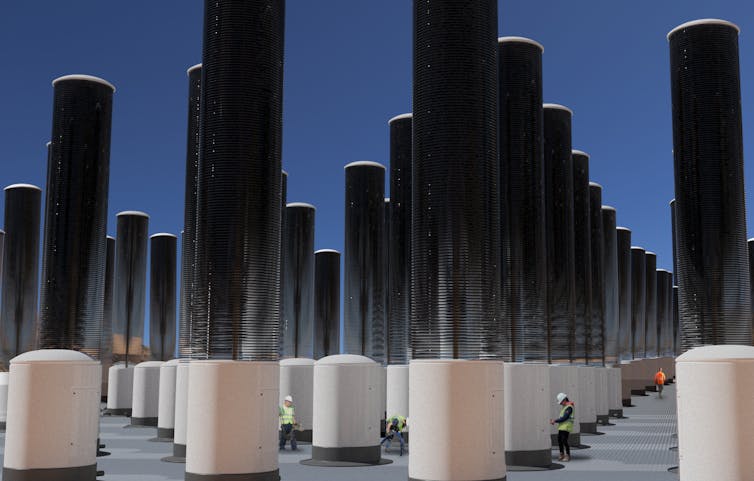
One ‘mechanical tree’ is about 1,000 times faster at removing carbon dioxide from air than a natural tree. The first is to start operating in Arizona in 2022.
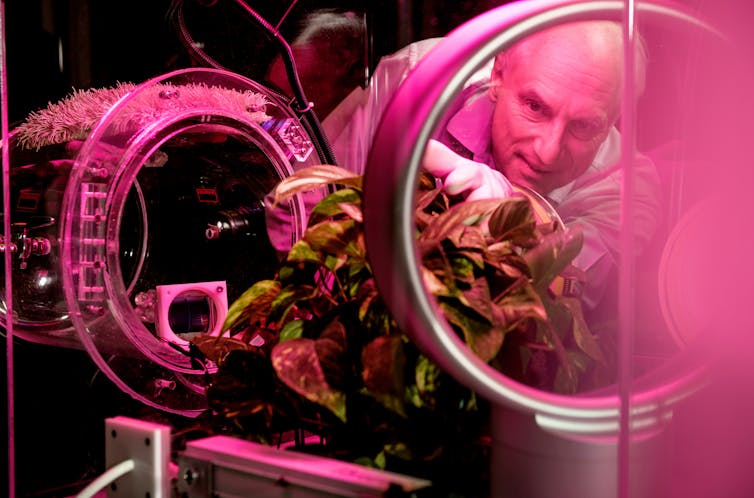
Illustration via Arizona State University

What is direct carbon removal and why is it considered necessary?

When I got interested in carbon management in the early 1990s, what drove me was the observation that carbon piles up in the environment. It takes nature thousands of years to remove that CO2, and we’re on a trajectory toward much higher CO2 concentrations, well beyond anything humans have experienced.

Humanity can’t afford to have increasing amounts of excess carbon floating around in the environment, so we have to get it back out.

Not all emissions are from large sources, like power plants or factories, where we can capture CO2 as it comes out. So we need to deal with the other half of emissions – from cars, planes, taking a hot shower while your gas furnace is putting out CO2. That means pulling CO2 out of the air.

How direct air capture works.

Since CO2 mixes quickly in the air, it doesn’t matter where in the world the CO2 is removed – the removal has the same impact. So we can place direct air capture technology right where we plan to use or store the CO2.

The method of storage is also important. Storing CO2 for just 60 years or 100 years isn’t good enough. If 100 years from now all that carbon is back in the environment, all we did was take care of ourselves, and our grandkids have to figure it out again. In the meantime, the world’s energy consumption is growing at about 2% per year.

One of the complaints about direct air capture, in addition to the cost, is that it’s energy intensive. Can that energy use be reduced?

Two large energy uses in direct air capture are running fans to draw in air and then heating to extract the CO2. There are ways to reduce energy demand for both.

For example, we stumbled into a material that attracts CO2 when it’s dry and releases it when wet. We realized we could expose that material to wind and it would load up with CO2. Then we could make it wet and it would release the CO2 in a way that requires far less energy than other systems. Adding heat created from renewable energy raises the CO2 pressure even higher, so we have a CO2 gas mixed with water vapor from which we can collect pure CO2.

We can save even more energy if the capture is passive – it isn’t necessary to have fans blowing the air around; the air moves on its own.

My lab is creating a method to do this, called mechanical trees. They’re tall vertical columns of discs coated with a chemical resin, about 5 feet in diameter, with the discs about 2 inches apart, like a stack of records. As the air blows through, the surfaces of the discs absorb CO2. After 20 minutes or so, the discs are full, and they sink into a barrel below. We send in water and steam to release the CO2 into a closed environment, and now we have a low-pressure mixture of water vapor and CO2. We can recover most of the heat that went into heating up the box, so the amount of energy needed for heating is quite small.

By using moisture, we can avoid about half the energy consumption and use renewable energy for the rest. This does require water and dry air, so it won’t be ideal everywhere, but there are also other methods.

Can CO2 be safely stored long term, and is there enough of that type of storage?

I started working on the concept of mineral sequestration in the 1990s, leading a group at Los Alamos. The world can actually put CO2 away permanently by taking advantage of the fact that it’s an acid and certain rocks are base. When CO2 reacts with minerals that are rich in calcium, it forms solid carbonates. By mineralizing the CO2 like this, we can store a nearly unlimited amount of carbon permanently.

For example, there’s lots of basalt – volcanic rock – in Iceland that reacts with CO2 and turns it into solid carbonates within a few months. Iceland could sell certificates of carbon sequestration to the rest of the world because it puts CO2 away for the rest of the world.

There are also huge underground reservoirs from oil production in the Permian Basin in Texas. There are large saline aquifers. In the North Sea, a kilometer below the ocean floor, the energy company Equinor has been capturing CO2 from a gas processing plant and storing a million tons of CO2 a year since 1996, avoiding Norway’s tax on CO2 releases. The amount of underground storage where we can do mineral sequestration is far larger than we will ever need for CO2. The question is how much can be converted into proven reserve.

Lackner is shown behind a device with a leafy plant being used for testing.
Klaus Lackner tests direct air capture technologies in his lab.
Arizona State University

We can also use direct air capture to close the carbon loop – meaning CO2 is reused, captured and reused again to avoid producing more. Right now, people use carbon from fossil fuels to extract energy. You can convert CO2 to synthetic fuels – gasoline, diesel or kerosene – that have no carbon in them by mixing the CO2 with green hydrogen created with renewable energy. That fuel can easily ship through existing pipelines and be stored for years, so you can produce heat and electricity in Boston on a winter night using energy that was collected as sunshine in West Texas last summer. A tankful of “synfuel” doesn’t cost much, and it’s more cost-effective than a battery.

The Department of Energy set a new goal to slash the costs of carbon dioxide removal to US$100 per ton and quickly scale it up within a decade. What has to happen to make that a reality?

DOE is scaring me because they make it sound like the technology is already ready. After neglecting the technology for 30 years, we can’t just say there are companies who know how to do it and all we have to do is push it along. We have to assume this is a nascent technology.

Climeworks is the largest company doing direct capture commercially, and it sells CO2 at around $500 to $1,000 per ton. That’s too expensive. On the other hand, at $50 per ton, the world could do it. I think we can get there.

The U.S. consumes about 7 million tons of CO2 a year in merchant CO2 – think fizzy drinks, fire extinguishers, grain silos use it to control grain powder, which is an explosion hazard. The average price is $60-$150. So below $100 you have a market.

What you really need is a regulatory framework that says we demand CO2 is put away, and then the market will move from capturing kilotons of CO2 today to capturing gigatons of CO2.

Where do you see this technology going in 10 years?

I see a world that abandons fossil fuels, probably gradually, but has a mandate to capture and store all the CO2 long term.

Our recommendation is when carbon comes out of the ground, it should be matched with an equal removal. If you produce 1 ton of carbon associated with coal, oil or gas, you need to put 1 ton away. It doesn’t have to be the same ton, but there has to be a certificate of sequestration that assures it has been put away, and it has to last more than 100 years. If all carbon is certified from the moment it comes out of the ground, it’s harder to cheat the system.

A big unknown is how hard industry and society will push to become carbon neutral. It’s encouraging to see companies like Microsoft and Stripe buying carbon credits and certificates to remove CO2 and willing to pay fairly high prices.

New technology can take a decade or two to penetrate, but if the economic pull is there, things can go fast. The first commercial jet was available in 1951. By 1965 they were ubiquitous.The Conversation

About the Author:

Klaus Lackner, Professor of Engineering and Director of the Center for Negative Carbon Emissions, Arizona State University

This article is republished from The Conversation under a Creative Commons license. Read the original article.


Batteries get hyped, but pumped hydro provides the vast majority of long-term energy storage essential for renewable power – here’s how it works

By Andrew Blakers, Australian National University; Bin Lu, Australian National University, and Matthew Stocks, Australian National University

To cut U.S. greenhouse gas emissions in half within a decade, the Biden administration’s goal, the U.S. is going to need a lot more solar and wind power generation, and lots of cheap energy storage.

Wind and solar power vary over the course of a day, so energy storage is essential to provide a continuous flow of electricity. But today’s batteries are typically quite small and store enough energy for only a few hours of electricity. To rely more on wind and solar power, the U.S. will need more overnight and longer-term storage as well.

While battery innovations get a lot of attention, there’s a simple, proven long-term storage technique that’s been used in the U.S. since the 1920s.

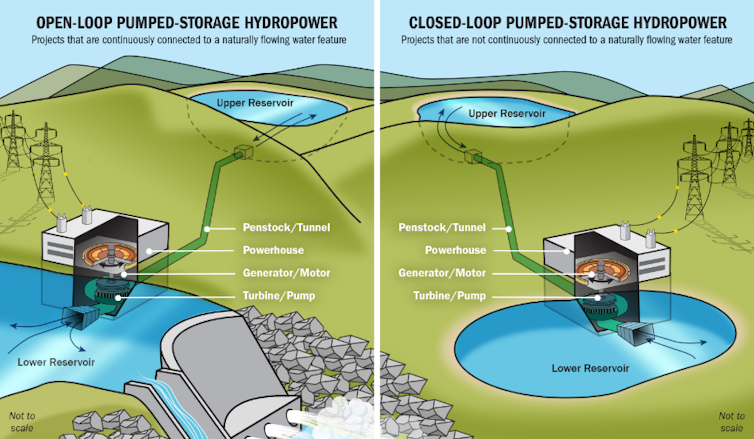
It’s called pumped hydro energy storage. It involves pumping water uphill from one reservoir to another at a higher elevation for storage, then, when power is needed, releasing the water to flow downhill through turbines, generating electricity on its way to the lower reservoir.

Illustration of two open- and closed-loop hydro storage systems. Closed-loop systems use two reservoirs rather than running water.
Two types of pumped-storage hydropower; one doesn’t require a river.
NREL

Pumped hydro storage is often overlooked in the U.S. because of concern about hydropower’s impact on rivers. But what many people don’t realize is that most of the best hydro storage sites aren’t on rivers at all.

We created a world atlas of potential sites for closed-looped pumped hydro – systems that don’t include a river – and found 35,000 paired sites in the U.S. with good potential. While many of these sites, which we located by satellite, are in rugged terrain and may be unsuitable for geological, hydrological, economic, environmental or social reasons, we estimate that only a few hundred sites are needed to support a 100% renewable U.S. electricity system.

Why wind and solar need long-term storage

To function properly, power grids must be able to match the incoming electricity supply to electricity demand in real time or they risk shortages or overloads.

There are several techniques that grid managers can use to keep that balance with variable sources like wind and solar. These include sharing power across large regions via interstate high-voltage transmission lines, managing demand – and using energy storage.

Batteries deployed in homes, power stations and electric vehicles are preferred for energy storage times up to a few hours. They’re adept at managing the rise of solar power midday when the sun is overhead and releasing it when power demand peaks in the evenings.

Pumped hydro, on the other hand, allows for larger and longer storage than batteries, and that is essential in a wind- and solar-dominated electricity system. It is also cheaper for overnight and longer-term storage.

Off-river pumped hydro energy storage

In 2021, the U.S. had 43 operating pumped hydro plants with a total generating capacity of about 22 gigawatts and an energy storage capacity of 553 gigawatt-hours. They make up 93% of utility-scale storage in the country. Globally, pumped hydro’s share of energy storage is even higher – about 99% of energy storage volume.

Pump hydro projects can be controversial, particularly when they involve dams on rivers that flood land to create new reservoirs and can affect ecosystems.

Creating closed-loop systems that use pairs of existing lakes or reservoirs instead of rivers would avoid the need for new dams. A project planned in Bell County, Kentucky, for example, uses an old coal strip mine. Little additional land is needed except for transmission lines.

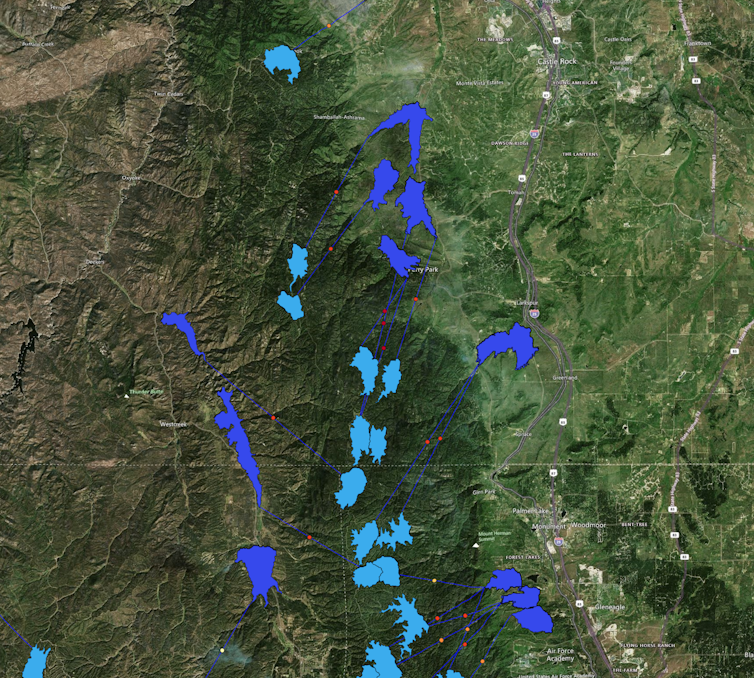
Satellite image showing potential pairings of reservoirs in a mountain area.
Examples from the atlas of off-river reservoirs with the potential to be paired for pumped hydro near Castle Rock, Colorado.
Andrew Blakers, CC BY

An off-river pumped hydro system comprises a pair of reservoirs spaced several miles apart with an altitude difference of 200-800 meters (about 650-2,600 feet) and connected with pipes or tunnels. The reservoirs can be new or use old mining sites or existing lakes or reservoirs.

On sunny or windy days, water is pumped to the upper reservoir. At night, the water flows back down through the turbines to recover the stored energy.

A pair of 250-acre reservoirs with an altitude difference of 600 meters (1,969 feet) and 20-meter depth (65 feet) can store 24 gigawatt-hours of energy, meaning the system could supply 1 gigawatt of power for 24 hours, enough for a city of a million people.

The water can cycle between upper and lower reservoirs for a hundred years or more. Evaporation suppressors – small objects floating on the water to trap humid air – can help reduce water evaporation. In all, the amount of water needed to support a 100% renewable electricity system is about 3 liters per person per day, equivalent to 20 seconds of a morning shower. This is one-tenth of the water evaporated per person per day in the cooling systems of U.S. fossil fuel power stations.

Storage to support 100% renewables

Little pumped storage has been built in the U.S. in recent years because there hasn’t been much need, but that’s changing.

In 2020, about three-quarters of all new power capacity built was either solar photovoltaics or wind power. Their costs have been falling, making them cheaper to build in many areas than fossil fuels.

Australia is installing solar and wind three times faster per capita than the U.S. and is already facing the need for mass storage. It has two systems under construction that are designed to have more energy storage than all the utility batteries in the world put together; another dozen are under serious consideration. None involve new dams on rivers. The annual operating cost is low, and the working fluid is water rather than battery chemicals.

Shifting electricity to renewable energy and then electrifying vehicles and heating can eliminate most human-caused greenhouse gas emissions. The U.S. has vast potential for off-river pumped hydro storage to help this happen, and it will need it as wind and solar power expand.

About the Author:

Andrew Blakers, Professor of Engineering, Australian National University; Bin Lu, Research Fellow, Australian National University, and Matthew Stocks, Research Fellow, ANU College of Engineering and Computer Science, Australian National University

This article is republished from The Conversation under a Creative Commons license. Read the original article.


Gold Has Stalled At Equilibrium

By Ino.com

– Back in April 2020, in my post, I had surmised “Gold Could Fly Over A Helicopter Throwing Money” as the fourth round of Quantitative Easing (QE4) had started a month earlier in March 2020 with an initial pledge to inject $700 billion via asset purchases to support U.S. liquidity. The price of gold was $1,681 at that time.

We all knew that the printing press should push gold prices higher. I tried to calculate the possible target area for the gold price using comparative analysis of the past period, and then I set the range of three goals: $2,000-$2,200-$2,540. Your reaction had come as follows.

The ultra-bullish $2,540 target dominated the ballot. However, the second bet with a more realistic $2,000 target was the closest yet as we saw the all-time high at $2,075 in August 2020. I guess I found the reason for this outcome in the monthly chart below.

Gold Chart

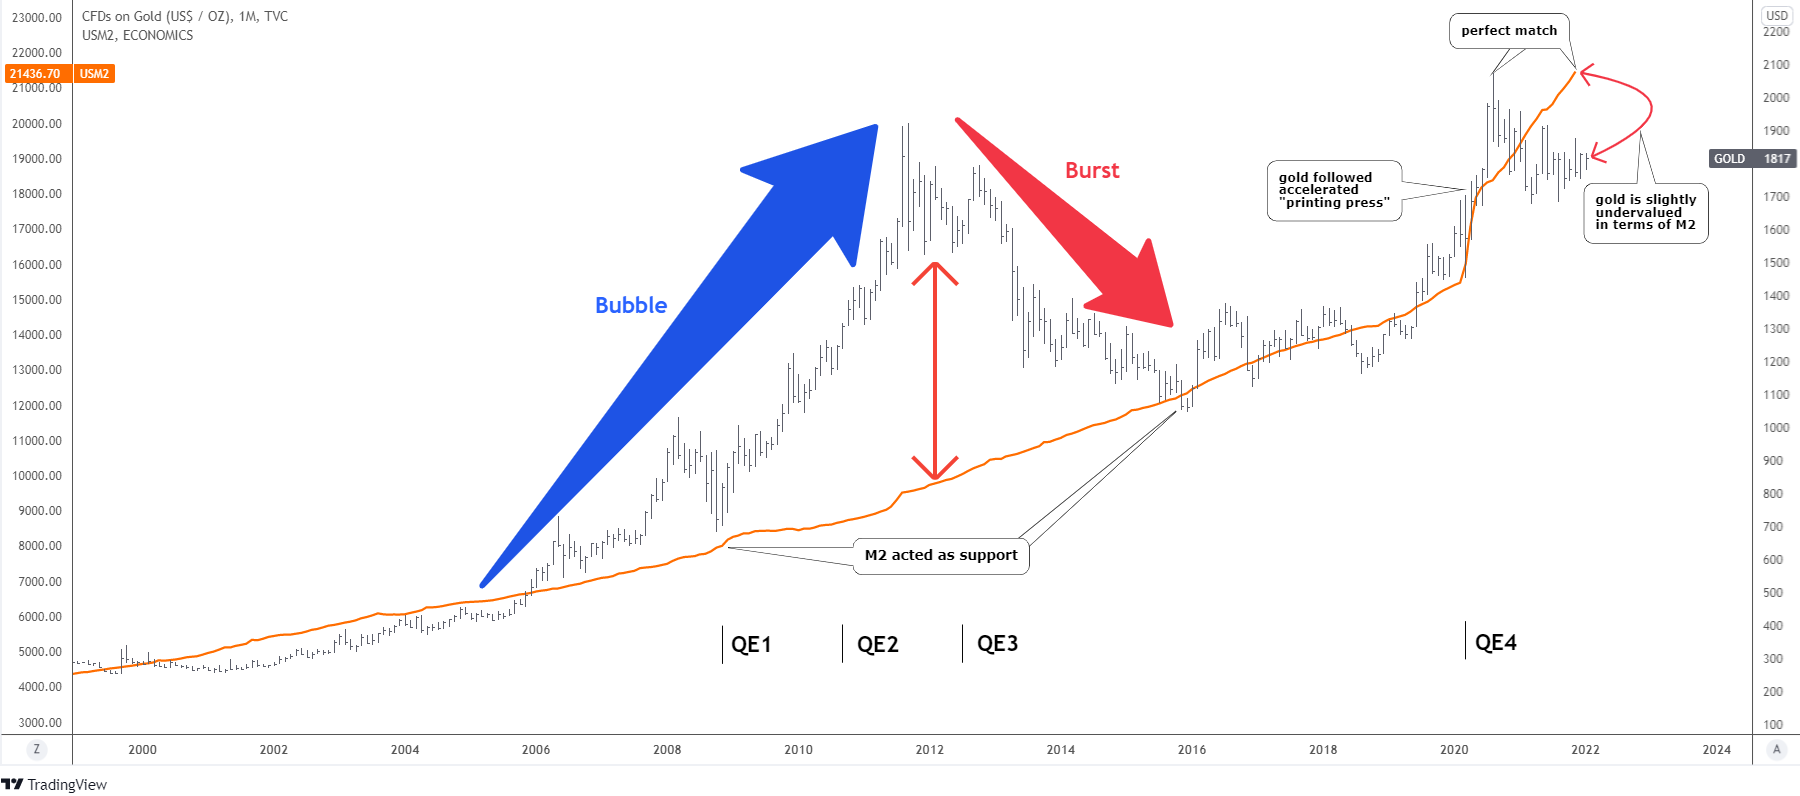
At first glance, one could think I added the orange moving average in the gold chart above. This is the U.S. M2 money supply indicator. What is M2? The M2 is a gauge of the money supply that includes cash, checking deposits, and easily convertible “near money.” It is watched closely as an indicator of money supply and future inflation and a target of central bank monetary policy.

The graph covers the period since the start of the century. One could notice that the initial period was relatively calm as both indicators were just crawling until the gold price crossed over the M2 line in 2006. The flight to safety started with early warning signals from emerging markets; it was ahead of the Great Recession.

“Buy rumors, sell facts” saying played out in 2008 as the gold price collapsed within a deep correction after the all-time high beyond $1,000 was established. The price almost touched the M2 orange line and bounced back to the upside as the U.S. Fed announced the first round of Quantitative Easing (QE1) in November 2008. Two other rounds of stimulus followed, and the latter lasted until October 2014. The M2 line gets steeper consequently.

The market overreacted during that period as many experts called for a doomsday. The gold price was bubbling (blue up arrow) as the gap to the M2 line was growing rapidly. The utter fear pushed the price above $1,900 to establish the all-time high. Then the bubble has burst quickly (red down arrow) as the price dropped close to $1,000. There again, we can see the strong support of the M2 line as gold bounced off it.

After that, the price was back to the normal mode, as we cannot see any enormous deviation from 2008-2011.

The last part is interesting as the price followed the sharp M2 trend precisely, especially during the inception of QE4 in March 2020. Only in the summer of 2020, the strong impulse of the gold price surpassed the money supply line to establish the new all-time high record at $2,075. The M2 line caught up after a while. The magical thing here is that the gold peak corresponds precisely with the current top of M2.

The profit-taking brought the price below the money supply line. As a result, it looks slightly undervalued in terms of M2. However, the fair price is around the record high of $2075.

The ongoing tapering and the prospects of rising interest rates put pressure on the top metal. On the other hand, the money supply could only diminish the angle of the uptrend, as the main trajectory to the upside should stay intact, supporting the gold price. The monetarists rule the financial world now, and they would not allow the money supply to drop; otherwise, it will have dire consequences for the system.

In terms of comparison, we could have three modes: A bubbling gold price, balance, and undervalued gold. We are between the Balance and Light Undervaluation. It could last longer this year. To enter the Bubble mode, another round of QE should start, or the new enormous fear should captivate markets.

Intelligent trades!

Aibek Burabayev
INO.com Contributor, Metals

Disclosure: This contributor has no positions in any stocks mentioned in this article. This article is the opinion of the contributor themselves. The above is a matter of opinion provided for general information purposes only and is not intended as investment advice. This contributor is not receiving compensation (other than from INO.com) for their opinion.

By Ino.com – See our Trader Blog, INO TV Free & Market Analysis Alerts

Source: Gold Has Stalled At Equilibrium


What’s Up With 5G And Airlines?

By Orbex

Yesterday, several US airlines, and others who fly to the US, announced they were suspending flights over 5G. Since then, there have been changes, and many have announced that they will resume the flights.

Initially, this gave investors some serious concerns, given the amount of pressure the logistics system in the US already is under. Even if the issue might be resolved (for now) we should know what happened so we can understand whether it will happen again, and what it could mean for the markets.

Why the sudden problem?

Airlines and cell phones have had an uncomfortable relationship for quite some time. Particularly as you still have to turn off your cell phone when flying on a plane. Commercial airliners are supposedly shielded from any potential interference from cell phones, but it is still a precaution. (This also sponsors some conspiracy theories, given how much airlines charge for internet and telephone service to be available on their planes.)

But, the latest cell communication technology has been in the works for a while. Why did it suddenly become a problem? Well, major US cell networks were scheduled to roll out 5G nation-wide today, including AT&T and Verizon.

The 5G service will initially be concentrated around large population centers, such as cities, where airports are. But, the day before yesterday, the FAA announced that less than half of the US aircraft fleet had been certified to fly in low visibility conditions, using specific instruments.

5G and airplanes

Radio emissions can affect aircrafts’ electronic instruments. Specifically, these can affect altimeters, which airplanes use to measure how high off the ground they are. Clearly, they are an important component of landing.

5G uses a higher frequency than previous data transmission generations. This comes at a cost – that it has a shorter range. However, the increasing input can compensate for that.

Nonetheless, a higher frequency means that more data can be transmitted. Higher frequencies get close to the frequencies of the “C-band” spectrum, which aircraft instrumentation use. In turn, this increases the potential for interference.

Note that helicopters use a slightly lower frequency, and the roll-out of 5G could potentially affect them even more.

They had to have known that, right?

Yes, and it was a behind-the-scenes legal discussion between the FAA, cell providers, and airlines. On Monday, the airlines made the issue public, arguing that the “buffer zones” announced by the FAA around airports were not enough to ensure the safety of the aircraft.

After some tension over the incident, the cell service providers agreed to turn off 5G towers in a wider range around airports, as requested by airlines. However, the FAA will review this guidance in 6 months’ time.

Why hasn’t this been a problem in other countries?

The EU, for example, allocated bandwidths for 5G that were lower frequency and less strong than in the US. This might compromise the quality of the service. Nevertheless, this kept the emissions far enough away from the C-band to satisfy airlines.

5G service is essential to self-driving cars, and cell phone users aren’t going to be happy to lose service near an airport. Eventually, coverage will likely be available within the “buffer” zones, as per the airlines’ request. The hope is that by then the FAA will have time to certify the rest of the fleet, particularly older Boeing models.

In theory, it shouldn’t be a problem again. But we won’t know for sure until the 6-month review process is over.


Orbex-LogoArticle by Orbex

Orbex is a fully licensed broker that was established in 2011. Founded with a mission to serve its traders responsibly and provides traders with access to the world’s largest and most liquid financial markets. www.orbex.com

Fibonacci Retracements Analysis 19.01.2022 (GBPUSD, EURJPY)

Article By RoboForex.com

GBPUSD, “Great Britain Pound vs US Dollar”

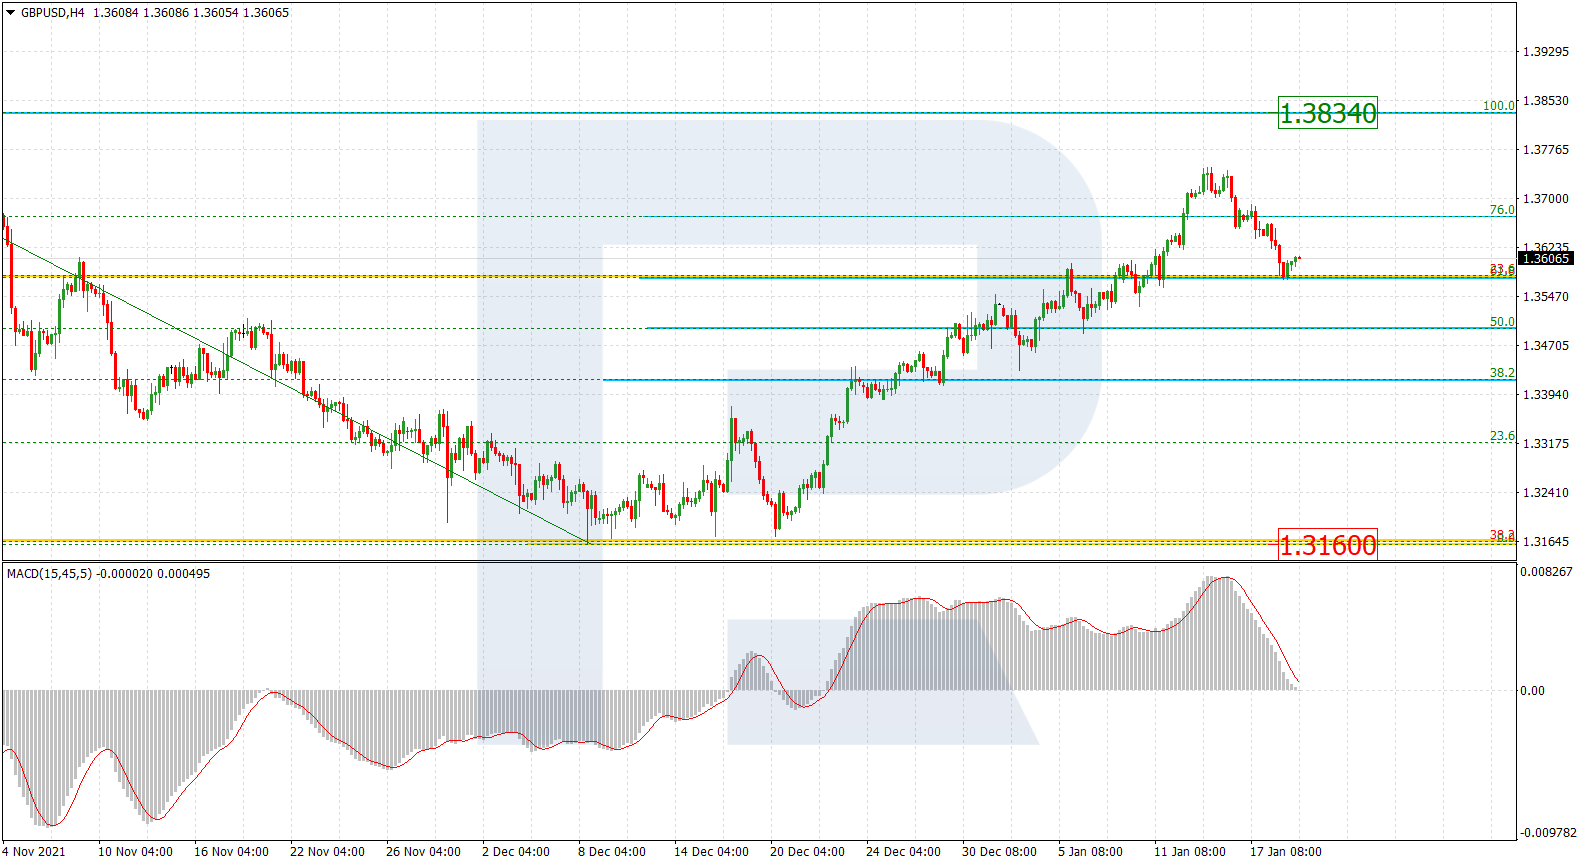
As we can see in the H4 chart, after an attempt to test and break 76.0% fibo, GBPUSD has started a new decline, which may transform into a proper descending wave towards the low at 1.3160. The key resistance and the next upside target are the high at 1.3834.

GBPUSD_H4
Risk Warning: the result of previous trading operations do not guarantee the same results in the future

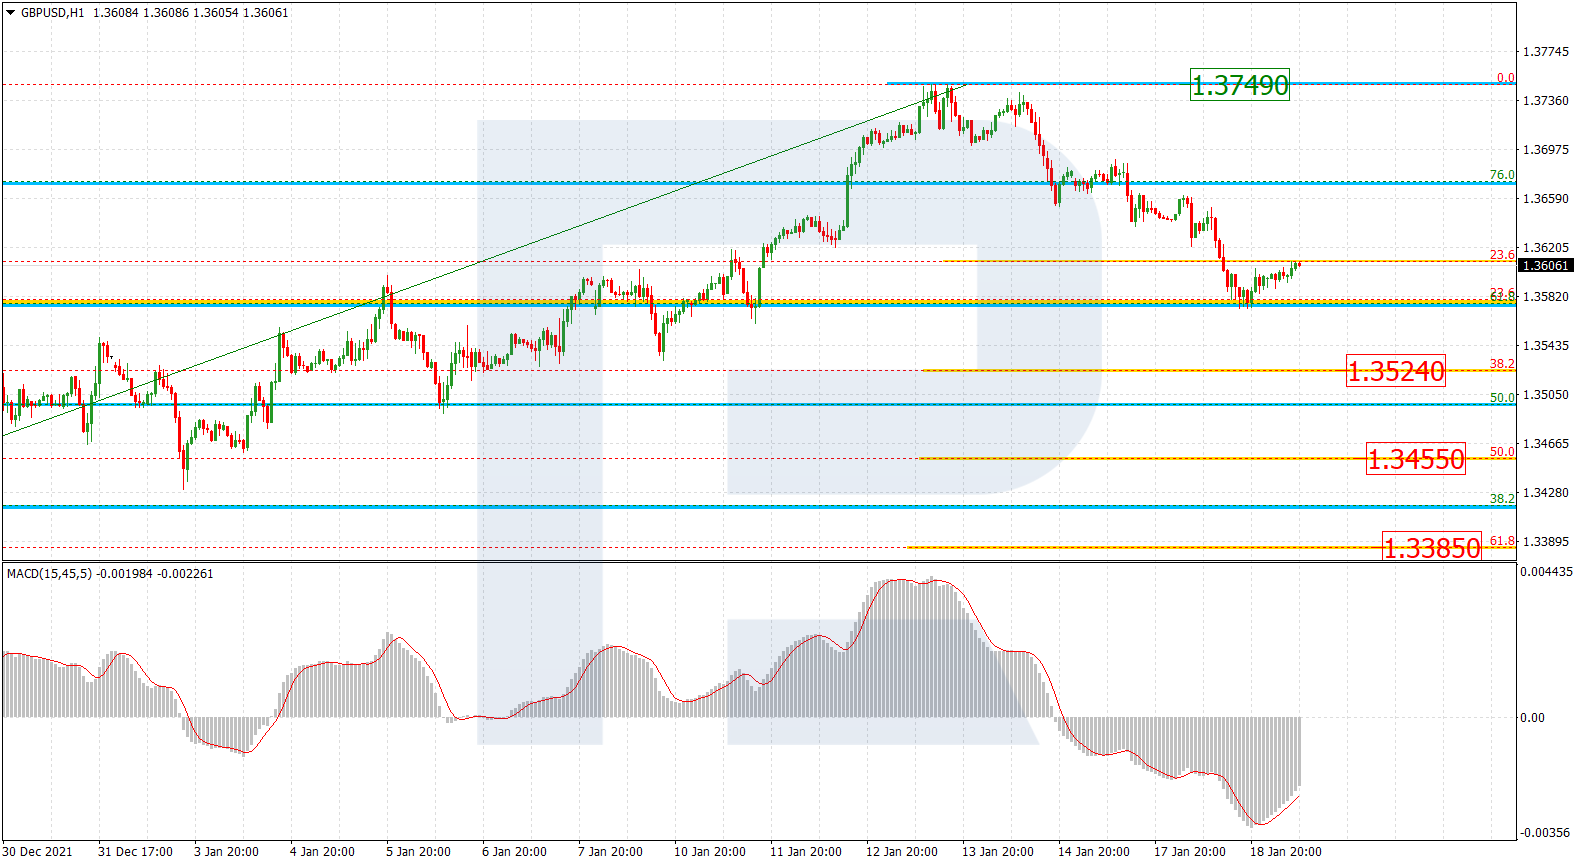
The H1 chart shows a more detailed structure of the current correctional downtrend. By now, the descending wave has reached 23.6% fibo and may later continue towards 38.2%, 50.0%, and 61.8% fibo at 1.3524, 1.3455, and 1.3385 respectively. The local resistance is the high at 1.3749.

GBPUSD_H1
Risk Warning: the result of previous trading operations do not guarantee the same results in the future

EURJPY, “Euro vs. Japanese Yen”

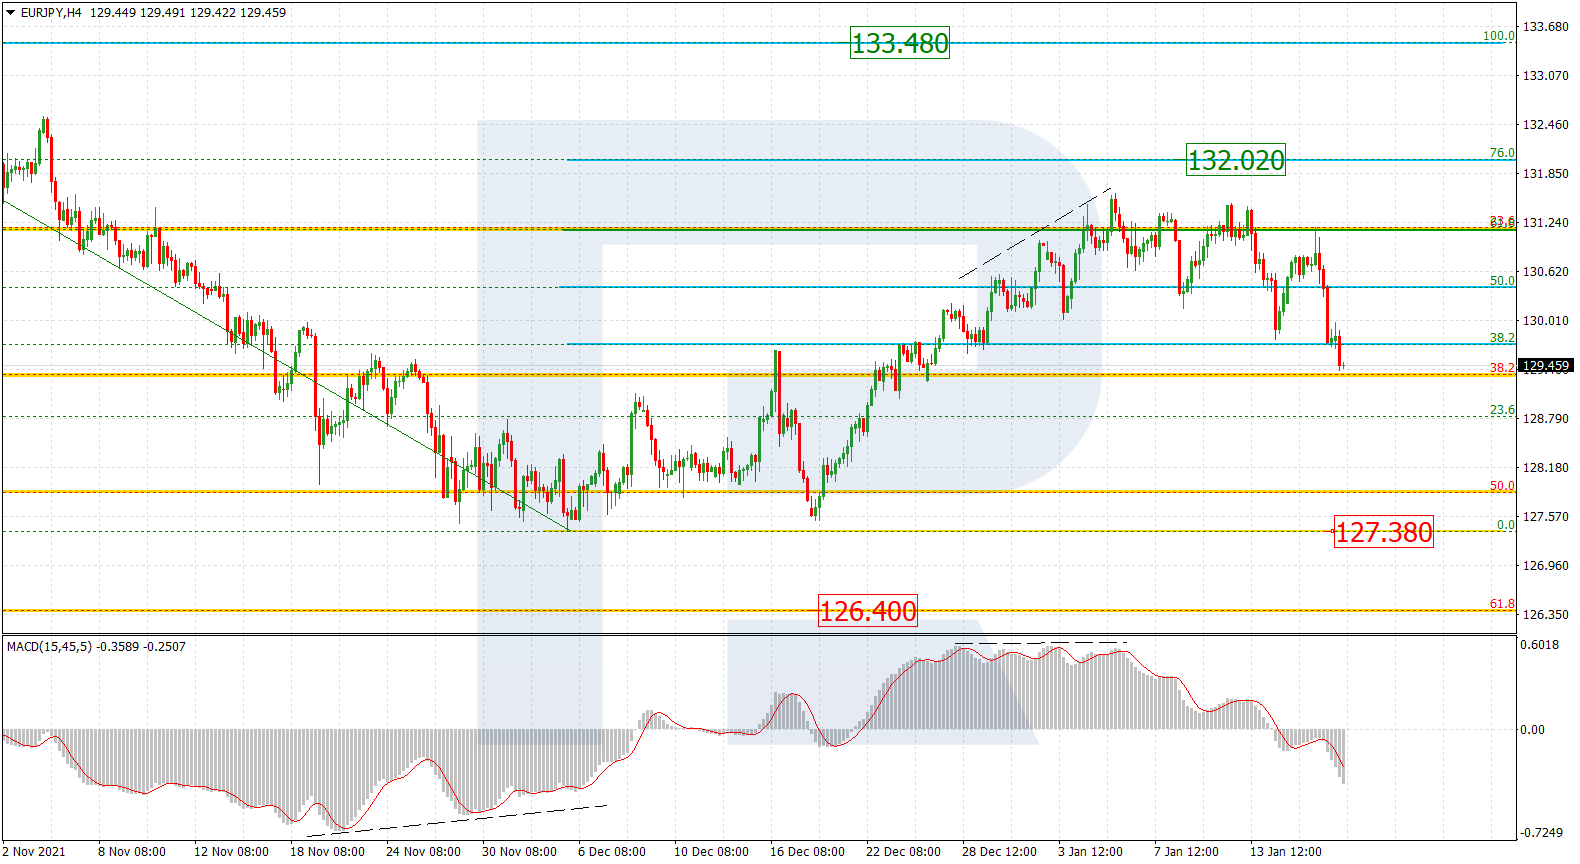
As we can see in the H4 chart, EURJPY is moving upwards after divergence on MACD. In this case, the asset may fall to break the low at 127.38 and then continue trading downwards to reach the long-term 61.8% fibo at 126.40.

EURJPY_H4
Risk Warning: the result of previous trading operations do not guarantee the same results in the future

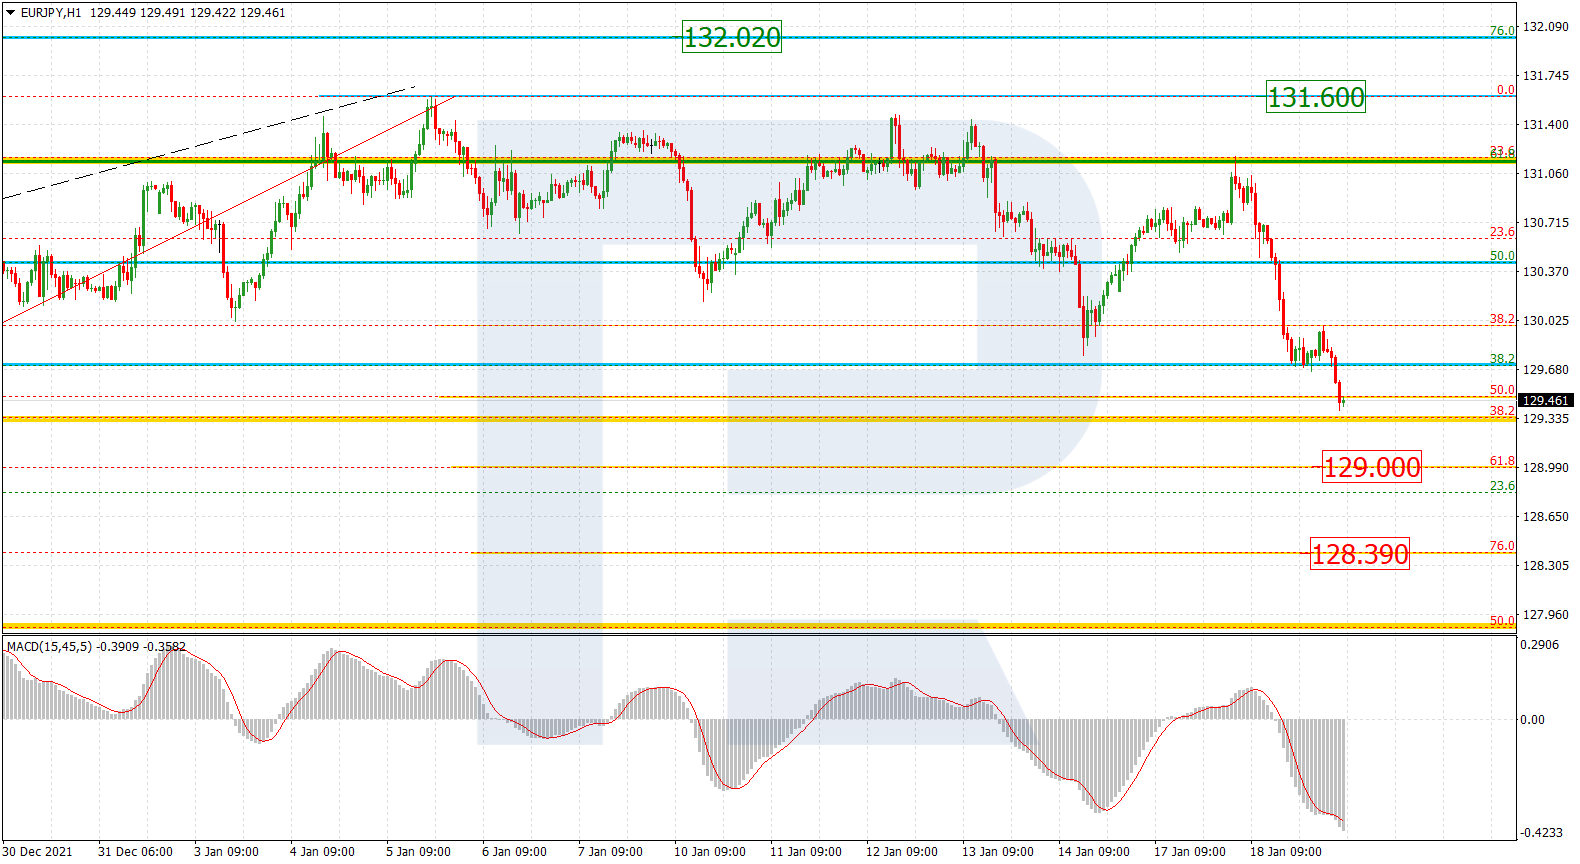
The H1 chart shows that the pair is falling; it has already reached 50.0% fibo and may later continue towards 61.8% and 76.0% fibo at 129.00 and 128.39 respectively. The key resistance is the local high at 131.60.

EURJPY_H1

Article By RoboForex.com

Attention!
Forecasts presented in this section only reflect the author’s private opinion and should not be considered as guidance for trading. RoboForex LP bears no responsibility for trading results based on trading recommendations described in these analytical reviews.

GBPJPY Impulse Or Ending Diagonal?

By Orbex

GBPJPY

The GBPJPY currency pair is most likely moving within the cycle impulse, with wave III under development.

We can assume that the correction wave ④ of the primary degree ended at the end of December. This correction took the form of an intermediate triple zigzag.

Since then, we have observed a rise in the price in the primary wave ⑤. In turn, this takes the form of an intermediate 5-wave impulse (1)-(2)-(3)-(4)-(5).

The entire primary wave ⑤ can complete its pattern near 163.52. At that level, it will be at 61.8% of wave ③.

GBPJPY

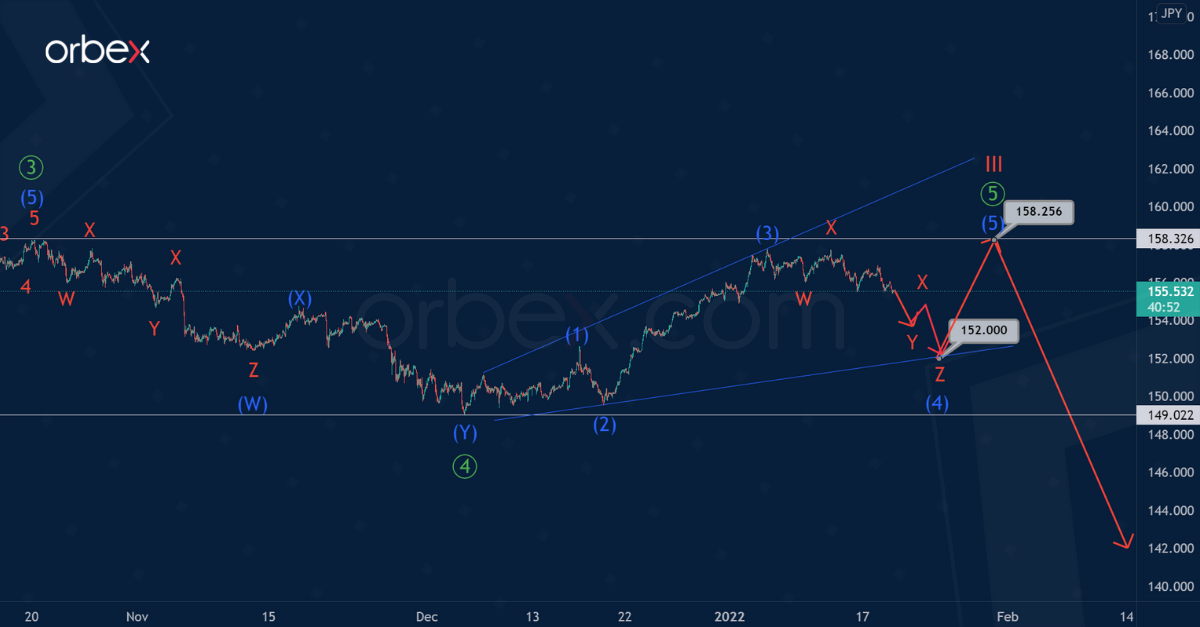
Alternatively, the primary wave ⑤ is not an impulse, but an ending diagonal in which an intermediate correction wave (4) is under construction.

Perhaps wave (4) will be a triple W-X-Y-X-Z zigzag of the minor degree, as shown in the chart. In the near future, prices could lower in the minor sub-waves Y-X-Z to the level of 152.00.

After reaching the specified price level, the price is likely to increase within the final intermediate wave (5) to the previous maximum of 158.25.


Orbex-LogoArticle by Orbex

Orbex is a fully licensed broker that was established in 2011. Founded with a mission to serve its traders responsibly and provides traders with access to the world’s largest and most liquid financial markets. www.orbex.com

Murrey Math Lines 19.01.2022 (USDJPY, USDCAD)

Article By RoboForex.com

USDJPY, “US Dollar vs. Japanese Yen”

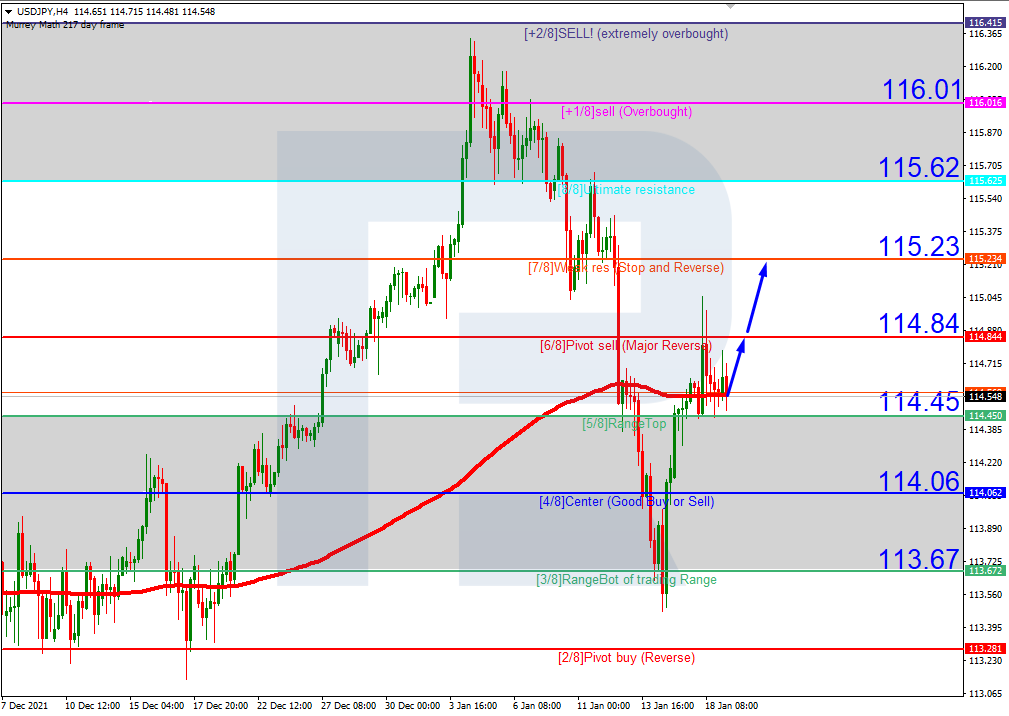
As we can see in the H4 chart, after breaking the 200-day Moving Average, USDJPY is trading above it, thus indicating a possible ascending tendency. In this case, the price is expected to test 6/8, break it, and then continue growing to reach the resistance at 7/8. However, this scenario may no longer be valid if the price breaks 5/8 to the downside. After that, the instrument may reverse and fall towards the support at 3/8.

USDJPYH4
Risk Warning: the result of previous trading operations do not guarantee the same results in the future

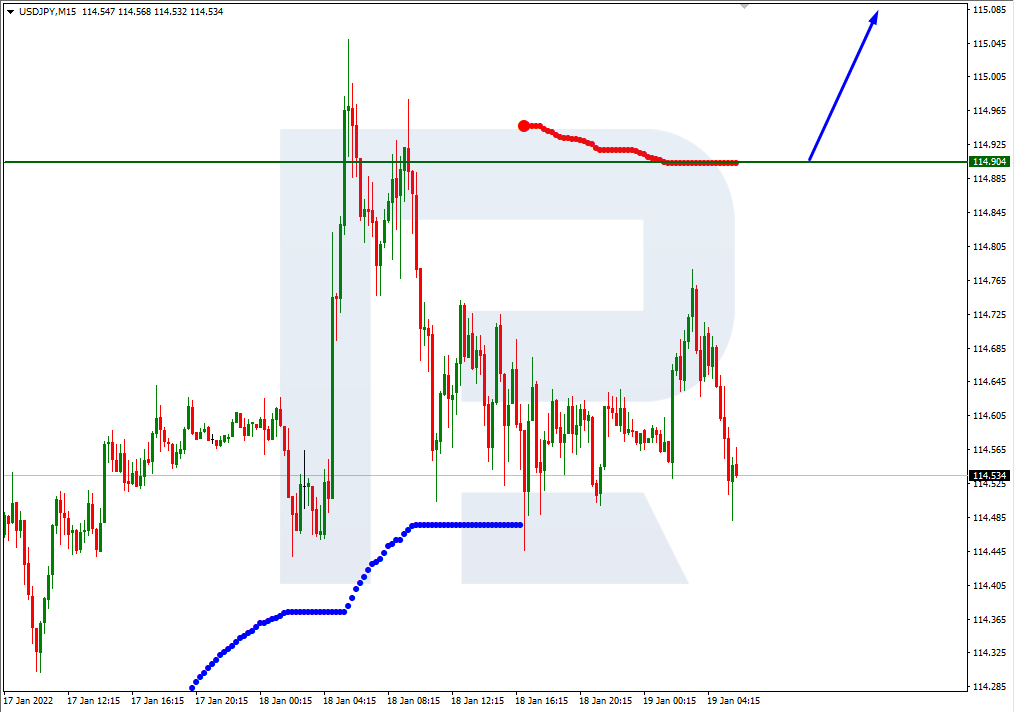
In the M15 chart, the pair may break the upside line of the VoltyChannel indicator and, as a result, continue growing.

USDJPY_M15
Risk Warning: the result of previous trading operations do not guarantee the same results in the future

USDCAD, “US Dollar vs Canadian Dollar”

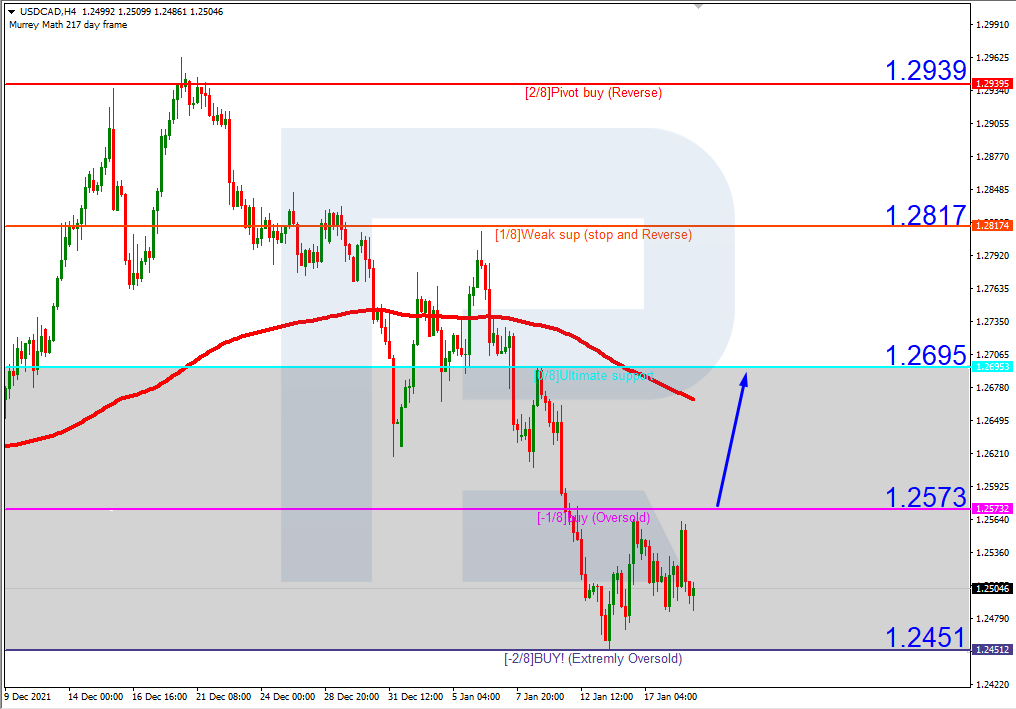
As we can see in the H4 chart, USDCAD is trading within the “oversold area”. In this case, the price is expected to test -1/8, break it, and continue growing towards the resistance at 0/8. Still, this scenario may no longer be valid if the price breaks the support at -2/8 to the downside. After that, the lines in the chart will be redrawn, thus helping us to define new downside targets.

USDCAD_H4
Risk Warning: the result of previous trading operations do not guarantee the same results in the future

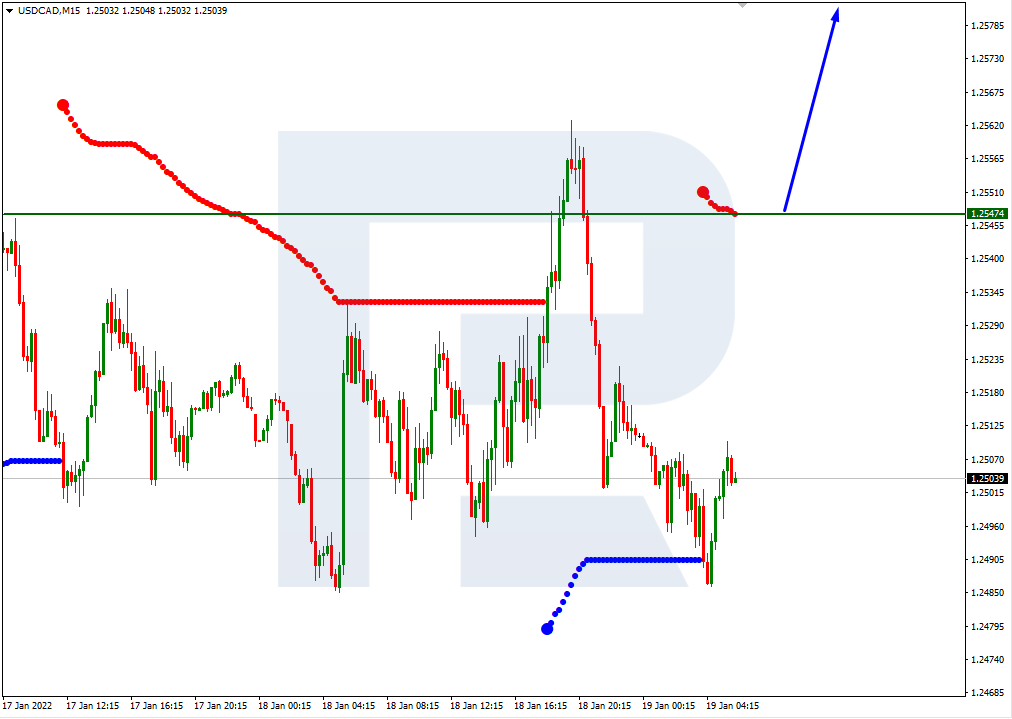
In the M15 chart, the pair may break the upside line of the VoltyChannel indicator and, as a result, continue trading downwards to reach 0/8 in the H4 chart.

USDCAD_M15

Article By RoboForex.com

Attention!
Forecasts presented in this section only reflect the author’s private opinion and should not be considered as guidance for trading. RoboForex LP bears no responsibility for trading results based on trading recommendations described in these analytical reviews.

Intraday Market Analysis – GBP Seeks Support

By Orbex

GBPUSD falls into correction

GBPUSD

The sterling fell back after a slowdown in Britain’s wage growth in November. Sentiment favors the pound after it rallied above the daily resistance at 1.3700.

However, an overbought RSI has cut back buyers’ appetite. A break below 1.3630 has prompted some traders to take profit, driving down the price.

As the RSI dips into the oversold zone, 1.3570 is the next support. A bearish breakout would send the pair to 1.3480 which sits on the 30-day moving average. 1.3660 is the immediate resistance when a rebound takes shape.

USDJPY struggles to bounce

USDJPY

The yen softened after the Bank of Japan signaled no shift in its ultra-loose monetary policy. The US dollar bounced off the critical floor at 113.50 from the daily chart.

A bullish RSI divergence revealed a deceleration in the downward impetus. The indicator’s oversold situation also attracted a number of bargain hunters.

A break above 114.70 suggests a strong interest in keeping the correction in check. 115.50 from the latest sell-off is a major hurdle and its breach could extend the rally to the recent peak at 116.30.

SPX 500 to test daily support

SPX 500

The S&P 500 extended losses over rising rate worries. The fall below 4640 invalidates the latest rebound and indicates that sentiment is still downbeat.

Below the psychological level of 4600, 4540 is a key support near last December’s lows on the daily chart. A bearish breakout would trigger a deeper correction towards 4400, the origin of the October rally.

An oversold RSI may cause a limited rebound. Nonetheless, the bulls need to clear offers around 4675 and then 4745 to gain momentum.


Orbex-LogoArticle by Orbex

Orbex is a fully licensed broker that was established in 2011. Founded with a mission to serve its traders responsibly and provides traders with access to the world’s largest and most liquid financial markets. www.orbex.com

The Analytical Overview of the Main Currency Pairs on 2022.01.19

by JustForex

The EUR/USD currency pair

Technical indicators of the currency pair:
  • Prev Open: 1.1406
  • Prev Close: 1.1327
  • % chg. over the last day: -0.70%

According to data from the ZEW Institute, economic sentiment in Germany and the Eurozone has improved significantly over the past month. At the same time, inflation expectations have declined. More than half of analysts expect inflation to decline in the region over the next six months. With a high probability, the ECB will not change its monetary policy before the end of the year, so the euro has no fundamental support, unlike the dollar index, where the US Federal Reserve will hike rates soon.

Trading recommendations
  • Support levels: 1.1320, 1.1305, 1.1288
  • Resistance levels: 1.1356, 1.1384, 1.1405

From a technical point of view, the EUR/USD on the hour time frame has changed to bearish. The price broke through the priority change level and consolidated lower. The MACD indicator became negative, with no signs of a reversal. Under such market conditions, it is better to consider sell trades from the resistance levels near the moving average, as the price has deviated strongly from the average values. Buy trades can be considered on the lower time frames from the support level of 1.1320 or 1.1305, but only with additional confirmation in the form of a buyers’ initiative.

Alternative scenario: if the price breaks out through the 1.1405 resistance level and fixes above, the mid-term uptrend will be renewed.

EUR/USD
News feed for 2022.01.19:
  • – German Consumer Price Index (m/m) at 09:00 (GMT+2);
  • – US Building Permits (m/m) at 15:30 (GMT+2).

The GBP/USD currency pair

Technical indicators of the currency pair:
  • Prev Open: 1.3642
  • Prev Close: 1.3597
  • % chg. over the last day: -0.33%

Labor market statistics showed that the UK was facing wage cuts. At the same time, the unemployment rate fell from 4.2% to 4.1%. Inflation data will be released today. Analysts expect inflation in December to rise to its highest level in a decade. The Bank of England has warned that inflation could peak close to 6% in April, up from the current level of 5.1%. Rising inflation will further increase the probability of an interest rate hike at the next Bank of England meeting.

Trading recommendations
  • Support levels: 1.3581, 1.3551, 1.3479
  • Resistance levels: 1.3620, 1.3661, 1.3689, 1.3715

On the hourly time frame, the GBP/USD trend has changed to bearish. The price broke through the priority change level and consolidated lower. The MACD indicator became negative, with no signs of a reversal. Under such market conditions, sell deals are best to look at from the resistance level of 1.3620 or 1.3661. Buy trades should be considered from the support level of 1.3580, but only with additional confirmation in the form of buyers’ initiative.

Alternative scenario: if the price breaks out through the 1.3661 resistance level and consolidates above, the bearish scenario will be broken.

GBP/USD
News feed for 2022.01.19:
  • – UK Consumer Price Index (m/m) at 09:00 (GMT+2);
  • – UK BoE Gov Bailey Speaks at 16:15 (GMT+2).

The USD/JPY currency pair

Technical indicators of the currency pair:
  • Prev Open: 114.59
  • Prev Close: 114.58
  • % chg. over the last day: -0.01%

Prime Minister Kishida intends to declare a state of emergency in certain regions of Japan from January 21 to February 13. This is likely to lead to a slowdown in economic activity. But the Japanese Yen is strengthening now due to investors returning to safe-haven currencies as traders start to fear another hawkish surprise from the Federal Reserve, which is expected to meet next week.

Trading recommendations
  • Support levels: 114.25, 113.99, 113.72
  • Resistance levels: 114.63, 115.04, 115.35, 115.64

The global trend on the USD/JPY currency pair is bearish. The sellers managed to protect the priority change level. Buy deals are best to look at the lower time frames from the nearest support levels. Sell trades can be considered from the resistance level of 114.63, but only with confirmation in the form of a sellers’ initiative, as the monetary policy of the Bank of Japan is now aimed at decreasing the Japanese yen.

Alternative scenario: if the price fixes above 115.04, the uptrend will likely resume.

USD/JPY
There is no news feed for today.

The USD/CAD currency pair

Technical indicators of the currency pair:
  • Prev Open: 1.2514
  • Prev Close: 1.2511
  • % chg. over the last day: -0.02%

The Canadian dollar is a commodity currency, so it depends not only on the monetary policy of the Bank of Canada but also on the oil prices and the dollar index. The price of Brent oil reached $88 per barrel for the first time since October 2014. Analysts point out that the demand for oil in the last three months was higher than previously expected. The fundamental situation is now in favor of the growth of oil prices. Therefore, with the Bank of Canada also set to hike rates, the Canadian dollar will be strong.

Trading recommendations
  • Support levels: 1.2490, 1.2427
  • Resistance levels: 1.2558, 1.2628, 1.2678, 1.2715

From a technical point of view, the USD/CAD currency pair is bearish. The price is now trading in a corridor with a range of 1.2490-1.2558. The MACD indicator has become inactive. Under such market conditions, it is better to look for buy deals from the level of 1.2490 on the lower time frames. It is better to consider sell deals from the upper border of the range of 1.2558.

Alternative scenario: if the price breaks through the 1.2575 resistance level and fixes above, the downtrend is likely to be broken.

USD/CAD
News feed for 2022.01.19:
  • – Canada Consumer Price Index (m/m) at 15:30 (GMT+2).

by JustForex


This article reflects a personal opinion and should not be interpreted as an investment advice, and/or offer, and/or a persistent request for carrying out financial transactions, and/or a guarantee, and/or a forecast of future events.