US stagflation: The global risk of 2022

By Dan Steinbock

– Until recently, the US Fed ignored America’s soaring inflation. Due to its belated response, the consequent risks will penalize the ailing global recovery.

In November, U.S. inflation surged to near 40-year high, at 6.8%. Only days later, the Fed indicated it would end its pandemic-era bond purchases in March, thus paving the way for interest rate hikes by the end of 2022.

It had been one of the worst inflation calls in the Fed’s history. One that will contribute to new uncertainty in the United States. Nor will it spare the rest of the world, including the world’s most dynamic region – Asia.

The pandemic effects

For months, I, along with some observers, have been warning that what the US Federal Reserve have called “transitionary” inflation will prove not-so-transitionary and that it signals stagflation.

Through much of 2021, Jerome Powell, the chair of the Fed and his colleagues, characterized rising prices as transitionary. The rising prices would not leave “a permanent mark in the form of higher inflation.” But that was wishful thinking.

Since the early days of the pandemic, the Fed has made two mistakes. First, it began to cut rates belatedly only in March 2020. It ignored the WHO warnings and the drastic economic impact of the disruptive spread of Covid-19 in America. The mistake was amplified by the Trump administration that sought to protect US equity market, at the expense of American people.

The second mistake ensued after mid-year 2021, when inflation began to climb rapidly. Instead of a timely response, the Fed signaled: This is not real inflation. It will go away. In reality, inflation soared (Figure 1).

Figure 1 10-year perspective: The Pandemic Effect
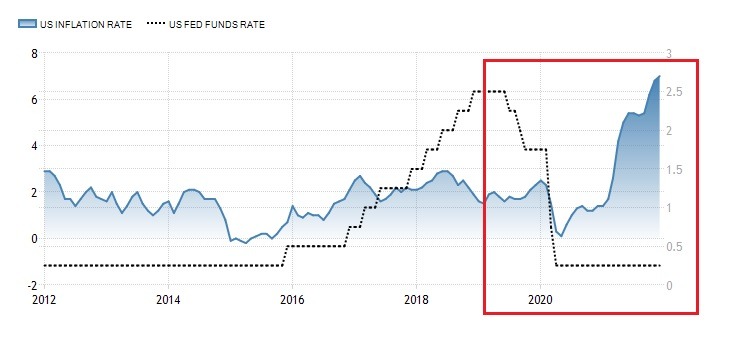
inflation 10-year perspective: The Pandemic Effect

By November 30, Powell ditched the term ‘transitionary.’ But the Fed was months late.

Fed’s double-whammy surprise 

The galloping inflation only worsened in December when inflation rose 7% from a year ago. Inflation was climbing at its fastest pace in almost four decades. Worse, it marked the fastest increase since June 1982, when inflation amounted to 7.1%.

President Biden’s approval rating had been falling ever since the rise of the inflation. Now widespread price increases fueled consumer concerns about the economy. As the net effect, Biden’s rating was tumbling.

In the US, inflation rate and funds rate had moved fairly synchronously since the 1970s, when the Great Inflation had been stirred by two energy crises and price increases unmatched by productivity gains. As it morphed into persistent stagflation, then-Fed chief Paul Volcker resorted to record-high interest rates (20%+) causing a major recession in America, a lost decade in Latin America and extraordinary economic pain elsewhere.

Through fall 2021, the new stagflation – the combination of low interest rates and high inflation – has been untenable (Figure 2).

Figure 2 50-year perspective: Two Untenable Trajectories
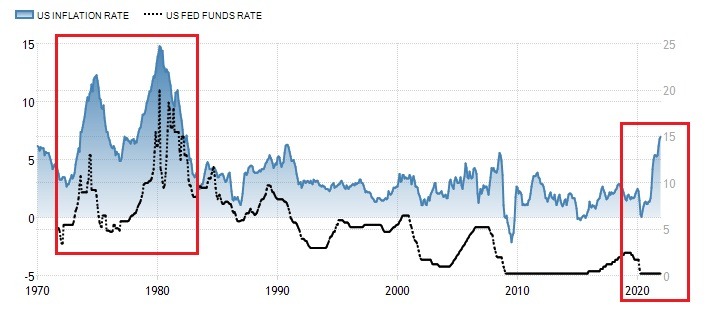
inflation rate US 50-year perspective

The belated response will make things worse. The market had digested the Fed’s signaling it would hike short-term rates, starting perhaps as early as March. However, the bond market was hit on January 5, with the release of the minutes of the Fed’s Committee (FOMC) meeting in December 2021.

The unexpected surprise was that the Fed was also considering quantitative tightening; that is, shrinking its balance sheet. In addition to hiking the rates, it was planning quantitative tightening (as opposed to the past quantitative easing). That’s the double-whammy strategy that caught the market by surprise.

The challenges

Since the Fed awoke too late, it will have to hike rates faster and tighten already uncertain monetary conditions more than it did in the mid-2010s, in the aftermath of the 2008 crisis. And that will penalize the nascent recovery in America and contribute to still new delays in global recovery.

Second, a sustained rejuvenation of global economic prospects is predicated on growth, trade and investment. The Fed’s disruptive measures will weaken growth prospects, while the misguided US trade wars will further derail those prospects.

Furthermore, rate hikes and protectionism will add to global uncertainty, which will penalize foreign direct investment, while boosting “hot money”– speculative capital flows – that will add to market volatility.

Fourth, the combined effect could foster the return of the Republicans in the 2022 mid-term election and Trump’s comeback in 2024; neither of which is good news in view of the hoped-for global recovery.

Fifth, after the pandemic and the associated depression, U.S. sovereign debt is 131% of its GDP; not far from that of Italy amid the onset of the European debt crisis in 2010. The difference is that Italy, unlike the US, does not account for a fifth of the world economy, just as the old lira is not the major global reserve currency. US monetary policy has global repercussions.

Sixth, like Trump, the Biden administration calculated that debt-taking is fine since rates will remain low and interest payments manageable. They calculated wrong. As a result, Washington will continue to take more debt to (presumably) fight debt.

Finally, due to the impending rate hikes and quantitative tightening, the Fed impact will be felt throughout Asia where central banks are likely to signal more hawkish stances in the coming weeks.

While China may prove more resistant to the Fed impact, most of Asia won’t. While analysts expect China, Indonesia and South Korea bonds to outperform, Thailand and Malaysia bonds are likely to prove less successful. Recently, the Philippine peso plunged beyond 51 per dollar for the first time since April 2020 as the country’s trade deficit is expect to widen.

The Fed impact will cause further weakening in Southeast Asia in 2022.

Two black swans

There are two to black swans in play as well. The first may cushion the Fed impact worldwide; the second would magnify it.

Until recently, the optimists – foolishly – though that the Delta variant would be the last breadth of the global pandemic. Omicron proved them wrong. It will contribute to unanticipated challenges in the labor markets and new supply disruptions worldwide – and thus further sustain inflation.

Furthermore, due to the pandemic mismanagement and huge infection surges in the West, the pandemic effects may linger for months, perhaps even longer, thanks to inadequate global cooperation, politicized responses and vaccine inequality,

The other black swan is the Fed itself. The current stagflation has been fueled by the Fed’s policies and the Trump-Biden trade war.

With ultra-low rates and rounds of QE, the Fed took a risky path. That’s the message of Thomas Hoenig, former member of the Fed’s top policy committee (FOMC). This path, Hoenig says in the just-released The Lords of Easy Money will deepen America’s income inequality, stoke dangerous asset bubbles and enrich the biggest banks over everyone else. And if the Fed fails to exit its own money-printing quagmire, it could destabilize the financial system.

Unsurprisingly perhaps, when economic policies are misguided, threats of war and rearmament drives – from Ukraine to South China Sea – conveniently deflect and distract from the real economic challenges.

About the Author:

Dr. Dan Steinbock is an internationally recognized strategist of the multipolar world and the founder of Difference Group. He has served at India, China and America Institute (US), Shanghai Institutes for International Studies (China) and the EU Center (Singapore). For more, see https://www.differencegroup.net/  

 

Intraday Market Analysis – USD Pulls Back Again

By Orbex

USDCAD grinds lower

USDCAD

The Canadian dollar finds support from hotter-than-expected inflation. The US counterpart remained under pressure after it failed to hold onto 1.2500.

The RSI’s repeatedly oversold situation has attracted some buying interest. But timid rebounds have rather been opportunities for trend-followers to sell into strength.

1.2570 is a key resistance to lift if the bulls look for another chance. On the downside, a drop below 1.2450 would trigger a new round of sell-off towards the daily support at 1.2390.

EURGBP slips to 12-month lows

EURGBP

The sterling edged higher after Britain’s December CPI exceeded expectations.

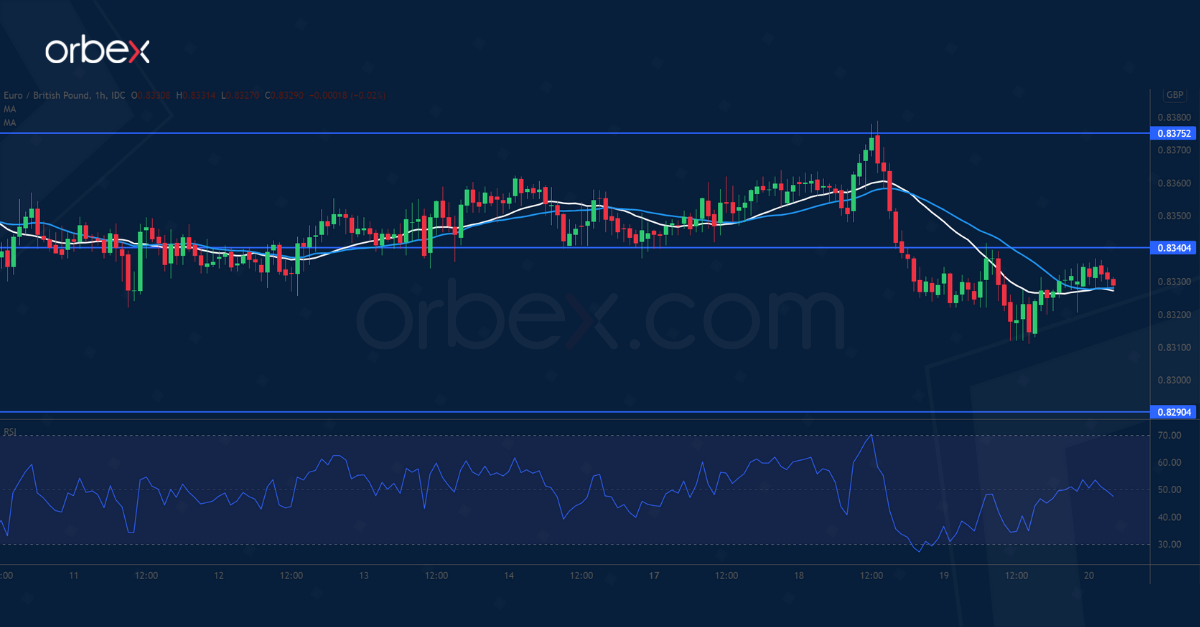
The euro has struggled to lift offers around 0.8375 after a two-week-long consolidation. The subsequent break below 0.8340 has forced buyers to bail out, exacerbating the bearish mood. This former support has turned into a fresh resistance.

A bearish MA cross indicates an acceleration to the downside. The pair is now heading towards February 2020’s lows near 0.8290. An oversold RSI may cause a limited rebound.

USOIL seeks support

USOIL

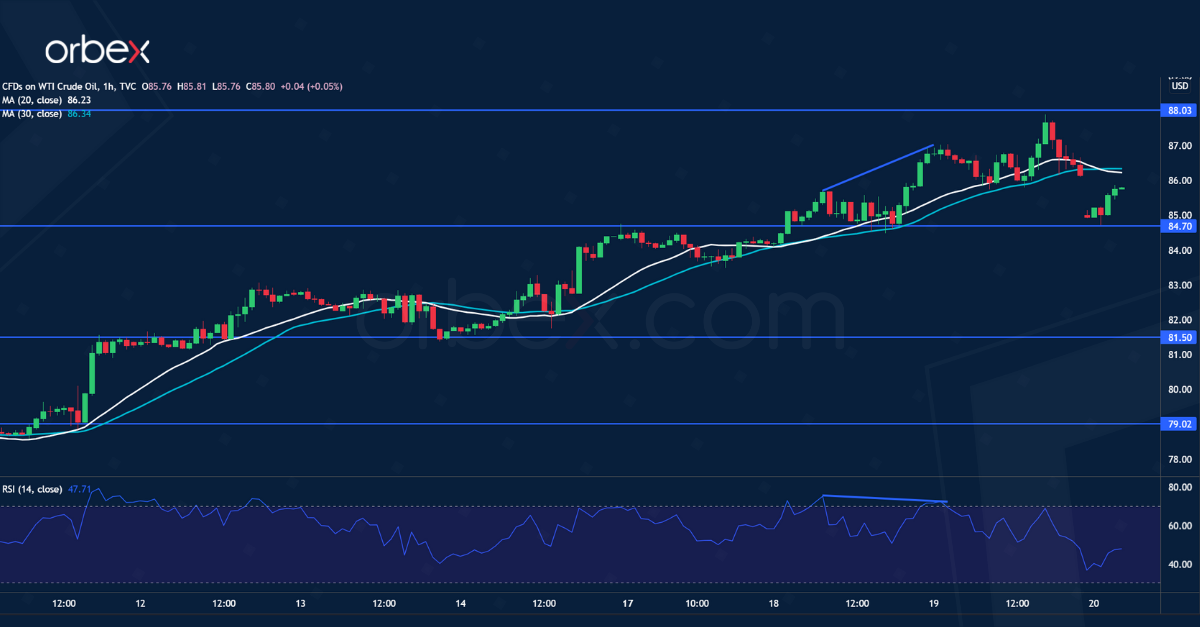
WTI crude continued upward after the IEA warned inventories in OECD countries were at their lowest levels.

The rally may accelerate in the medium-term after the bulls clear last October’s high at 85.00. However, the RSI has shot into the overbought area on the daily chart.

Bearish divergence on the hourly time frame suggests a slowdown in the short-term momentum. Price action could be due for a pullback. 84.70 is the first support and 88.00 is the resistance when the price bounces back.


Orbex-LogoArticle by Orbex

Orbex is a fully licensed broker that was established in 2011. Founded with a mission to serve its traders responsibly and provides traders with access to the world’s largest and most liquid financial markets. www.orbex.com

The Fed’s failure on inflation is bullish for Bitcoin: Nigel Green

By George Prior

The U.S. Federal Reserve’s failure on inflation will help drive the price of Bitcoin skywards, predicts the CEO of one of the world’s largest independent financial advisory, asset management and fintech organizations.

The assessment from deVere Group’s Nigel Green, a high-profile crypto advocate, comes as the U.S. consumer price index jumped 7% in 2021, the largest 12-month gain since June 1982. The widely followed inflation index increased 0.5% from November, exceeding forecasts.

He notes: “Last year, the Federal Reserve said that inflation in 2021 would be at 1.8%.

“However, U.S. prices soared last year by the highest level in nearly four decades, draining the purchasing power of American households.

“Inflation is everywhere, and it could be around for longer than anyone would like.

“So, why didn’t the Fed – the central bank of the world’s largest economy – not see what was coming?

“Could they seriously not see how supply chain bottlenecks and a shortage of qualified workers would drive up prices and erode people’s and firms’ spending power?”

He continues: “Surely, this must be the biggest miscalculation in the history of the U.S. central bank.

“It shows how the traditional fiat system, of which it is a key component as it is charged with maintaining price stability, is dangerously out of step with reality.

“I believe this will fuel the demand – and therefore the price of Bitcoin and other cryptocurrencies.”

Why is this so?

With Bitcoin’s fixed supply of 21 million, and institutional investors increasingly moving off the sidelines and into the crypto market, it’s going to continue to outpace gold as a safe haven for capital, says Nigel Green.

“Money flows to where it gets its best treatment, and with treasuries yielding negative in real terms, moving capital into the Fed is a clear liability for investors.

“In addition, in this current inflationary period, Bitcoin has outperformed gold which, until now, has always been almost universally hailed as the ultimate inflation hedge.”

Bitcoin is often referred to as ‘digital gold’ because like the precious metal it is a medium of exchange, a unit of account, non-sovereign, decentralized, scarce, and a store of value.

“Yet, the cryptocurrency, Bitcoin is superior to gold as a medium of exchange or form of payment,” says Nigel Green.

“Unlike gold, it is a fixed unit of account and easily divisible and transportable. Gold is not easily immediately divisible, and there are potential issues with purity and verification. Whereas Bitcoin is easily traced on blockchain technology and this is going to be a considerable advantage, especially in cross-border transactions.”

He concludes: “The Fed has lost control on prices and investors are looking for safe havens to protect their purchasing power.

“Bitcoin is primed to provide the inflation shield so many are now seeking, especially as our lives and the global economy is increasingly run on tech and digital solutions, and this megatrend is only set to become more dominant moving forward.”

About:

deVere Group is one of the world’s largest independent advisors of specialist global financial solutions to international, local mass affluent, and high-net-worth clients.  It has a network of more than 70 offices across the world, over 80,000 clients and $12bn under advisement.


Murrey Math Lines 20.01.2022 (USDCHF, GOLD)

Article By RoboForex.com

USDCHF, “US Dollar vs Swiss Franc”

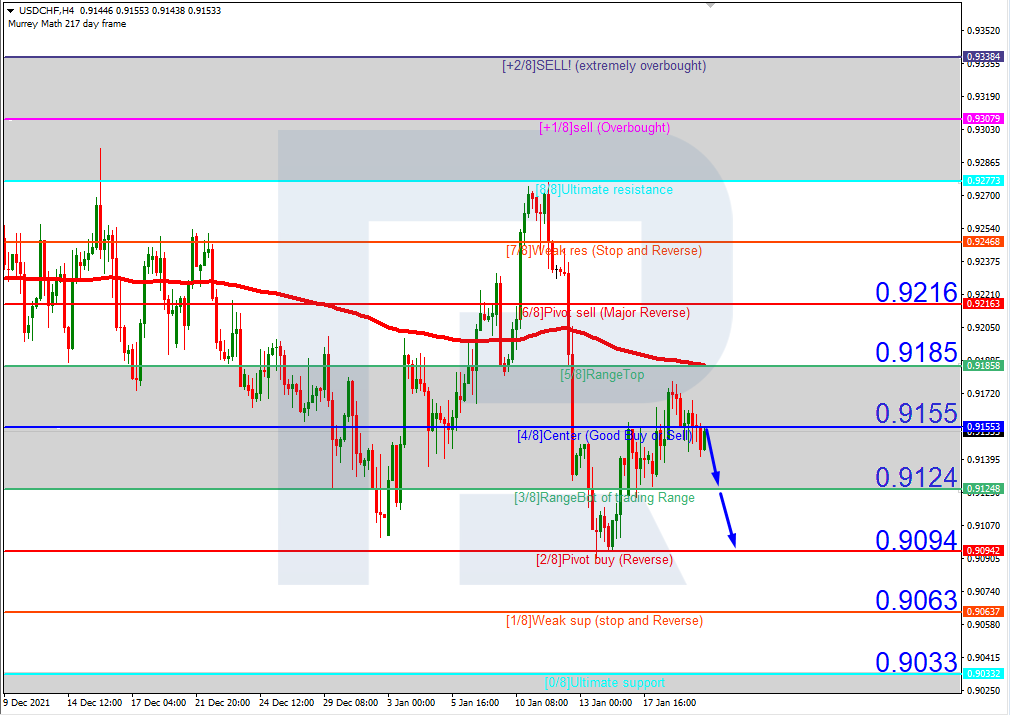
As we can see in the H4 chart, USDCHF is trading below the 200-day Moving Average, thus indicating a possible descending tendency. In this case, the price is expected to test 3/8, break it, and then continue falling to reach the support at 2/8. However, this scenario may be cancelled if the price tests and breaks 5/8 to the upside. After that, the instrument may grow towards the resistance at 7/8.

USDCHFH4
Risk Warning: the result of previous trading operations do not guarantee the same results in the future

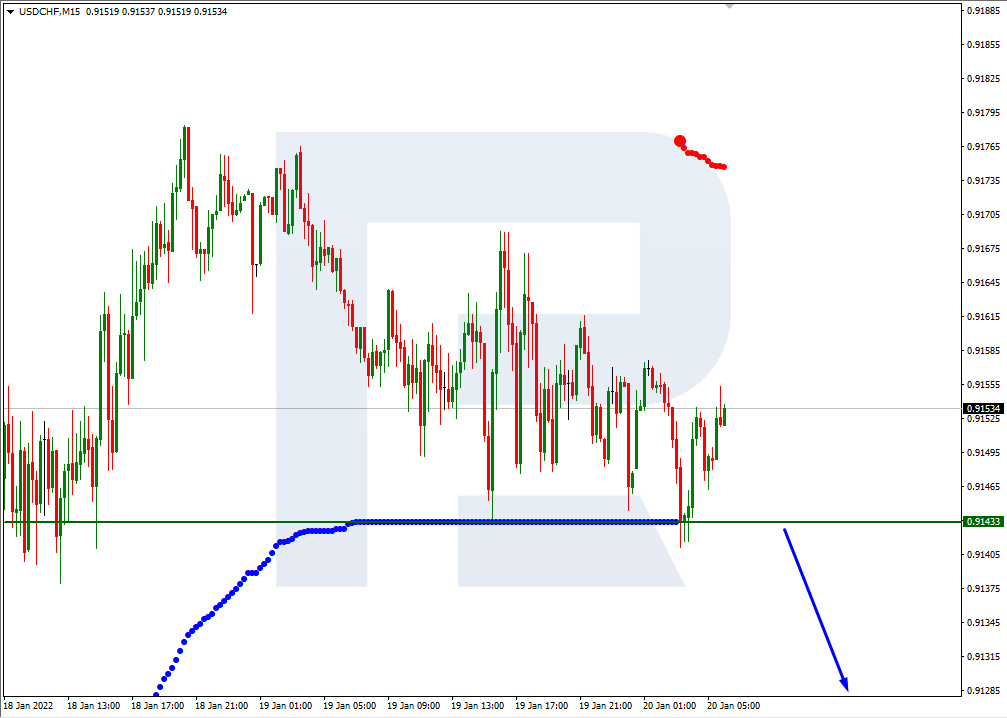
In the M15 chart, the pair may break the downside line of the VoltyChannel indicator and, as a result, continue trading downwards.

USDCHF_M15
Risk Warning: the result of previous trading operations do not guarantee the same results in the future

XAUUSD, “Gold vs US Dollar”

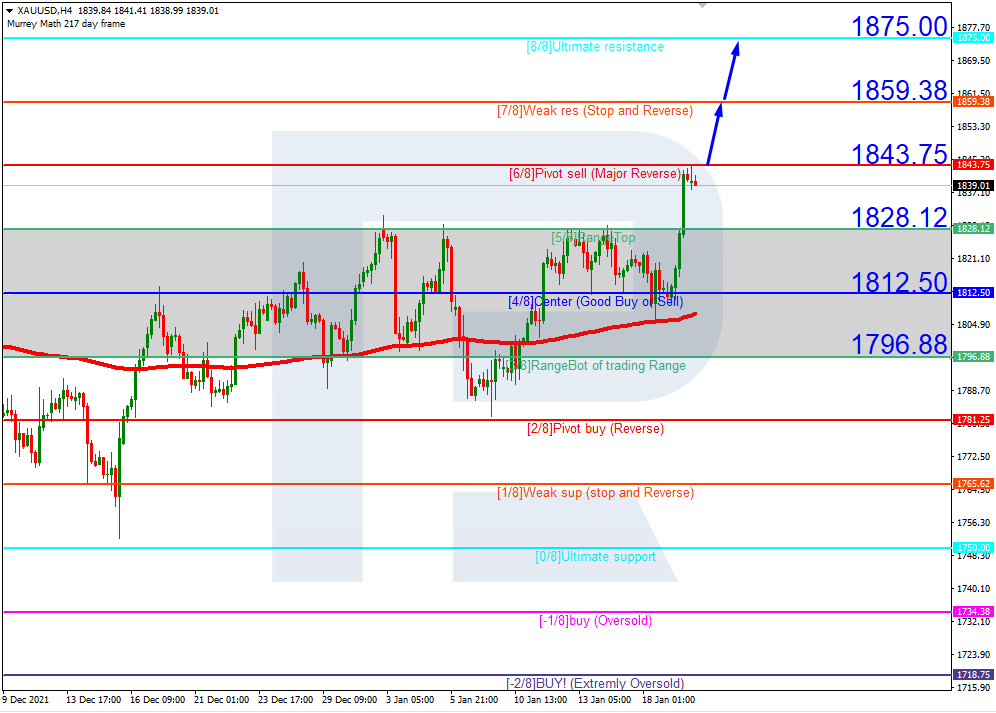
In the H4 chart, XAUUSD is trading above the 200-day Moving Average, thus indicating an ascending tendency. In this case, the price is expected to break 6/8 and move upwards to reach the resistance at 8/8. However, this scenario may no longer be valid if the price breaks the support at 5/8 to the downside. After that, the instrument may continue falling towards 3/8.

USDCAD_H4
Risk Warning: the result of previous trading operations do not guarantee the same results in the future

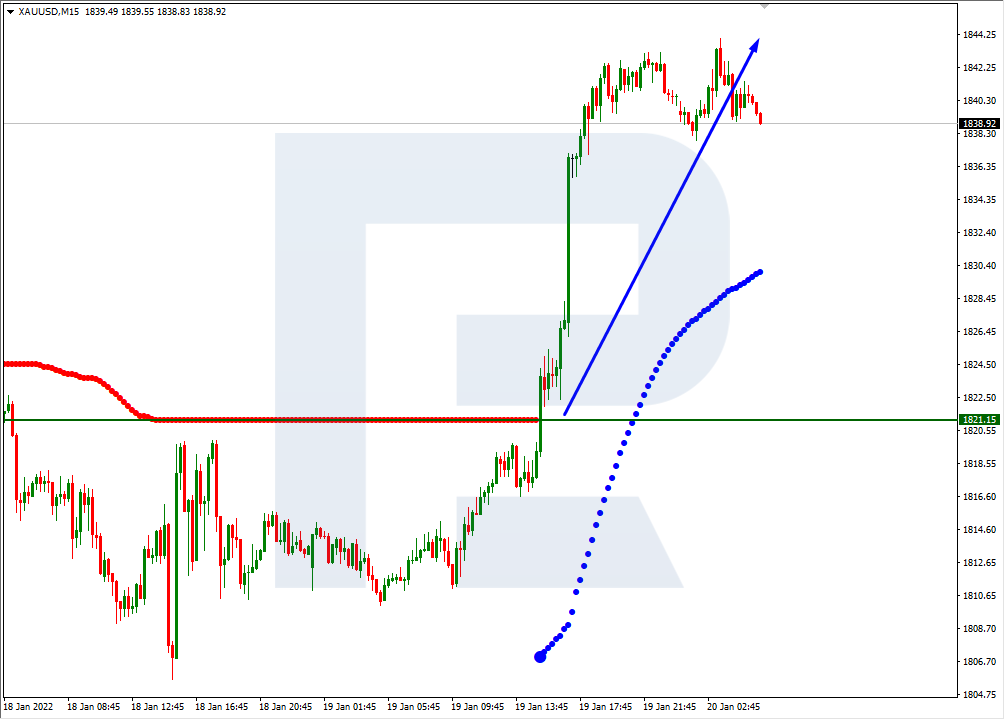
As we can see in the M15 chart, the pair has broken the upside line of the VoltyChannel indicator and, as a result, may continue growing.

USDCAD_M15

Article By RoboForex.com

Attention!
Forecasts presented in this section only reflect the author’s private opinion and should not be considered as guidance for trading. RoboForex LP bears no responsibility for trading results based on trading recommendations described in these analytical reviews.

Japanese Candlesticks Analysis 20.01.2022 (USDCAD, AUDUSD, USDCHF)

Article By RoboForex.com

USDCAD, “US Dollar vs Canadian Dollar”

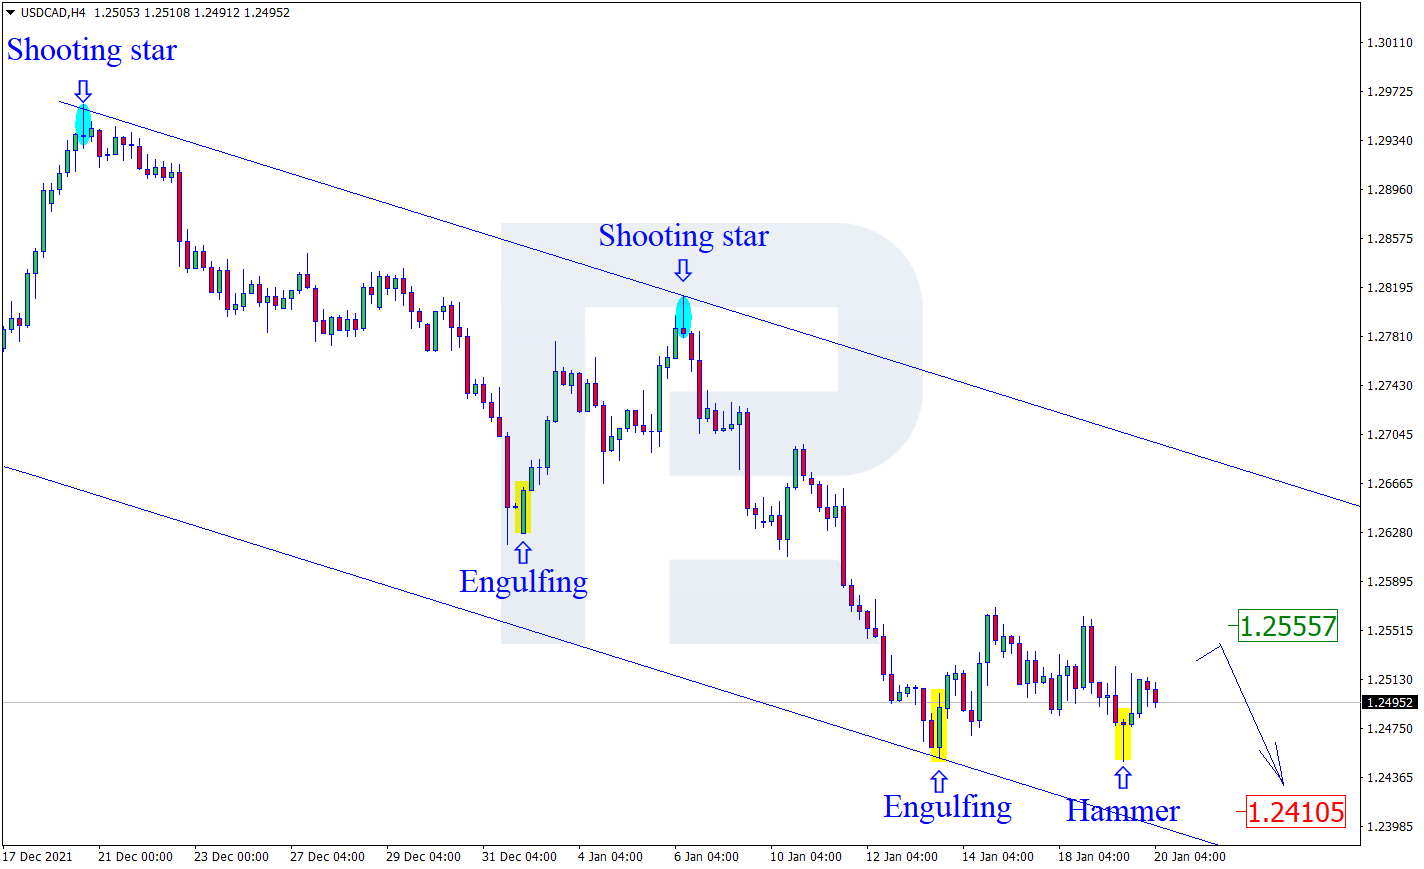
As we can see in the H4 chart, the asset continues moving sideways. After forming several reversal patterns, including Hammer, close to the support level, USDCAD is reversing and may form a new correctional impulse. In this case, the upside target may be the resistance area at 1.2555. However, an alternative scenario implies that the asset may continue falling to reach 1.2410 without forming any corrections.

USDCAD
Risk Warning: the result of previous trading operations do not guarantee the same results in the future

AUDUSD, “Australian Dollar vs US Dollar”

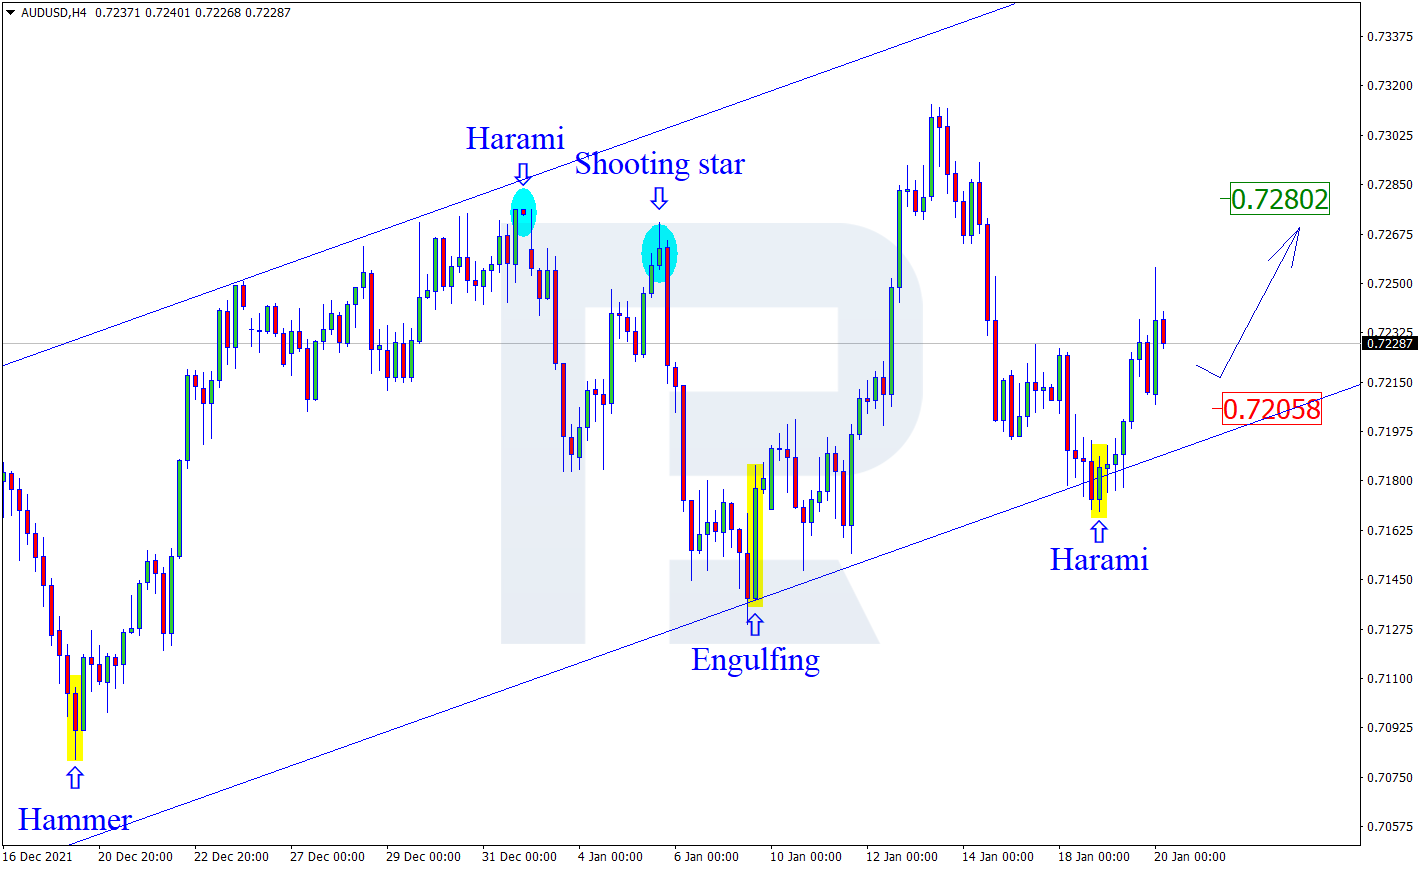
As we can see in the H4 chart, AUDUSD has formed a Harami reversal pattern near the support area. At the moment, the asset is reversing and may start a new growth. In this case, the upside target may be the resistance level at 0.7280. After testing the level, the price may break it and continue the ascending tendency. At the same time, an opposite scenario implies that the price may correct to reach 0.7205 first and then resume its uptrend.

AUDUSD
Risk Warning: the result of previous trading operations do not guarantee the same results in the future

USDCHF, “US Dollar vs Swiss Franc”

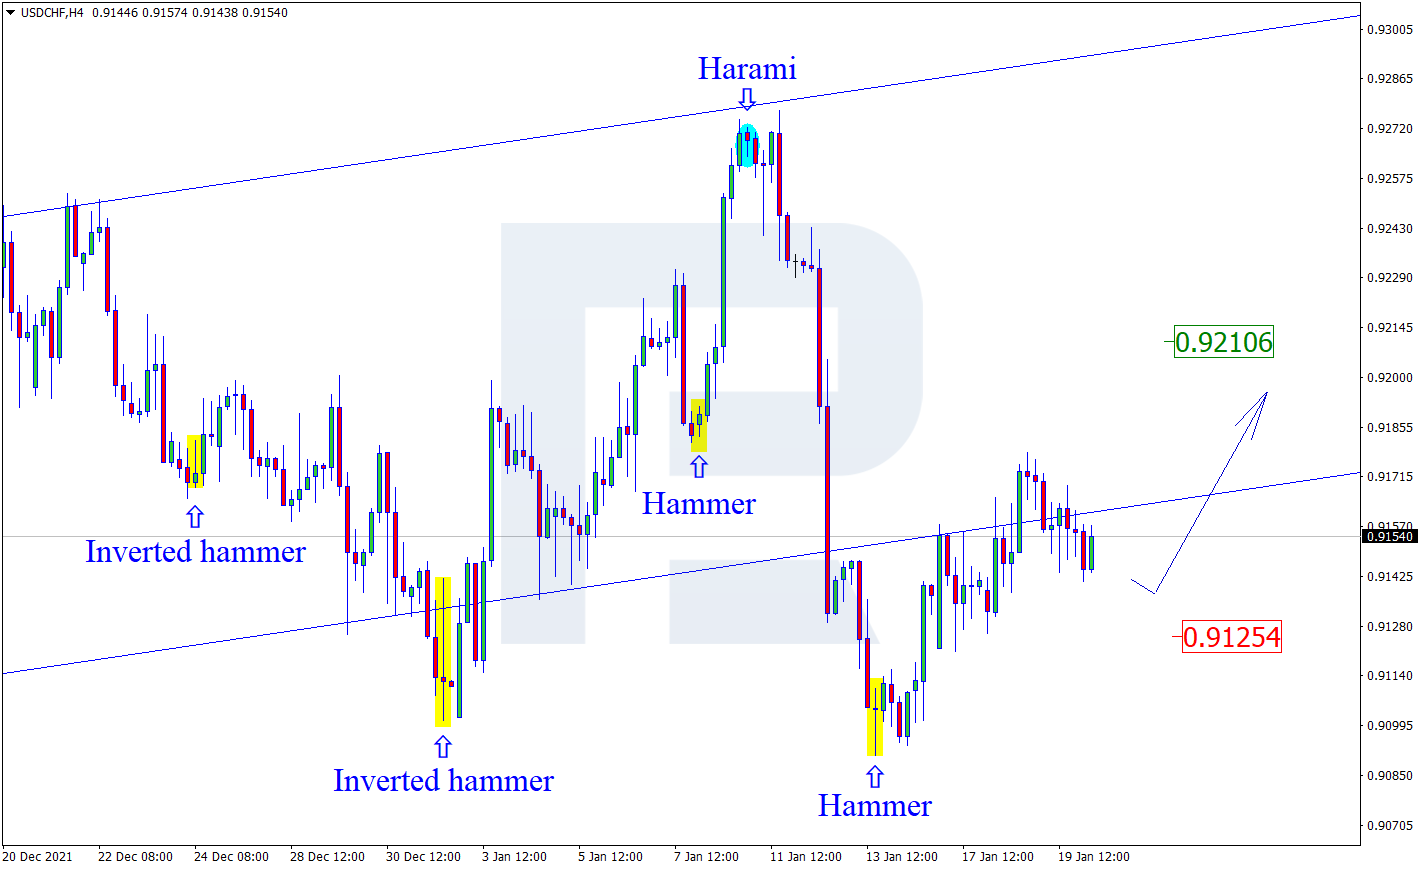
As we can see in the H4 chart, after testing the support area, the pair has formed several reversal patterns, for example, Hammer and Engulfing. At the moment, USDCHF may reverse in the form of a new rising wave towards the resistance level. In this case, the upside target may be at 0.9210. Still, there might be an alternative scenario, according to which the asset may correct to reach 0.9125 before resuming its ascending tendency.

USDCHF

Article By RoboForex.com

Attention!
Forecasts presented in this section only reflect the author’s private opinion and should not be considered as guidance for trading. RoboForex LP bears no responsibility for trading results based on trading recommendations described in these analytical reviews.

The Analytical Overview of the Main Currency Pairs on 2022.01.20

by JustForex

The EUR/USD currency pair

Technical indicators of the currency pair:
  • Prev Open: 1.1319
  • Prev Close: 1.1342
  • % chg. over the last day: +0.20%

Germany’s consumer price index increased by 0.5% in December to 3.1% in annual terms. This is the highest level since 1993. At the same time, the ECB balance sheet continues to increase. Aggregate assets rose by another 20.7 billion euros. The ECB continues to stimulate the region’s economy actively. On Wednesday, German 10-year bond yields increased above 0% for the first time since 2019, providing support for the euro. Eurozone inflation data will be released today. Analysts expect consumer prices to remain at the same level.

Trading recommendations
  • Support levels: 1.1320, 1.1305, 1.1288
  • Resistance levels: 1.1356, 1.1384, 1.1405

From a technical point of view, the EUR/USD on the hour time frame is bearish. The MACD indicator became inactive, with no signs of a reversal. Under such market conditions, it is better to consider sell trades from the resistance levels near the moving average. Buy trades can be considered on the lower time frames from the support level of 1.1320 or 1.1305, but only with additional confirmation in the form of a buyers’ initiative.

Alternative scenario: if the price breaks out through the 1.1405 resistance level and fixes above, the mid-term uptrend will be renewed.

EUR/USD
News feed for 2022.01.20:
  • – German Producer price index (m/m) at 09:00 (GMT+2);
  • – Eurozone Consumer Price Index (m/m) at 12:00 (GMT+2);
  • – Eurozone ECB Monetary Policy Statement at 14:30 (GMT+2);
  • – US Initial Jobless Claims (w/w) at 15:30 (GMT+2);
  • – US Philadelphia Fed Manufacturing Index (m/m) at 15:30 (GMT+2);
  • – US Existing Home Sales (m/m) at 17:00 (GMT+2).

The GBP/USD currency pair

Technical indicators of the currency pair:
  • Prev Open: 1.3588
  • Prev Close: 1.3612
  • % chg. over the last day: +0.18%

The UK inflation rate increased from 5.1% to 5.4% in annual terms; it’s a 30-year high. The sharp rise in the CPI is due to higher prices for products made in British factories, energy prices, and rising food prices. Analysts believe that sufficiently sustainable indicators of economic activity and high inflation are likely to convince the Bank of England to raise rates by another 25 bps in February to 0.5%.

Trading recommendations
  • Support levels: 1.3602, 1.3581, 1.3551, 1.3479
  • Resistance levels: 1.3661, 1.3689, 1.3715

On the hourly time frame, the GBP/USD trend is bearish. The MACD indicator became inactive, with no signs of a reversal. Under such market conditions, sell deals are best to look at from the resistance level of 1.3661. Buy trades should be considered from the support level of 1.3602, but only with additional confirmation in the form of buyers’ initiative.

Alternative scenario: if the price breaks out through the 1.3661 resistance level and consolidates above, the bearish scenario will be broken.

GBP/USD
There is no news feed for today.

The USD/JPY currency pair

Technical indicators of the currency pair:
  • Prev Open: 114.58
  • Prev Close: 114.32
  • % chg. over the last day: -0.23%

Japan’s economic performance is improving despite an increase in Omicron disease. Exports increased by 17.5% in December compared with the previous year. Auto export growth accelerated to 17.5% from 4.1% in November. But despite the “reviving” tendencies of the Japanese economy, experts think that new restrictions, increase in raw material prices, and the stimulating policy of the Bank of Japan will lead to a JPY decline in the coming months.

Trading recommendations
  • Support levels: 114.25, 113.99, 113.72
  • Resistance levels: 114.63, 115.04, 115.35, 115.64

The global trend on the USD/JPY currency pair is bearish. The sellers managed to protect the priority change level. Buy deals are best to look at the lower time frames from the nearest support levels. Sell trades can be considered from the resistance level of 114.63, but only with confirmation in the form of a sellers’ initiative, as the monetary policy of the Bank of Japan is now aimed at decreasing the Japanese yen.

Alternative scenario: if the price fixes above 115.04, the uptrend will likely resume.

USD/JPY
There is no news feed for today.

The USD/CAD currency pair

Technical indicators of the currency pair:
  • Prev Open: 1.2512
  • Prev Close: 1.2514
  • % chg. over the last day: +0.02%

The Canadian dollar is a commodity currency, so it depends not only on the monetary policy of the Bank of Canada but also on the oil prices and the dollar index. The oil price is traded near its maximum, and the fundamental situation is now in favor of the oil price growth. Inflation in Canada increased to a new 30-year high of 4.8% in annual terms. This adds to analysts’ confidence that Canada’s central bank will raise its interest rate in the near term.

Trading recommendations
  • Support levels: 1.2483, 1.2427
  • Resistance levels: 1.2558, 1.2628, 1.2678, 1.2715

From a technical point of view, the USD/CAD currency pair is bearish. The price is now trading in a corridor with a range of 1.2483-1.2558. The MACD indicator has become inactive. Under such market conditions, it is better to look for buy deals from the level of 1.2483 on the lower time frames. It is better to consider sell deals from the upper border of the range of 1.2558.

Alternative scenario: if the price breaks through the 1.2575 resistance level and fixes above, the downtrend is likely to be broken.

USD/CAD
News feed for 2022.01.20:
  • – US Crude Oil Reserves (w/w) at 18:00 (GMT+2).

by JustForex


This article reflects a personal opinion and should not be interpreted as an investment advice, and/or offer, and/or a persistent request for carrying out financial transactions, and/or a guarantee, and/or a forecast of future events.

US stock market shows weakness again

by JustForex

The US stock market ended Wednesday’s trading in the red zone. The growth of government bond yields reflects the market’s growing concern that central banks would reduce the quantitative easing program and raise interest rates more aggressively than originally anticipated. This is having a negative effect on the stock market, and especially on the technology companies. As the stock market closed, the S&P 500 Index (US500) decreased by 0.97%, the Dow Jones Industrial Average (US30) lost 0.96%, and the Nasdaq Technology Index (US100) fell by 1.15%. Stock markets have been falling since Fed officials said in mid-December that plans to reduce bond purchases and other stimulus measures that boost stock prices would be accelerated by a jump in US inflation. At the same time, analysts expect government bond yields to continue rising and exceed 2% in the first quarter of 2022.

In a speech yesterday, US President Joe Biden urged the Fed to do more to fight inflation.

Meanwhile, the focus of the market remained at the beginning of the corporate reporting season. Shares of Procter & Gamble, which makes household and consumer products, rose 3.4 percent after posting strong financial results.

Netflix Inc. will announce fourth-quarter results on Thursday. The streaming giant is expected to report earnings per share of 84 cents on revenue of $7.71 billion.

Yesterday, Europe’s major stock indexes were mostly up on the back of good corporate reports from European companies. Strong company reports over the last quarter offset pressure on the market from higher government bond yields amid rising inflation and growing expectations of tighter monetary policy by global central banks. German DAX (DE30) gained 0.2%, British FTSE 100 (UK100) added 0.35%, French CAC 40 (FR40) increased by 0.55%, Spanish IBEX 35 (ES35) added 0.08%. Germany’s consumer price index increased by 0.5% in December to 3.1% in annual terms. This is the highest level since 1993. Meanwhile, the ECB’s balance sheet continues to rise. On Wednesday, German 10-year bond yields rose above 0% for the first time since 2019, providing support for the euro. Eurozone inflation data will be released today. Analysts expect consumer prices to remain at the same level.

Oil prices are trading near their highs, and the fundamentals are now in favor of higher oil prices. But data from the American Petroleum Institute (API) released on Wednesday showed a 1.404 million-barrel increase in US oil inventories last week after a 1.077 million-barrel decline a week earlier. The US President Joe Biden told reporters yesterday that his administration would continue to try to lower oil prices. If today’s oil inventory data from the US Department of Energy shows an increase, oil could decline slightly.

Due to a reduction in gas supplies from Iran to Turkey, officials in the sector have ordered electricity producers using natural gas to limit consumption by 40%.

Gold and silver were surprisingly immune to the news backdrop and rising government bond yields. Usually, when bond yields rise, the precious metals fall, but not this time. Inflationary pressures are now so high that investors are buying gold as a hedge against further price increases.

On Thursday, stock markets in the Asia-Pacific region (APAC) are rising in trading amid a cut in Chinese central bank rates and positive statistics from Japan. The People’s Bank of China cut benchmark lending rates for the second month in a row in response to a slowdown in economic growth. China’s 1-year prime lending rate reduced from 3.85% to 3.7%. China’s central bank cut rates on one- and five-year loans after growth in the world’s second-largest economy fell to 4% year-over-year in the latest quarter as a result of a crackdown on rising debt among real estate developers. Investor optimism about Chinese stocks is rising as the central bank has promised to use more monetary tools to stimulate the economy, even as the Federal Reserve prepares for a series of interest rate hikes. Hong Kong’s Hang Seng Index (HK50) has jumped 3.2% since the opening trading today.

Japan’s economic performance has improved despite an increase in Omicron disease. Exports increased by 17.5% in December compared with the previous year. Auto export growth accelerated to 17.5% from 4.1% in November. Japan’s Nikkei 225 Index (JP225) increased by 1.11% from the open.

Main market quotes:

S&P 500 (F) (US500) 4,532.76 −44.35 (−0.97%)

Dow Jones (US30) 35,028.65 −339.82 (−0.96%)

DAX (DE40) 15,809.72 +37.16 (+0.24%)

FTSE 100 (UK100) 7,589.66 +26.11 (+0.35%)

USD Index 95.58 −0.16 (−0.16%)

Important events for today:
  • – Australia Unemployment Rate (m/m) at 02:30 (GMT+2);
  • – China PBoC Loan Prime Rate (m/m) at 03:30 (GMT+2);
  • – German Producer price index (m/m) at 09:00 (GMT+2);
  • – Eurozone Consumer Price Index (m/m) at 12:00 (GMT+2);
  • – Eurozone ECB Monetary Policy Statement at 14:30 (GMT+2);
  • – US Initial Jobless Claims (w/w) at 15:30 (GMT+2);
  • – US Philadelphia Fed Manufacturing Index (m/m) at 15:30 (GMT+2);
  • – US Existing Home Sales (m/m) at 17:00 (GMT+2);
  • – US Natural Gas Storage (w/w) at 17:30 (GMT+2);
  • – US Crude Oil Reserves (w/w) at 18:00 (GMT+2).

by JustForex


This article reflects a personal opinion and should not be interpreted as an investment advice, and/or offer, and/or a persistent request for carrying out financial transactions, and/or a guarantee, and/or a forecast of future events.

China rate cut boosts flagging risk sentiment

By The Market Research Team, ForexTime

There is much to keep us occupied (and up at night!) in markets at the moment. Geopolitical tensions between Russia and Ukraine are coming to a decisive point. Commodities are bid with oil prices at multi-year highs. Bond yields are a keen focus of many market observers as the widely followed US 10-year Treasury yield climbed above 1.90% before moderating. Wall Street continued lower overnight, but US stock futures are in the green and Asian markets have broken a five-day slide, helped by a mortgage rate cut in China.

This rate move mirrors the policy cut earlier in the week. Most importantly, these actions show that the authorities are being proactive to support economic growth and comes along with news stories that Chinese regulators are considering measures to support struggling real estate developers.

Mixed bag in stock markets

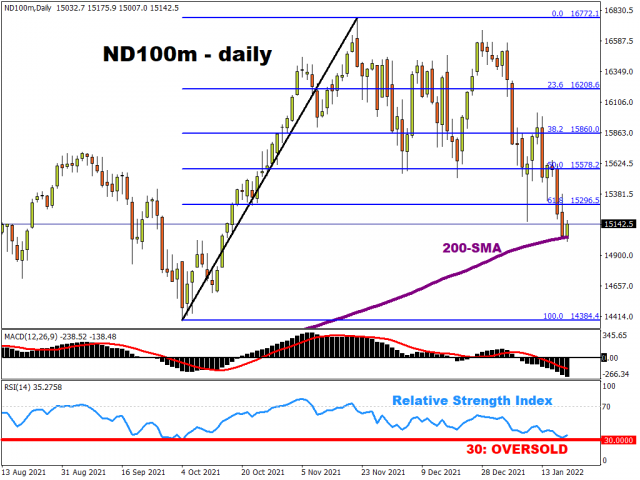
Yesterday saw the US stock markets take out key support levels as the rotation between sectors continued. The tech-laden Nasdaq entered correction territory having fallen over 10% from a November high.


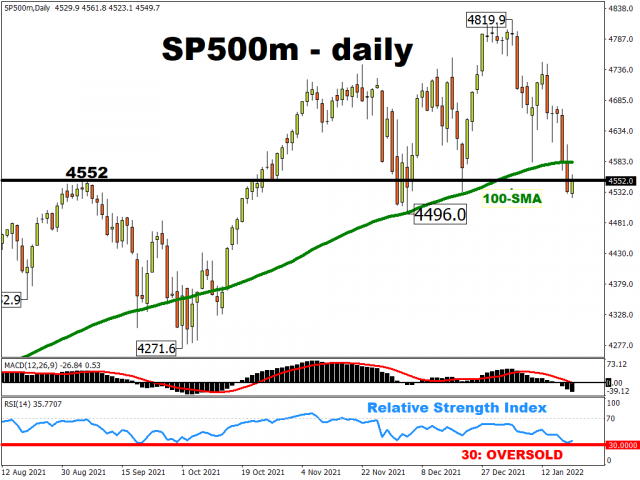
The S&P 500 is down around 5% this year and broke below the 100-day simple moving average that has provided support for the index over the past sixteen months.

Key levels on the S&P500 include the September 2021 high at 4552 and the recent December low when prices fell to 4496. The daily RSI is not oversold currently though futures markets are pointing to markets trying to gain a foothold above September support.


Oil and commodities continue higher

Oil markets rose to yet another high in seven years though has eased slightly, after the International Energy Agency (IEA) said oil demand is on track to hit pre-pandemic levels. Industrial metals have also been rallying recently, aided by China’s pledge for more support and dollar weakness. Nickel is up more than 11% so far this year.

Commodities are regarded by some as a hedge against inflationary pressures and the current multi-decade highs seen in CPI data across the globe is certainly helping to fuel the rally. Supply chain bottlenecks have also done little to improve supply and demand dislocations.


Gold breaks out above key resistance

The shiny metal has risen to its highest level in two months as some investors bought in to hedge against higher inflation. Gold has been fairly rangebound recently caught between the rising dollar and surging real yields.

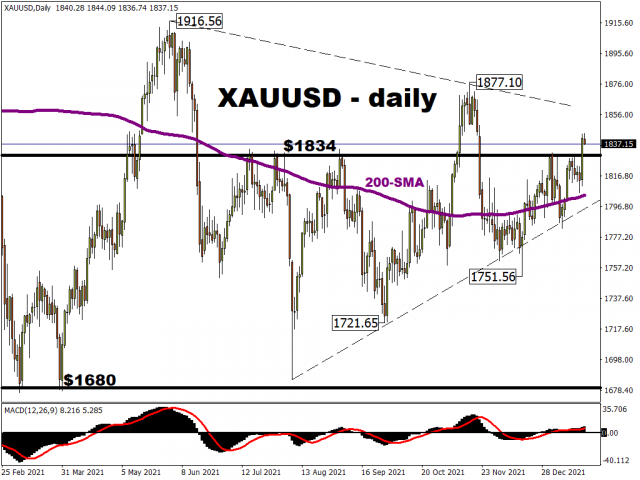
Yesterday’s breakout above the resistance area around the July and September 2021 highs at $1834 could see bugs push on the November top at $1877. As wages and energy prices continue to climb, increased stock market volatility and geopolitical concerns all support the potential for higher prices.


Disclaimer: The content in this article comprises personal opinions and should not be construed as containing personal and/or other investment advice and/or an offer of and/or solicitation for any transactions in financial instruments and/or a guarantee and/or prediction of future performance. ForexTime (FXTM), its affiliates, agents, directors, officers or employees do not guarantee the accuracy, validity, timeliness or completeness, of any information or data made available and assume no liability as to any loss arising from any investment based on the same.


Forex-Time-LogoArticle by ForexTime

ForexTime Ltd (FXTM) is an award winning international online forex broker regulated by CySEC 185/12 www.forextime.com

China cuts key interest rate 2nd month in a row

By CentralBankNews.info

China’s central bank cut its benchmark interest rate for the second consecutive month, as expected, following a cut in the rate of its medium-term loans earlier this week and yesterday’s pledge by its deputy governor the central bank would open its “monetary tool box” wider to avoid a collapse in credit.
The People’s Bank of China (PBOC) cut its one-year Loan Prime Rate (LPR) by a further 10 basis points to 3.70 percent and has now cut it 15 points in two months following a 5 point cut in December.
It is PBOC’s 7th cut in LPR since it was introduced as the benchmark rate in August 2019, with the rate now having been cut a total of 65 basis points, including two cuts in response to the COVID-19 pandemic in February and April 2020.
PBOC today also cut LPR on loans of 5 years or more – which impacts the cost of mortgages – by 5 basis points to 4.60 percent, the first cut since April 2020.
     The cut in 1-year LPR in December 2021 was part of PBOC’s four moves last year to ease its monetary policy stance as authorities seek to carefully deflate the property market without triggering a credit crunch amid slower economic growth and higher inflation.
     In July and December last year PBOC cut the reserve requirement ratio for most financial institutions by a total of 1 percentage point and also issued 85.5 billion in low cost loans to encourage financial institutions to boost their support from small enterprises and accelerate the creation of a green financial system.
     Expectations about the cut in LPR were fueled earlier this week when PBOC on Jan. 16 cut the interest rate on 700 billion yuan of one-year medium-term lending facility (MLF) loans by 10 basis points to 2.85 percent, its first cut since April 2020.
      LPR is calculated by the major financial institutions as a spread to MLF and reflects the cost of credit by 18 banks to their best customers.
      In addition to the cut in MLF, PBOC on Jan. 16 also cut the borrowing cost of 7-day reverse repos by 10 basis points to 2.10 percent when offering 100 billion yuan in reverse repos.
     On Jan. 18 PBOC Deputy Governor Liu Guoqiang told a press briefing the central bank would roll out more policies to stabilize economic growth, front-load actions and make pre-emotive moves as it seeks to spur the economy and credit.
     In the fourth quarter of last year China’s gross domestic product slowed for the third quarter in a row to an annual rise of 4.0 percent from 4.9 percent in the third quarter, 7.9 percent in the second quarter and 18.3 percent in the first quarter.
     For 2021 China’s GDP grew 8.1 percent.
     Inflation in China decelerated to 1.5 percent in December from 2.3 percent in November while producer prices decelerated to growth of 10.3 percent from 12.9 percent, with analysts saying the slowdown in inflationary pressures would give PBOC space to ease policy further.

Mid-Week Technical Outlook: Oil Hits Fresh 7 Year High

Lukman Otunuga

By Lukman Otunuga Senior Research Analyst, ForexTime

Oil bulls were injected with renewed confidence on Wednesday as Brent and Crude climbed to their highest level since October 2014.

Buying sentiment towards the global commodity was boosted by supply disruptions coming from Turkey, while the International Energy Agency’s (IEA) bullish outlook on oil markets fuelled upside gains.  As fears fade over the demand impact from Omicron and supplies are tightened by a range of outages across the globe, this could propel prices higher. We are just three weeks into the New year but both benchmarks are up almost 15%! It will be interesting to see whether the current upside momentum and fundamentals inspire a move towards $100.

Speaking of prices levels, oil remains bullish on the daily, weekly, and monthly timeframe.

Brent journeys towards $100…

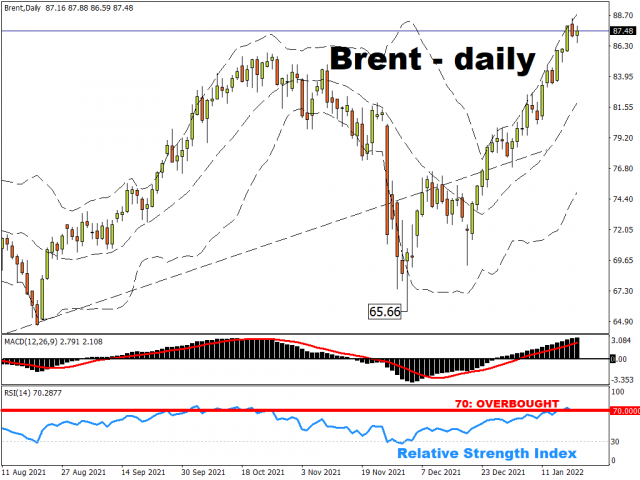
Brent is trading around $87.90 as of writing. This is roughly $12 away from the big $100 level. It is worth keeping in mind that the last time Brent saw $100 was back in 2014.

Looking at the technical picture, there have been consistently higher highs and higher lows. The technical and screaming further upside but it may be worth keeping a close eye on the fundamentals. A solid breakout above $90 could open doors towards $92.40 and $97.00 before the big $100.

Should bulls lose steam before reaching $90, a decline back below $85.80 could be a possibility.

WTI Crude not far behind

We see a similar story on WTI Crude as bulls push prices closer to the $100 level.

Prices are trading above the 50, 100, and 200-day Simple Moving Average while the MACD trades to the upside. A strong move above $90 could signal an incline towards $94 and $98 before testing $100.

Alternatively, a drop back below $84.20 may inspire bears to target $78.00.

Disclaimer: The content in this article comprises personal opinions and should not be construed as containing personal and/or other investment advice and/or an offer of and/or solicitation for any transactions in financial instruments and/or a guarantee and/or prediction of future performance. ForexTime (FXTM), its affiliates, agents, directors, officers or employees do not guarantee the accuracy, validity, timeliness or completeness, of any information or data made available and assume no liability as to any loss arising from any investment based on the same.


Forex-Time-LogoArticle by ForexTime

ForexTime Ltd (FXTM) is an award winning international online forex broker regulated by CySEC 185/12 www.forextime.com