
By Ino.com
– Back in April 2020, in my post, I had surmised “Gold Could Fly Over A Helicopter Throwing Money” as the fourth round of Quantitative Easing (QE4) had started a month earlier in March 2020 with an initial pledge to inject $700 billion via asset purchases to support U.S. liquidity. The price of gold was $1,681 at that time.
We all knew that the printing press should push gold prices higher. I tried to calculate the possible target area for the gold price using comparative analysis of the past period, and then I set the range of three goals: $2,000-$2,200-$2,540. Your reaction had come as follows.
The ultra-bullish $2,540 target dominated the ballot. However, the second bet with a more realistic $2,000 target was the closest yet as we saw the all-time high at $2,075 in August 2020. I guess I found the reason for this outcome in the monthly chart below.
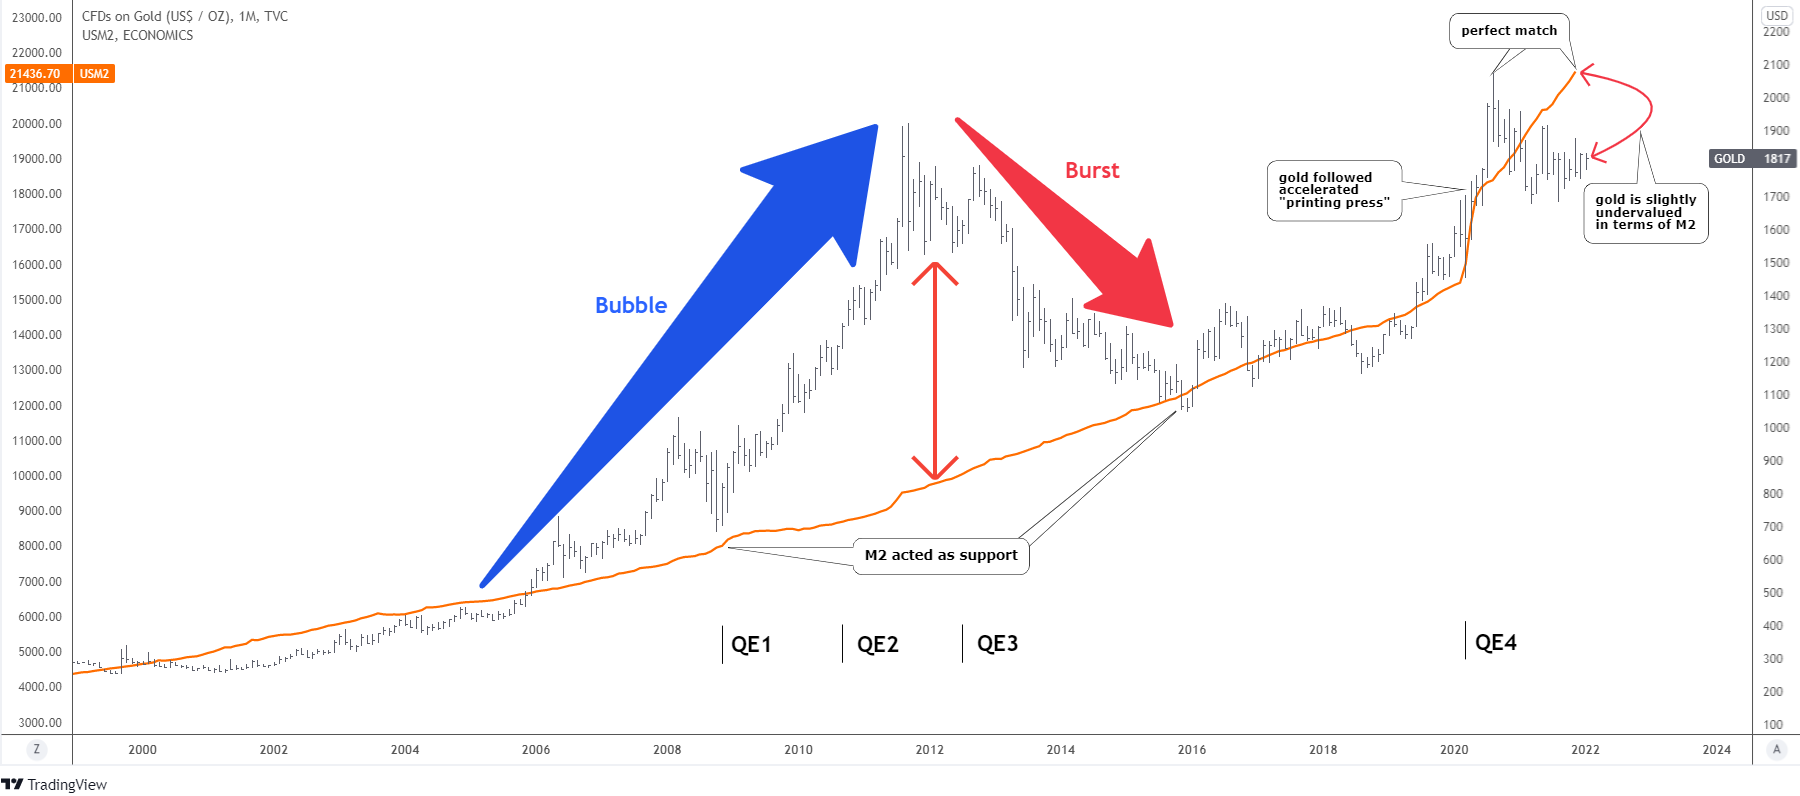
At first glance, one could think I added the orange moving average in the gold chart above. This is the U.S. M2 money supply indicator. What is M2? The M2 is a gauge of the money supply that includes cash, checking deposits, and easily convertible “near money.” It is watched closely as an indicator of money supply and future inflation and a target of central bank monetary policy.
Free Reports:
 Sign Up for Our Stock Market Newsletter – Get updated on News, Charts & Rankings of Public Companies when you join our Stocks Newsletter
 Get our Weekly Commitment of Traders Reports - See where the biggest traders (Hedge Funds and Commercial Hedgers) are positioned in the futures markets on a weekly basis.
The graph covers the period since the start of the century. One could notice that the initial period was relatively calm as both indicators were just crawling until the gold price crossed over the M2 line in 2006. The flight to safety started with early warning signals from emerging markets; it was ahead of the Great Recession.
“Buy rumors, sell facts” saying played out in 2008 as the gold price collapsed within a deep correction after the all-time high beyond $1,000 was established. The price almost touched the M2 orange line and bounced back to the upside as the U.S. Fed announced the first round of Quantitative Easing (QE1) in November 2008. Two other rounds of stimulus followed, and the latter lasted until October 2014. The M2 line gets steeper consequently.
The market overreacted during that period as many experts called for a doomsday. The gold price was bubbling (blue up arrow) as the gap to the M2 line was growing rapidly. The utter fear pushed the price above $1,900 to establish the all-time high. Then the bubble has burst quickly (red down arrow) as the price dropped close to $1,000. There again, we can see the strong support of the M2 line as gold bounced off it.
After that, the price was back to the normal mode, as we cannot see any enormous deviation from 2008-2011.
The last part is interesting as the price followed the sharp M2 trend precisely, especially during the inception of QE4 in March 2020. Only in the summer of 2020, the strong impulse of the gold price surpassed the money supply line to establish the new all-time high record at $2,075. The M2 line caught up after a while. The magical thing here is that the gold peak corresponds precisely with the current top of M2.
The profit-taking brought the price below the money supply line. As a result, it looks slightly undervalued in terms of M2. However, the fair price is around the record high of $2075.
The ongoing tapering and the prospects of rising interest rates put pressure on the top metal. On the other hand, the money supply could only diminish the angle of the uptrend, as the main trajectory to the upside should stay intact, supporting the gold price. The monetarists rule the financial world now, and they would not allow the money supply to drop; otherwise, it will have dire consequences for the system.
In terms of comparison, we could have three modes: A bubbling gold price, balance, and undervalued gold. We are between the Balance and Light Undervaluation. It could last longer this year. To enter the Bubble mode, another round of QE should start, or the new enormous fear should captivate markets.
Intelligent trades!
Aibek Burabayev
INO.com Contributor, Metals
Disclosure: This contributor has no positions in any stocks mentioned in this article. This article is the opinion of the contributor themselves. The above is a matter of opinion provided for general information purposes only and is not intended as investment advice. This contributor is not receiving compensation (other than from INO.com) for their opinion.
By Ino.com – See our Trader Blog, INO TV Free & Market Analysis Alerts
Source: Gold Has Stalled At Equilibrium

- COT Metals Charts: Weekly Speculator Bets led by Copper & Steel Jul 18, 2026
- COT Bonds Charts: Weekly Speculator Bets led by 2-Year, SOFR 3M & 5-Year Bonds Jul 18, 2026
- COT Energy Charts: Weekly Speculator Bets led by Brent Oil & Heating Oil Jul 18, 2026
- COT Soft Commodities Charts: Weekly Speculator Bets led by Wheat, Corn & Soybean Meal Jul 18, 2026
- The Bank of Canada kept its interest rate unchanged. Platinum prices reached a three‑week high Jul 16, 2026
- Stock indices rose after the release of US inflation data. China’s GDP slowed sharply Jul 15, 2026
- GBP/USD Awaits Political News: What Will Happen Next Jul 15, 2026
- USD/JPY Holds at Highs: Pressure Lingers on Yen Jul 14, 2026
- Oil prices jumped 4% amid a new wave of escalation between the US and Iran Jul 13, 2026
- EUR/USD: US Inflation Will Determine Everything Jul 13, 2026