Market Mood Lifted By Renewed Peace Talk Hopes

By Lukman Otunuga Senior Research Analyst, ForexTime 

A sense of positivity returned to financial markets as the prospects of more ceasefire talks between Russia and Ukraine soothed investor jitters.

Asian shares opened higher on Tuesday morning, tracking the positive overnight cues from Wall Street as market players cast aside fears of rising interest rates to focus on geopolitical developments. European stocks pushed higher this morning amid the improving market mood, with the risk-on sentiment potentially keeping US equity bulls in the driving seat later this afternoon.

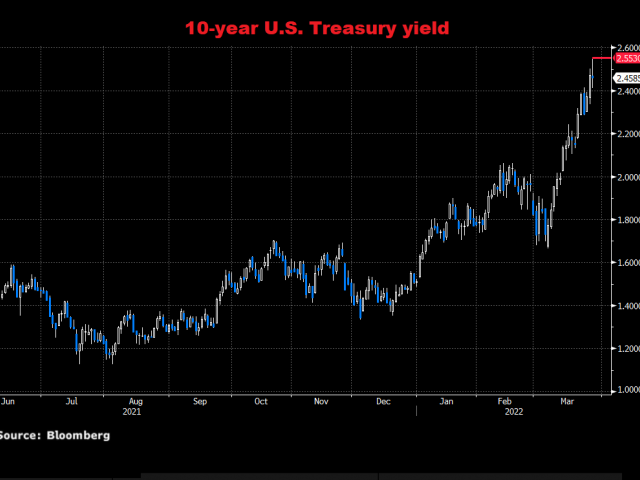
In the currency arena, the yen hijacked our attention by weakening to levels not seen in seven years as the Bank of Japan intervened in bond markets to cap yields. Oil prices tumbled as China lockdowns prompted demand worries, while gold stood little chance against an appreciating dollar and rising Treasury yields. The widely watched US 10-year Treasury yield hit 2.5% yesterday.

On the geopolitical front, Ukraine’s president has said he is willing to discuss becoming a neutral country as part of a peace deal with Russia. Should a ceasefire agreement become reality, this could boost global sentiment further and revive investor confidence, sending equity markets higher.

Japanese Yen melts as BoJ intervenes

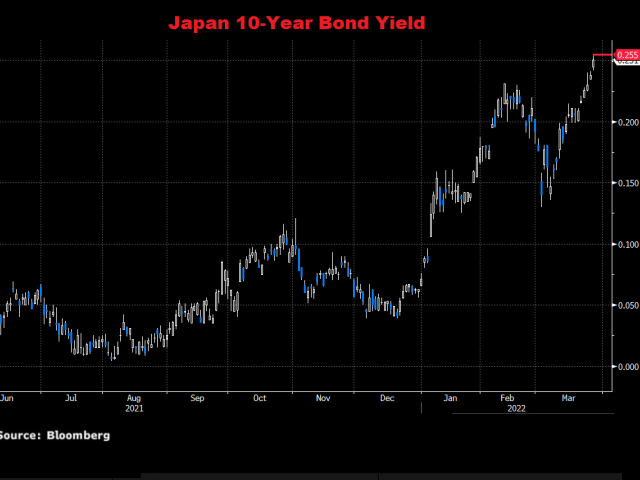
The yen is struggling to nurse the deep wounds inflicted by yesterday’s painful selloff. It weakened to a seven-year low against the dollar after the Bank of Japan (BoJ) offered to buy an unlimited amount of 10-year Japanese Government Bonds after yields rose to a fresh six-year high of 0.255%.

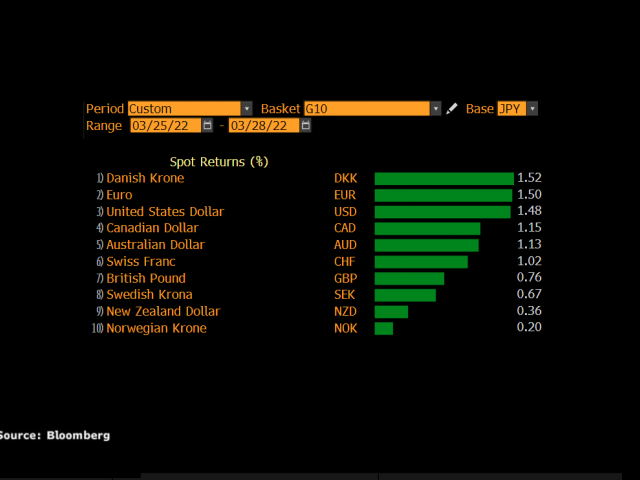
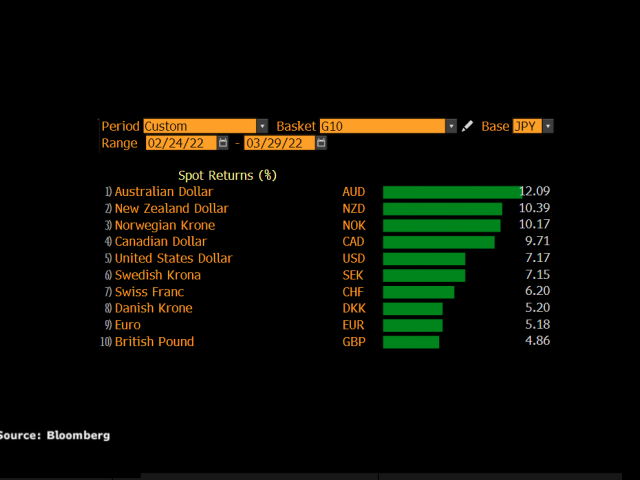
One would think that the extreme levels of uncertainty and geopolitical risks would send investors rushing towards the yen. However, the currency has weakened against every G10 currency since 24 February, when Russia began its invasion of Ukraine.

It is becoming clear that the yen’s weakness is a product of central bank divergence among other themes. While the Fed is willing to raise interest rates aggressively to tame rising inflation, the BoJ continues to stick with its dovish policy settings. If it carries on intervening to prevent yields from rising beyond the 0.25% policy target while other major market yields continue to rise, this could result in further yen weakness.

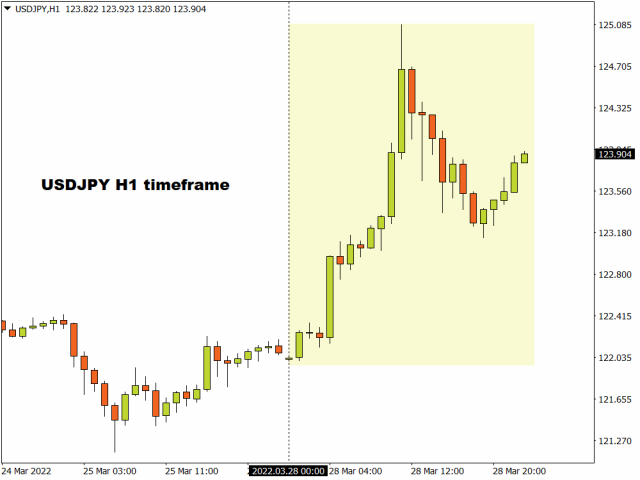
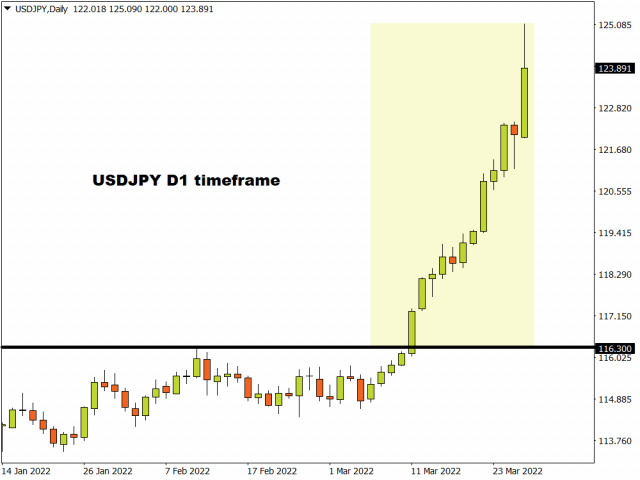
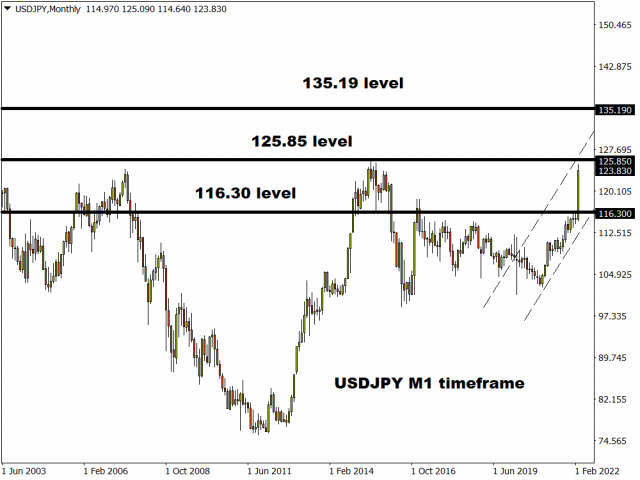
Looking at the technical picture, USD/JPY is heavily bullish on the daily charts. A strong close above 125.00 could open the door to the 2015 high around 125.85. Should 125.00 prove to be reliable resistance, prices could decline back towards 122.50 before experiencing some consolidation.

Oil prices shaky ahead of OPEC+ meeting

Oil benchmarks were shaky this morning after falling in the previous session amid fears over weaker fuel demand in China. WTI Crude and Brent have shed over 7% since the start of this week.

The world’s second-largest economy has announced its biggest city-wide lockdown since the Covid outbreak started more than two years ago. Given how China is the world’s largest crude consumer, this development continues to weigh on oil markets.

There could also be more volatility ahead with the OPEC+ meeting on Thursday. The cartel will determine output production beginning in May with markets expecting the group to stick with its pre-planned production quota hike of 400,000 barrels per day. Expect oil to remain sensitive to any news revolving around the China lockdown and Ukraine developments.

Gold breakdown on the horizon?

This could be a rough week for gold as renewed peace talks rekindle risk appetite. An appreciating dollar and rising Treasury yields are likely to rub salt into the wound, sending the precious metal on a slippery decline. On top of this, the US jobs report on Friday could compound gold’s woes if the numbers exceed market expectations.

Looking at the technical picture, prices have the potential to sink lower if a solid breakdown below the $1910 support is achieved. This could open the door towards $1900 and $1875. Should $1910 prove to be reliable support, prices may rebound back towards $1965 and $2000, respectively.

Disclaimer: The content in this article comprises personal opinions and should not be construed as containing personal and/or other investment advice and/or an offer of and/or solicitation for any transactions in financial instruments and/or a guarantee and/or prediction of future performance. ForexTime (FXTM), its affiliates, agents, directors, officers or employees do not guarantee the accuracy, validity, timeliness or completeness, of any information or data made available and assume no liability as to any loss arising from any investment based on the same.


Forex-Time-LogoArticle by ForexTime

ForexTime Ltd (FXTM) is an award winning international online forex broker regulated by CySEC 185/12 www.forextime.com

Trade Of The Week: More Pain Ahead For The Yen?

By Lukman Otunuga Senior Research Analyst, ForexTime

Forget waiting on the upcoming OPEC meeting later this week or US jobs report on Friday.

If you want market action now, then check out the Japanese Yen.

The currency was beaten black and blue on Monday, weakening to a seven-year low against the dollar.

It stood little chance against other G10 majors.

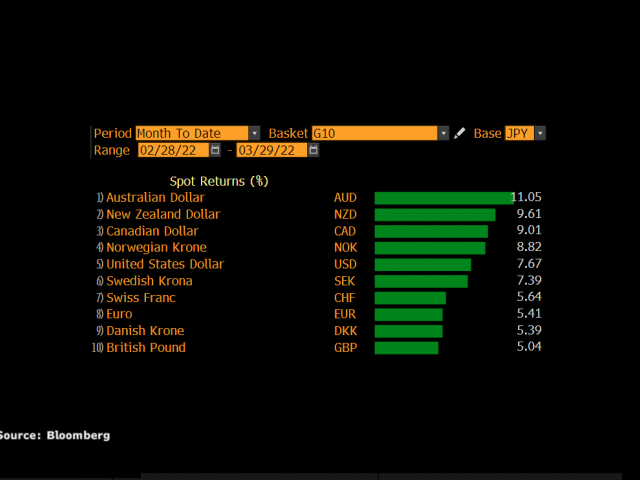
In fact, since the start of March, the Yen has turned into a punching bag for its major counterparts.

There were a couple of factors behind the Yen’s painful selloff.

A key culprit was the Bank of Japan (BoJ) offering to buy an unlimited amount of 10-year Japanese Government Bonds (JGB) after yields rose to a fresh six-year high of 0.255%. Secondly, the widening monetary policy divergence between the BoJ and the Federal Reserve (Fed). While the Fed is willing to raise interest rates more aggressively in the face of soaring inflation, the BoJ continues to ease monetary policy aggressively.

These fundamental forces have injected the USDJPY with vitality and direction. The currency pair remains heavily bullish on the daily charts with the path of least resistance north.

Why is the Yen getting no love?

One would think that the heightened levels of uncertainty, explosive volatility, and geopolitical risks would send investors rushing toward’s the Yen’s safe embrace. However, the numbers are saying a different story. Since the 24th of February 2022, when Russia began its invasion of Ukraine – the Yen has weakened against every single G10 currency.

This weakness could be based around:

  1. Divergence in monetary policy

Central banks across the world remain entangled in a fierce battle against soaring inflation. This month alone, the Fed raised rates for the first time since 2018, the Bank of England raised rates for the third consecutive meeting while the Bank of Canada raised interest rates. Even the ECB struck a hawkish tone.

The BoJ, in contrast has held tight to its dovish monetary policy.

  1. Yields differentials 

As central banks across the world raise interest rates in the face of rising inflation, this has hammered bond markets – resulting in higher yields across the world.

   -High inflation is bad for bonds.

   -Bonds are inversely correlated to interest rates.

The 10-year Treasury yield punched above 2.5% on Monday with similar scenes witnessed across the world.

Even in Japan, the 10-year JGB yield crept up to a six-year high of 0.255% – prompting the BoJ to announce that it would buy unlimited amounts of 10-year JGB at a fixed rate of 0.25%. This move was to prevent yields from rising beyond the 0.25% policy target.

It is worth keeping in mind that the BoJ operates a policy of yield curve control.

The central bank will allow the 10-year treasury yield to move flexibly around its 0% target as long as it stays below the 0.25% upper limit – printing whatever money is needed to keep yields at that level. Given how bond prices are rising across the world amid higher interest rates, this has also impacted Japanese bonds. Ultimately, if you print cash to control yields this will hit the currency. This is what happened to the Yen.

But the key thing here is yield differentials. Japanese bonds yields are being capped at 0.25% by the BoJ, relative to other major market yields which have surged to multi-year highs. As the yield differentials widen, this could keep yen bears in the driving seat.

  1. An appreciating dollar

The dollar is likely to draw strength from rising Treasury yields, enforcing more pressure on the Japanese Yen. As highlighted earlier, the greenback has appreciated over 7% against the dollar since the start of 2022. With the mighty dollar still in a position of power and likely to appreciate as we explained here, this could push the USDJPY higher in the medium to longer term.

USDJPY eyes 2015 high

A weaker Yen propelled the USDJPY to a fresh 7 year high on Monday with prices trading around 123.72 as of writing. A solid daily close above 125.00 could open doors toward the June 2015 peak of 125.85. Beyond this level, prices could rally towards 129.00, a level not seen in almost 20 years.

If the upside momentum runs of out steam, the USDJPY could decline back towards 122.50 before experiencing a technical rebound or extending losses towards 121.00 and 119.40, respectively.

Disclaimer: The content in this article comprises personal opinions and should not be construed as containing personal and/or other investment advice and/or an offer of and/or solicitation for any transactions in financial instruments and/or a guarantee and/or prediction of future performance. ForexTime (FXTM), its affiliates, agents, directors, officers or employees do not guarantee the accuracy, validity, timeliness or completeness, of any information or data made available and assume no liability as to any loss arising from any investment based on the same.


Forex-Time-LogoArticle by ForexTime

ForexTime Ltd (FXTM) is an award winning international online forex broker regulated by CySEC 185/12 www.forextime.com

EURUSD Is Going Down

By RoboForex Analytical Department

The major currency pair continues falling. On Monday 28 March, EUR/USD is trading at 1.0951.

The currency market is still interested in the “greenback” as a “safe haven” asset – investors need to hedge risks amid both global geopolitical tensions and the US Fed’s policy.

Earlier, Fed Chairman Jerome Powell said that the benchmark interest rate might leap up 50 basis points if the regulator couldn’t handle inflation.

There will be six more Fed meetings this year and the rate might be raised after each of them.

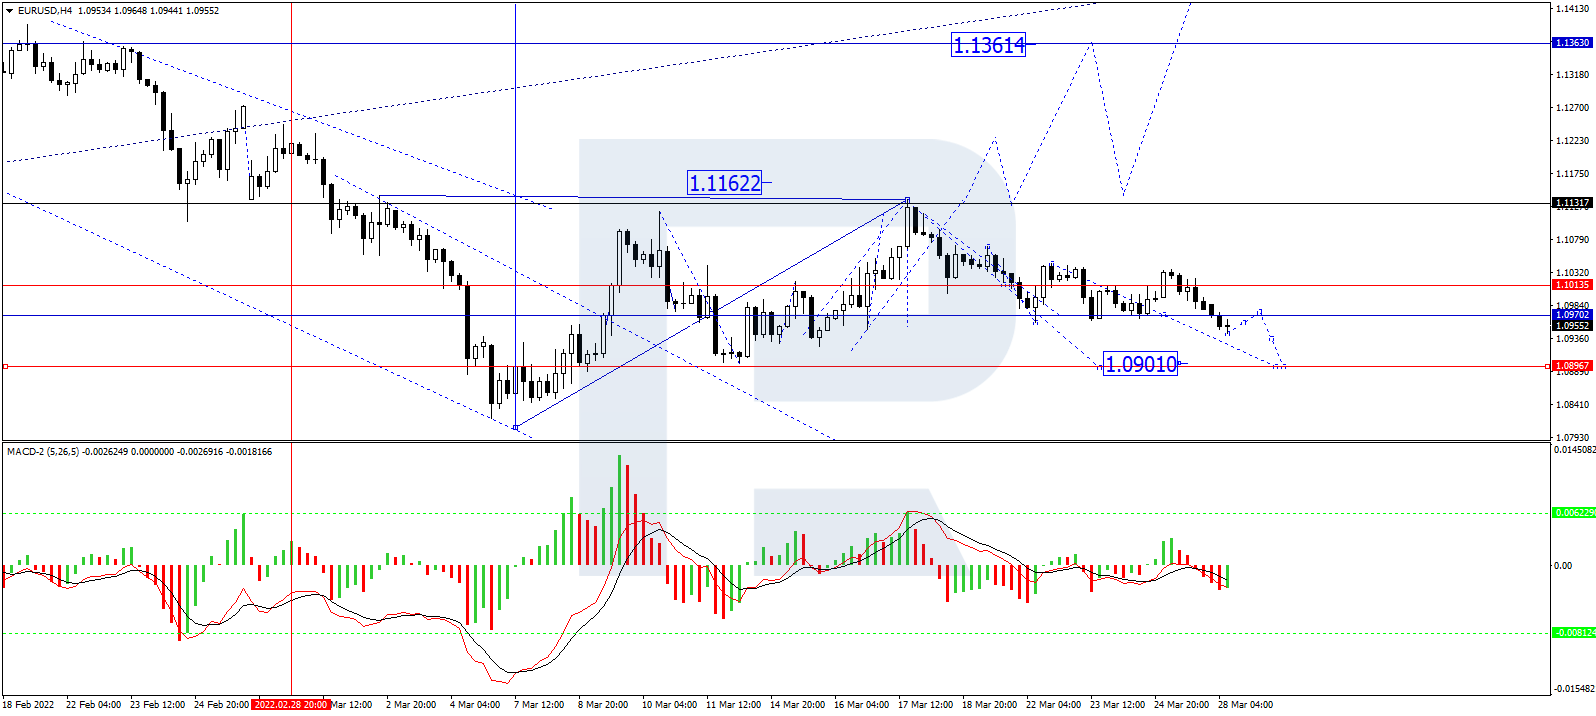
In the H4 chart, having formed a new consolidation range around 1.1010 and broken it to the downside, EUR/USD is expected to test 1.0970 and then complete the correction at 1.0901. Later, the market may form one more ascending wave the target at 1.1133. From the technical point of view, this scenario is confirmed by MACD Oscillator: its signal line is falling below 0 and may soon update the lows.

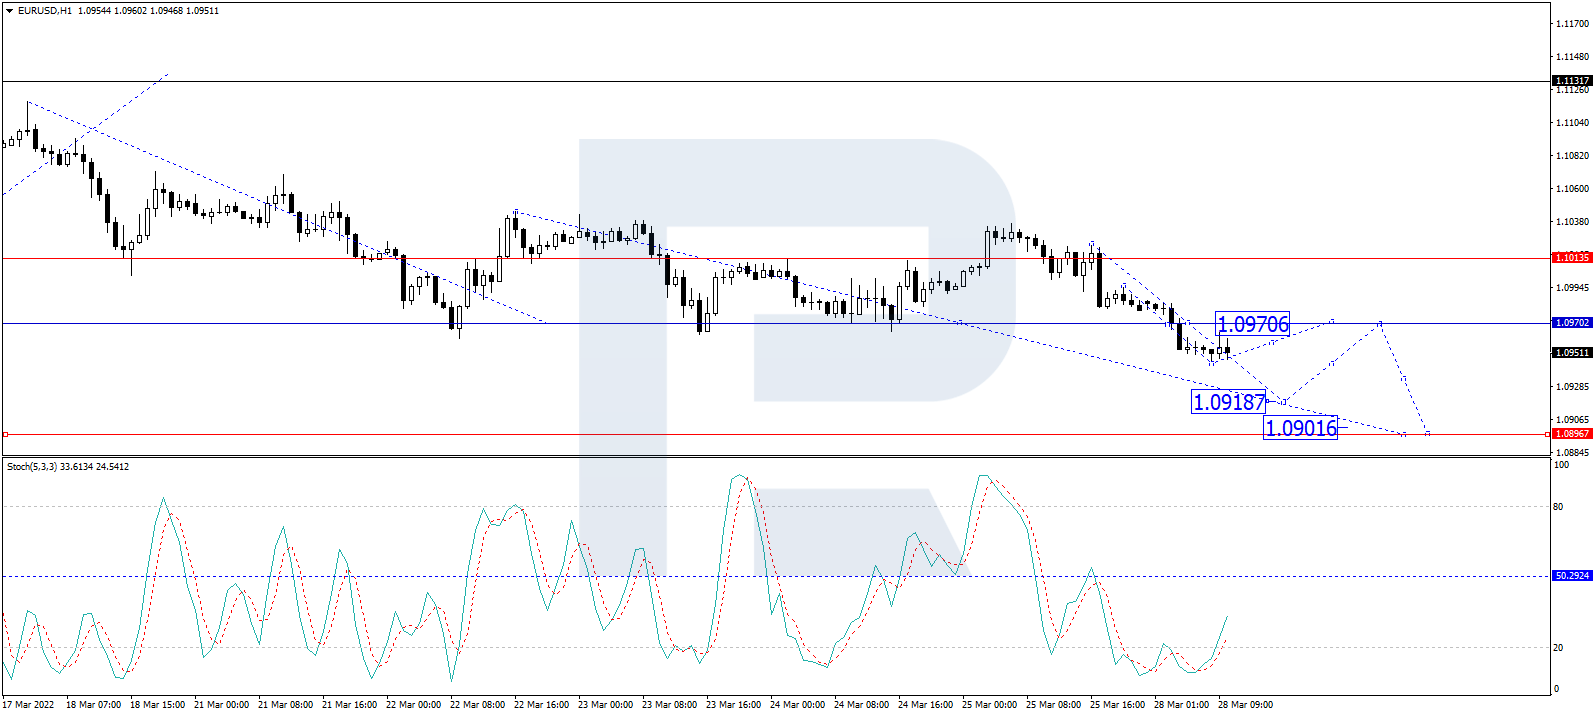
As we can see in the H1 chart, after breaking 1.0970 to the downside, EUR/USD is expected to test it from below and may later form a new ascending structure with the short-term target at 1.0919. After that, the instrument may grow to re-test 1.0970 from below and then resume trading downwards with the target at 1.0900. From the technical point of view, this idea is confirmed by the Stochastic Oscillator: after breaking 20 to the upside, its signal line may continue moving to reach 50. Later, the line may rebound from 50 and start a new decline towards 20.

Disclaimer: Any forecasts contained herein are based on the author’s particular opinion. This analysis may not be treated as trading advice. RoboForex bears no responsibility for trading results based on trading recommendations and reviews contained herein.

New data-sharing requirements from the National Institutes of Health are a big step toward more open science – and potentially higher-quality research

By Stephen Jacobs, Rochester Institute of Technology 

Starting on Jan. 25, 2023, many of the 2,500 institutions and 300,000 researchers that the U.S. National Institutes of Health supports will need to provide a formal, detailed plan for publicly sharing the data generated by their research. For many in the scientific community, this new NIH Data Management and Sharing Policy sounds like a no-brainer.

The incredibly quick development of rapid tests and vaccines for COVID-19 demonstrate the success that can follow the open sharing of data within the research community. The importance and impact of that data even drove a White House Executive Order mandating that “the heads of all executive departments and agencies” share “COVID-19-related data” publicly last year.

I am the Director of the Rochester Institute of Technology’s Open Programs Office. At Open@RIT, my colleagues and I work with faculty and researchers to help them openly share their research and data in a manner that provides others the rights to access, reuse and redistribute that work with as few barriers or restrictions a possible. In the sciences, these practices are often referred to as open data and open science.

The journal Nature has called the impact of the NIH’s new data management policy “seismic,” saying that it could potentially create a “global standard” for data sharing. This type of data sharing is likely to produce many benefits to science, but there also are some concerns over how researchers will meet the new requirements.

The large, brown building that houses the NIH.
The National Institutes of Health has had data-sharing guidelines in place for years, but the new rules are by far the most comprehensive.
NIH

What to share and how to share it

The NIH’s new policy around data sharing replaces a mandate from 2003. Even so, for some scientists, the new policy will be a big change. Dr. Francis S. Collins, then Director of the NIH, said in the 2020 statement announcing the coming policy changes that the goal is to “shift the culture of research” so that data sharing is the norm, rather than the exception.

Specifically, the policy requires two things. First, that researchers share all the scientific data that other teams would need in order to “validate and replicate” the original research findings. And second, that researchers include a two-page data management plan as part of their application for any NIH funding.

So what exactly is a data management plan? Take an imaginary study on heat waves and heatstroke, for example. All good researchers would collect measurements of temperature, humidity, time of year, weather maps, the health attributes of the participants and a lot of other data.

Starting next year, research teams will need to have determined what reliable data they will use, how the data will be stored, when others would be able to get access to it, whether or not special software would be needed to read the data, where to find that software and many other details – all before the research even begins so that these things can be included in the proposal’s data management plan.

Additionally, researchers applying for NIH funding will need to ensure that their data is available and stored in a way that persists long after the initial project is over.

The NIH has stated that it will support – with additional funding – the costs related to the collection, sharing and storing of data.

The logo of the Human Genome Project
The open sharing of data has a history of promoting scientific excellence and was central to the Human Genome Project that first mapped the entire human genome.
U.S. Department of Energy, Human Genome Project via Wikimedia Commons

Sharing data promotes open science

The NIH’s case for the new policy is that it will be “good for science” because it maximizes availability of data for other researchers, addresses problems of reproducibility, will lead to better protection and use of data and increase transparency to ensure public trust and accountability.

The first big change in the new policy – to specifically share the data needed to validate and replicate – seems aimed at the proliferation of research that can’t be reproduced. Arguably, by ensuring that all of the relevant data from a given experiment is available, the scientific world would be better able to evaluate and validate through replication the quality of research much more easily.

I strongly believe that requiring data-sharing and management plans addresses a big challenge of open science: being able to quickly find the right data, as well as access, and apply it. The NIH says, and I agree, that the requirement for data management plans will help make the use of open data faster and more efficient. From the Human Genome Project in the 1990s to the recent, rapid development of tests and vaccines for COVID-19, the benefits of greater openness in science have been borne out.

Will the new requirements be a burden?

At its core, the goal of the new policy is to make science more open and to fight bad science. But as beneficial as the new policy is likely to be, it’s not without costs and shortfalls.

First, replicating a study – even one where the data is already available – still consumes expensive human, computing and material resources. The system of science doesn’t reward the researchers who reproduce an experiment’s results as highly as the ones who originate it. I believe the new policy will improve some aspects of replication, but will only address a few links in the overall chain.

Second are concerns about the increased workload and financial challenges involved in meeting the requirements. Many scientists aren’t used to preparing a detailed plan of what they will collect and how they will share it as a part of asking for funding. This means they may need training for themselves or the support of trained staff to do so.

Part of a global trend toward open science

The NIH isn’t the only federal agency pursuing more open data and science. In 2013, the Obama administration mandated that all agencies with a budget of $100 million or more must provide open access to their publications and data. The National Science Foundation published their first open data policy two years earlier. Many European Union members are crafting national policies on open science – most notably France, which has already published it’s second.

The cultural shift in science that NIH Director Collins mentioned in 2020 has been happening – but for many, like me, who support these efforts, the progress has been painfully slow. I hope that the new NIH open data policy will help this movement gain momentum.

About the Author:

Stephen Jacobs, Professor of Interactive Games and Media, Rochester Institute of Technology

This article is republished from The Conversation under a Creative Commons license. Read the original article.


The cryptocurrency market digest (BTC, ETH, SHIB). Overview for 28.03.2022

Article By RoboForex.com

Thanks for great news, BTC! The leading cryptocurrency reached all the set goals, stepped over an extremely important threshold of $46,000, and is trading at $47,024 today. What is next? Technically, the nearest resistance is at $48,300, and this is a serious obstacle that prevents buyers from easily reaching $51,000.

The reason for the growth was an increase in bullish activity in the US stock market. As you remember, there is a correlation between the BTC and the Nasdaq index. If US investors continue buying – and there is not much that can prevent them from it now – the crypto will only win.

This week, volatility can be high. Market participants will keep an eye on the US employment market and speeches of monetary politicians from the Fed and Federal Reserve Bank. As long as many people are waiting for an increase in the interest rate by 50 basis points in May, as mentioned by the head of the Fed Jerome Powell, this topic will be raised at any time possible.

Bitcoin chart online

ETH: aiming at $3,500

The key altcoin successfully reached the interim goals of growth. On Monday, it is trading at $3,333, breaking through the resistance level of $3,130. Now the goals of growth are at $3,500. However, in the way of this growth, the ETH might face a technical correction.

Ethereum chart online

Shiba Inu: the number of fans shrinks

Over the last 10 days, the number of people holding Shiba Inu coins dropped by almost 5%, which is roughly 60 thousand people. According to Coinmarketcap, 1,138,243 addresses are now holding the meme coin. Activity in the network is also falling. It looks like users are waiting and heating up the coin.

Rio de Janeiro: a step forward

Starting 2023, the city of Rio de Janeiro (Brazil) will accept the BTC for paying taxes for city real estate. The authorities are planning to stimulate the use of crypto. In the future, the BTC is going to be accepted in, say, taxis.

BlackRock: digital currencies will profit from crisis/h2>

Larry Fink, the head of one of the largest asset management funds BlackRock, thinks that the global geopolitical crisis heats up interest in digital assets. The current situation demonstrates that cryptocurrencies can be a perfect instrument for international transactions. Fink claims that in the nearest future, countries will reassess their currency dependencies and, in the end, give room for digital payments.

Article By RoboForex.com

Attention!
Forecasts presented in this section only reflect the author’s private opinion and should not be considered as guidance for trading. RoboForex LP bears no responsibility for trading results based on trading recommendations described in these analytical reviews.

Ichimoku Cloud Analysis 28.03.2022 (EURUSD, CADCHF, USDCHF)

Article By RoboForex.com

EURUSD, “Euro vs US Dollar”

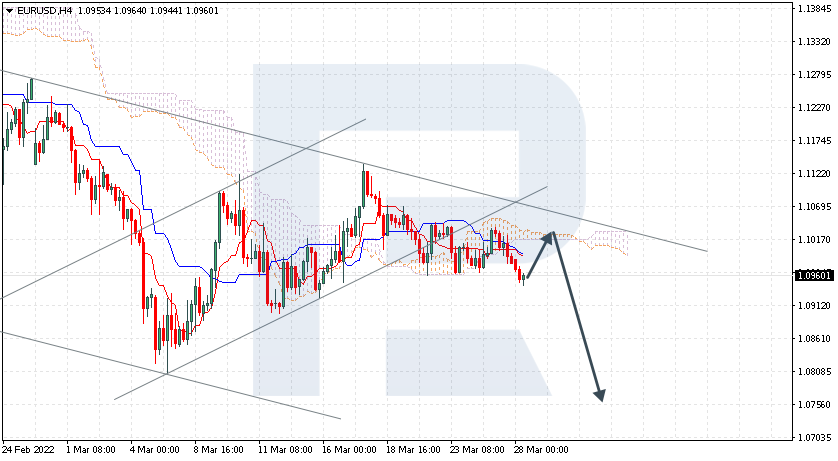
EURUSD is trading at 1.0960; the instrument is moving below Ichimoku Cloud, thus indicating a descending tendency. The markets could indicate that the price may test the cloud’s upside border at 1.1020 and then resume moving downwards to reach 1.0755. Another signal in favour of a further downtrend will be a rebound from the descending channel’s upside border. However, the bullish scenario may no longer be valid if the price breaks the cloud’s upside border and fixes above 1.1070. In this case, the pair may continue growing towards 1.1165.

EURUSD
Risk Warning: the result of previous trading operations do not guarantee the same results in the future

CADCHF, “Canadian Dollar vs Swiss Franc”

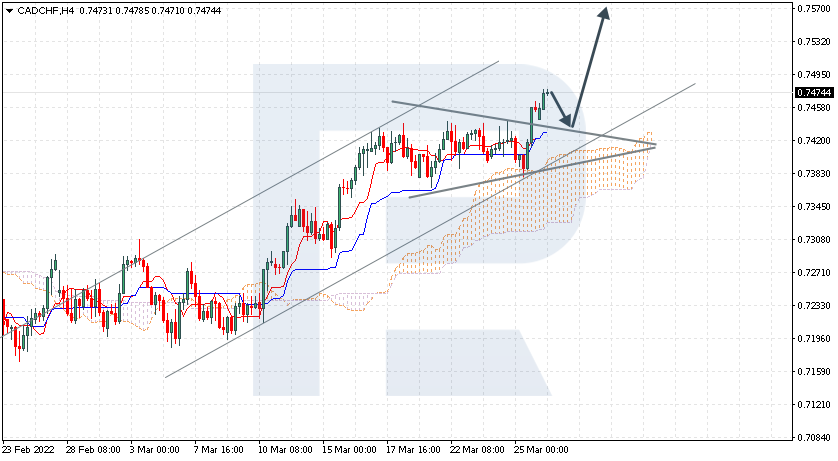
CADCHF is trading at 0.7474; the instrument is moving above Ichimoku Cloud, thus indicating an ascending tendency. The markets could indicate that the price may test Tenkan-Sen and Kijun-Sen at 0.7440 and then resume moving upwards to reach 0.7570. Another signal in favour of a further uptrend will be a rebound from the upside border of the Triangle pattern. However, the bullish scenario may no longer be valid if the price breaks the cloud’s downside border and fixes below 0.7295. In this case, the pair may continue falling towards 0.7205.

CADCHF
Risk Warning: the result of previous trading operations do not guarantee the same results in the future

USDCHF, “US Dollar vs Swiss Franc”

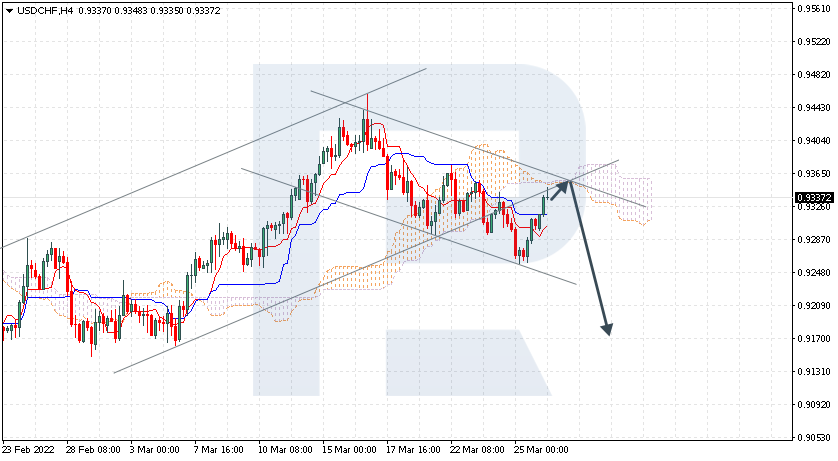
USDCHF is trading at 0.9337; the instrument is moving below Ichimoku Cloud, thus indicating a descending tendency. The markets could indicate that the price may test the cloud’s downside border at 0.9345 and then resume moving downwards to reach 0.9170. Another signal in favour of a further downtrend will be a rebound from the rising channel’s downside border. However, the bearish scenario may no longer be valid if the price breaks the cloud’s upside border and fixes above 0.9405. In this case, the pair may continue growing towards 0.9500.

USDCHF

Article By RoboForex.com

Attention!
Forecasts presented in this section only reflect the author’s private opinion and should not be considered as guidance for trading. RoboForex LP bears no responsibility for trading results based on trading recommendations described in these analytical reviews.

The Analytical Overview of the Main Currency Pairs on 2022.03.28

by JustForex

The EUR/USD currency pair

Technical indicators of the currency pair:
  • Prev Open: 1.0998
  • Prev Close: 1.0983
  • % chg. over the last day: -0.06%

A split is brewing inside the European Union, with some countries refusing to pay Russia for energy resources in rubles. So far, countries that are extremely dependent on Russian oil and gas are considering this possibility. This situation negatively affects the national currency of the Eurozone. In its turn, Fed policy tightening will contribute to the growth of the dollar index, which is also negative for the Euro.

Trading recommendations
  • Support levels: 1.0917, 1.0887, 1.0823, 1.0633
  • Resistance levels: 1.0963, 1.1007, 1.1037 1.1079, 1.1112, 1.1291

From the technical point of view, the trend on the EUR/USD currency pair on the hourly time frame is still bearish. The MACD indicator is negative again. The sellers’ pressure has increased. Under such market conditions, it is better to look for sell trades on the intraday time frames from the resistance level of 1.1007. Buy trades should be considered from the support level of 1.0917, but only with short targets.

Alternative scenario: if the price breaks out through the 1.1037 resistance level and fixes above, the mid-term uptrend will likely resume.

EUR/USD
There is no news feed for today.

The GBP/USD currency pair

Technical indicators of the currency pair:
  • Prev Open: 1.3183
  • Prev Close: 1.3180
  • % chg. over the last day: -0.02%

The fundamental picture for the GBP/USD currency pair looks uncertain. On the one hand, the tightening of the US Fed’s policy will help strengthen the dollar. On the other hand, the Bank of England is also raising interest rates to fight inflation, which will support the British currency. There is a third factor – the rise in Brent oil prices also contributes to the pound’s strengthening.

Trading recommendations
  • Support levels: 1.3140, 1.3074, 1.3015, 1.2989, 1.2863
  • Resistance levels: 1.3168, 1.3244, 1.3274

On the hourly time frame, the GBP/USD currency pair trend is bullish. The price has corrected to a strong support level, opening good opportunities to look for trades. But the MACD indicator has turned negative, the sellers’ pressure has increased. Under such market conditions, buy deals should be considered from the support level of 1.3140, but better with confirmation. For sell deals, it is better to consider the resistance level of 1.3244, but only with short targets.

Alternative scenario: if the price breaks down through the 1.3074 support level and fixes below, the mid-term uptrend will likely be broken.

GBP/USD
News feed for 2022.03.28:
  • – UK BoE Gov Bailey’s Speech at 14:00 (GMT+3).

The USD/JPY currency pair

Technical indicators of the currency pair:
  • Prev Open: 122.32
  • Prev Close: 122.08
  • % chg. over the last day: -0.19%

The upward trend on the USD/JPY currency pair continues. The Central Bank of Japan continues to actively stimulate the economy with “cheap” money, which allows the Japanese economy to maintain a stable growth trajectory, as evidenced by the growth of the Nikkei 225 Index (JP225) over the past two weeks. However, this policy harms the national currency. Given that the US Fed plans to raise the interest rates more aggressively at the next meetings, this situation favours the continued growth of USD/JPY quotes in the mid-term prospect.

Trading recommendations
  • Support levels: 122.37, 121.27, 120.78, 119.96, 119.52, 118.58, 118.06
  • Resistance levels: 123.73

The medium-term trend on the USD/JPY currency pair is bullish. The price breaks through the resistance levels without significant corrections. The lesser the pullbacks, the bigger and faster will be the fall on the corrective movement. The MACD indicator is in the positive zone. There are signs of overbought and divergence on several time frames. Under such market conditions, it is best to look for buy deals after a pullback, as the price has strongly deviated from the moving averages. A support level of 122.37 would be the best, but with additional confirmation. The resistance level of 123.73 can be considered for sell deals, but only after the sellers’ initiative.

Alternative scenario: if the price fixes below 120.89, the uptrend will likely be broken.

USD/JPY
There is no news feed for today.

The USD/CAD currency pair

Technical indicators of the currency pair:
  • Prev Open: 1.2524
  • Prev Close: 1.2576
  • % chg. over the last day: -0.38%

The Canadian dollar is a commodity currency, so it is highly dependent not only on the monetary policy of the Bank of Canada but also on the oil prices and the dollar index. Last week, oil prices fell slightly, and the dollar index rose, but this did not significantly impact the downtrend of the USD/CAD pair. This means that the Canadian dollar is now also strengthening thanks to the monetary policy of the Bank of Canada, which plans to raise interest rates soon.

Trading recommendations
  • Support levels: 1.2453
  • Resistance levels: 1.2537, 1.2591, 1.2655, 1.2713, 1.2754, 1.2851

In terms of technical analysis, the USD/CAD currency pair trend is bearish. The price has reached the daily support level. The MACD indicator is in the negative zone. There are signs of divergence on several timeframes. It is worth trading only with short targets because on the USD/CAD currency pair fundamentally, there are no prerequisites for a medium-term trend, as the dollar index also has the support of the Fed in the medium term. Under such market conditions, it is better to look for buy trades on the lower time frames from the support level of 1.2453, but it is better with additional confirmation. For sell deals, it is better to consider the resistance level of 1.2537.

Alternative scenario: if the price breaks through and consolidates above 1.2654, the downtrend will likely be broken.

USD/CAD
There is no news feed for today.

by JustForex


This article reflects a personal opinion and should not be interpreted as an investment advice, and/or offer, and/or a persistent request for carrying out financial transactions, and/or a guarantee, and/or a forecast of future events.

Financial markets uncertainty lingers as the war in Ukraine continues for the second month

by JustForex

The US stock market traded inconsistently last week. By the close of the stock market on Friday, Dow Jones (US30) gained 0.44% (+0.55% for the week), S&P 500 (US500) added 0.51% (+1.81% for the week). The NASDAQ Technology Index (US100) decreased by 0.16% on Friday but became the growth leader by the end of the week with +2.23%.

According to analysts at Bank of America, the stock market is likely to rise for several more weeks and provide investors with a good opportunity for a sell-off. Tightening monetary policy to combat high inflation and lower corporate earnings growth is likely to lead to a corrective movement in stock indices this year, so investors should rebalance their portfolios while they can.

Major European indices traded without a single dynamic on Friday. German DAX (DE30) gained 0.22% on Friday (-0.56% for the week), French CAC 40 (FR 40) decreased by 0.03% (-0.83% for the week), Spanish IBEX 35 (ES35) added 0.31% (-1.08% for the week) and British FTSE 100 (UK100) jumped by 0.21% (+1.06% for the week). Chancellor Olaf Scholz said Germany hopes to become independent of Russian oil and coal imports this year. However, analysts are skeptical about these statements since the German economy is heavily dependent on Russian energy resources, and it is extremely difficult to replace them in the short term.

Ukraine is ready to become neutral as part of a peace agreement, President Vladimir Zelensky said Sunday. Terrorist country Russia continues to kill civilians, women, and children and is unwilling to make any concessions. The US President Joe Biden called Vladimir Putin a “butcher.” Kirill Budanov, head of Military Intelligence Service of Ukraine, said that Russian “butcher” Vladimir Putin seeks to capture eastern Ukraine. After more than four weeks of conflict, Russia failed to capture any major Ukrainian city, so Russia decided to focus on the southeast. The local leader of the self-proclaimed Luhansk People’s Republic said on Sunday that the region could soon hold a referendum on joining Russia, as happened in Crimea after Russia seized the Ukrainian peninsula in 2014. But the whole world knows perfectly well that this referendum has no legitimacy and will not be recognized by the international community. The next stage of negotiations between Ukraine and Russia will take place in Turkey today.

Rising US Treasury yields led gold prices to fall on Friday, although the yellow metal maintained a weekly gain of more than 1% amid geopolitical tensions caused by the war in Ukraine and concerns about inflation. Gold usually rises amid heightened political and economic concerns, and the war in Ukraine and rampant price pressures in the US fueling both.

On Friday, a rocket attack on an oil depot in Jeddah, Saudi Arabia, sent oil prices up more than 1 %. Yemeni Hussein rebels claimed responsibility for the attack. Saudi Arabia has warned that it cannot be held responsible for a shortage of oil supplies on world markets in light of the ongoing attacks on its facilities. But analysts are confident that Saudi Arabia did was not going to significantly increase oil production since the war in Ukraine led to an increase in oil prices, which benefits Saudi Arabia. Attacks on the facilities have given them the best excuse not to add a single barrel beyond what they were producing.

Many analysts believe the US would be right to demand that Iran force the Tehran-sponsored Yemeni Hussein rebels to abandon any further aggression against Saudi Arabia and its energy facilities if the Islamic Republic is willing to strike a nuclear deal.

The United Arab Emirates will increase gas production by 30% to boost liquefied natural gas (LNG) supplies.

Asian markets mostly rallied last week. Japan’s Nikkei 225 (JP225) gained 5.63% over the week, Hong Kong’s Hang Seng (HK50) decreased by 1.92% and Australia’s S&P/ASX 200 (AU200) added +1.53%.

The war in Ukraine and Russia’s de facto exclusion from the global monetary system could allow China to raise the profile of its currency by challenging the US dollar, a senior Taiwanese security official said Monday. Chen Mintong, director general of the National Security Bureau, said China has always wanted to get rid of the dominance of the US dollar, and a war in Ukraine could encourage the use of the yuan. But on the other hand, if China decides to side with the United States, it would greatly improve Sino-US relations.

Main market quotes:

S&P 500 (F) (US500) 4,543.06 +22.90 (+0.51%)

Dow Jones (US30) 34,861.24 +153.30 (+0.44%)

DAX (DE40) 14,305.76 +31.97 (+0.22%)

FTSE 100 (UK100) 7,483.35 +15.97 (+0.21%)

USD Index 98.84 +0.05 (+0.05%)

Important events for today:
  • – UK BoE Gov Bailey’s Speech at 14:00 (GMT+3).

by JustForex


This article reflects a personal opinion and should not be interpreted as an investment advice, and/or offer, and/or a persistent request for carrying out financial transactions, and/or a guarantee, and/or a forecast of future events.

Large Currency Speculators sharply cut back on Canadian dollar bets

By InvestMacro | COT | Data Tables | COT Leaders | Downloads | COT Newsletter

Here are the latest charts and statistics for the Commitment of Traders (COT) data published by the Commodities Futures Trading Commission (CFTC).

The latest COT data is updated through Tuesday March 22nd and shows a quick view of how large traders (for-profit speculators and commercial entities) were positioned in the futures markets. All currency positions are in direct relation to the US dollar where, for example, a bet for the euro is a bet that the euro will rise versus the dollar while a bet against the euro will be a bet that the euro will decline versus the dollar.

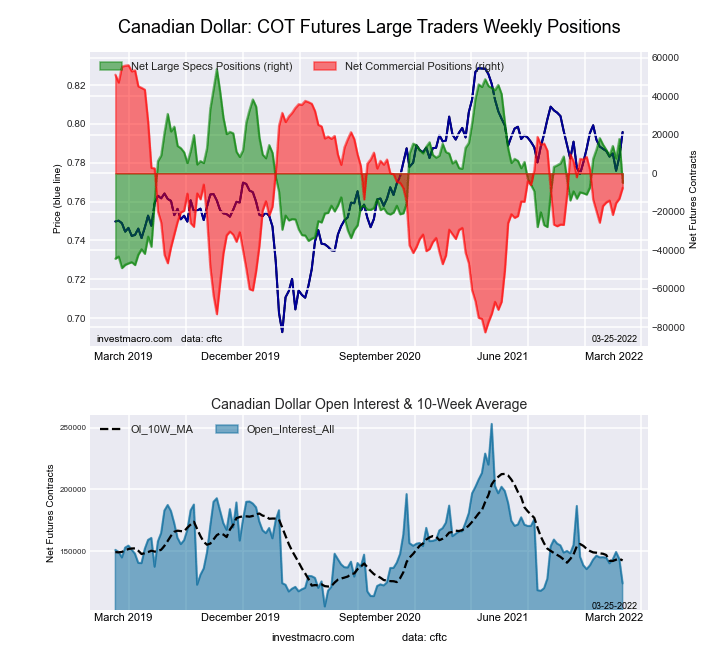
Highlighting the COT currency data was the sharp pullback in the Canadian dollar currency futures contracts. Canadian dollar speculators cut back on their bullish bets by a total of -22,680 contracts, the largest change among currencies this week and one week after CAD saw bullish bets rise by over +10,000 contracts (bringing the speculator standing to a six-week high). This week’s decline dropped the total net speculator standing back into bearish territory (-4,940 contracts) for the first time in the past ten weeks, dating back to January 11th. The major commodity currencies (Canadian dollar, Australian dollar and New Zealand dollar) all saw pullbacks in their speculator bets this week after strong rises last week.

The only currency markets with higher speculator bets this week were the US Dollar Index (1,255 contracts) and the Euro (5,049 contracts).

The currencies with declining bets were the Japanese yen (-16,142 contracts), Brazil real (-2,599 contracts), Swiss franc (-3,195 contracts), British pound sterling (-8,183 contracts), New Zealand dollar (-1,133 contracts), Canadian dollar (-22,680 contracts), Russian ruble (-263 contracts) and Bitcoin (-190 contracts).


Data Snapshot of Forex Market Traders | Columns Legend
Mar-22-2022OIOI-IndexSpec-NetSpec-IndexCom-NetCOM-IndexSmalls-NetSmalls-Index
USD Index51,9527229,63577-33,521193,88659
EUR658,8176623,84342-46,3786322,53512
GBP195,71236-37,2444750,39059-13,14628
JPY248,22187-78,48218104,79088-26,3080
CHF44,91121-8,4245520,49954-12,07528
CAD124,09013-4,94043-7,5655412,50555
AUD127,76728-51,1893748,388552,80159
NZD35,256152,52075-2,06927-45147
MXN134,76619-18,0512013,919794,13261
RUB20,93047,54331-7,15069-39324
BRL70,8326841,56491-44,46382,899100
Bitcoin11,27461094-481048124


US Dollar Index Futures:

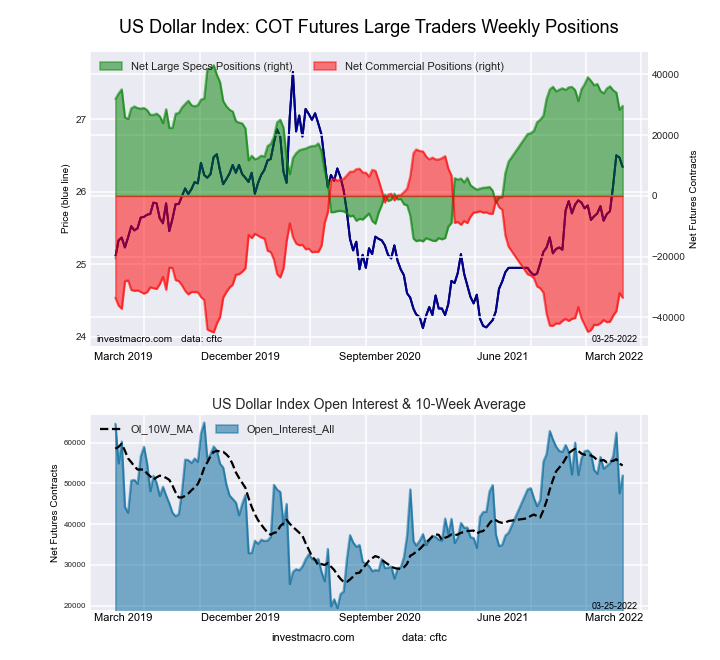
US Dollar Index Forex Futures COT ChartThe US Dollar Index large speculator standing this week resulted in a net position of 29,635 contracts in the data reported through Tuesday. This was a weekly lift of 1,255 contracts from the previous week which had a total of 28,380 net contracts.

This week’s current strength score (the trader positioning range over the past three years, measured from 0 to 100) shows the speculators are currently Bullish with a score of 76.9 percent. The commercials are Bearish-Extreme with a score of 18.9 percent and the small traders (not shown in chart) are Bullish with a score of 59.0 percent.

US DOLLAR INDEX StatisticsSPECULATORSCOMMERCIALSSMALL TRADERS
– Percent of Open Interest Longs:83.83.210.5
– Percent of Open Interest Shorts:26.867.73.0
– Net Position:29,635-33,5213,886
– Gross Longs:43,5611,6655,434
– Gross Shorts:13,92635,1861,548
– Long to Short Ratio:3.1 to 10.0 to 13.5 to 1
NET POSITION TREND:
– Strength Index Score (3 Year Range Pct):76.918.959.0
– Strength Index Reading (3 Year Range):BullishBearish-ExtremeBullish
NET POSITION MOVEMENT INDEX:
– 6-Week Change in Strength Index:-7.112.1-34.7


Euro Currency Futures:

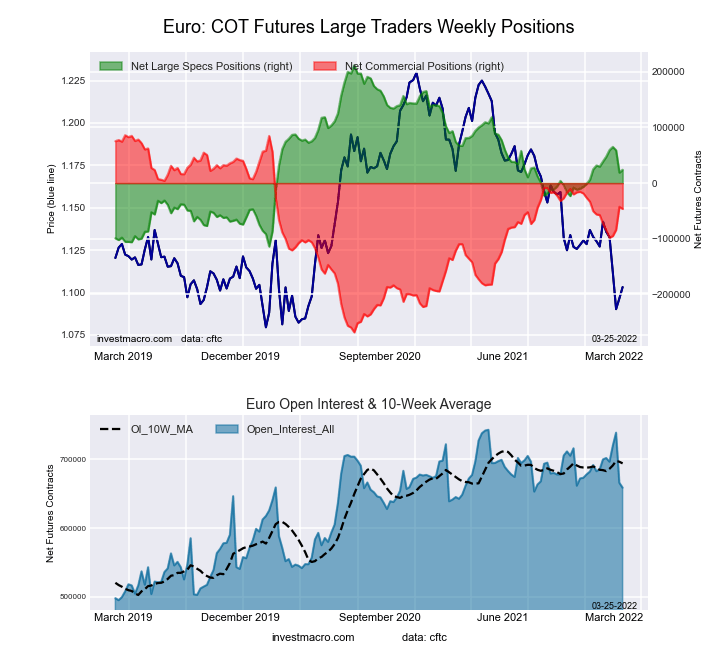
Euro Currency Futures COT ChartThe Euro Currency large speculator standing this week resulted in a net position of 23,843 contracts in the data reported through Tuesday. This was a weekly boost of 5,049 contracts from the previous week which had a total of 18,794 net contracts.

This week’s current strength score (the trader positioning range over the past three years, measured from 0 to 100) shows the speculators are currently Bearish with a score of 42.3 percent. The commercials are Bullish with a score of 62.6 percent and the small traders (not shown in chart) are Bearish-Extreme with a score of 11.7 percent.

EURO Currency StatisticsSPECULATORSCOMMERCIALSSMALL TRADERS
– Percent of Open Interest Longs:31.454.311.5
– Percent of Open Interest Shorts:27.861.38.1
– Net Position:23,843-46,37822,535
– Gross Longs:207,051357,49275,970
– Gross Shorts:183,208403,87053,435
– Long to Short Ratio:1.1 to 10.9 to 11.4 to 1
NET POSITION TREND:
– Strength Index Score (3 Year Range Pct):42.362.611.7
– Strength Index Reading (3 Year Range):BearishBullishBearish-Extreme
NET POSITION MOVEMENT INDEX:
– 6-Week Change in Strength Index:-4.67.6-19.7


British Pound Sterling Futures:

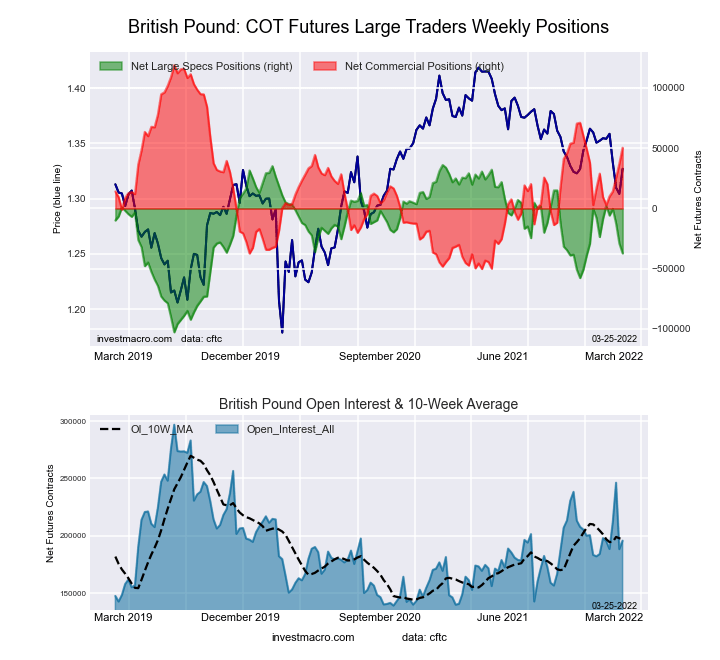
British Pound Sterling Futures COT ChartThe British Pound Sterling large speculator standing this week resulted in a net position of -37,244 contracts in the data reported through Tuesday. This was a weekly fall of -8,183 contracts from the previous week which had a total of -29,061 net contracts.

This week’s current strength score (the trader positioning range over the past three years, measured from 0 to 100) shows the speculators are currently Bearish with a score of 47.2 percent. The commercials are Bullish with a score of 59.5 percent and the small traders (not shown in chart) are Bearish with a score of 28.4 percent.

BRITISH POUND StatisticsSPECULATORSCOMMERCIALSSMALL TRADERS
– Percent of Open Interest Longs:16.770.49.9
– Percent of Open Interest Shorts:35.844.716.6
– Net Position:-37,24450,390-13,146
– Gross Longs:32,753137,82919,316
– Gross Shorts:69,99787,43932,462
– Long to Short Ratio:0.5 to 11.6 to 10.6 to 1
NET POSITION TREND:
– Strength Index Score (3 Year Range Pct):47.259.528.4
– Strength Index Reading (3 Year Range):BearishBullishBearish
NET POSITION MOVEMENT INDEX:
– 6-Week Change in Strength Index:-20.724.3-25.6


Japanese Yen Futures:

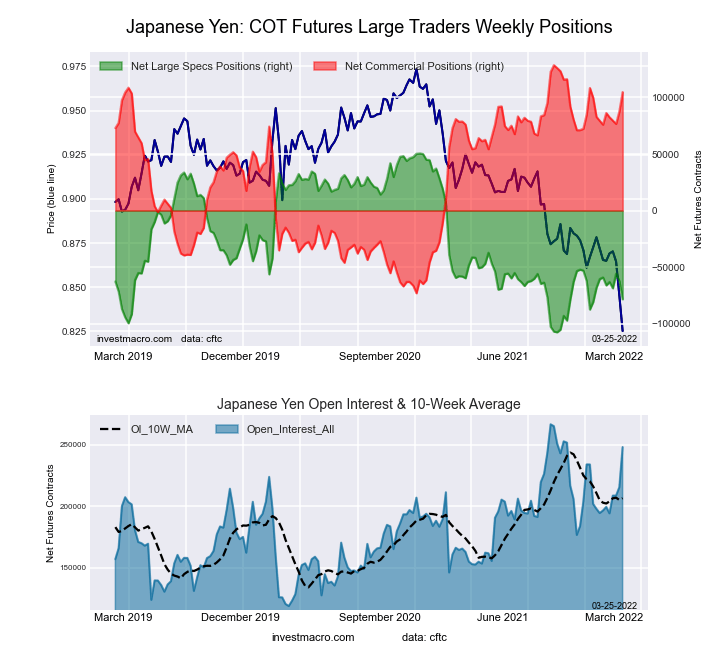
Japanese Yen Forex Futures COT ChartThe Japanese Yen large speculator standing this week resulted in a net position of -78,482 contracts in the data reported through Tuesday. This was a weekly fall of -16,142 contracts from the previous week which had a total of -62,340 net contracts.

This week’s current strength score (the trader positioning range over the past three years, measured from 0 to 100) shows the speculators are currently Bearish-Extreme with a score of 18.4 percent. The commercials are Bullish-Extreme with a score of 88.2 percent and the small traders (not shown in chart) are Bearish-Extreme with a score of 0.0 percent.

JAPANESE YEN StatisticsSPECULATORSCOMMERCIALSSMALL TRADERS
– Percent of Open Interest Longs:14.876.27.2
– Percent of Open Interest Shorts:46.434.017.7
– Net Position:-78,482104,790-26,308
– Gross Longs:36,676189,10017,749
– Gross Shorts:115,15884,31044,057
– Long to Short Ratio:0.3 to 12.2 to 10.4 to 1
NET POSITION TREND:
– Strength Index Score (3 Year Range Pct):18.488.20.0
– Strength Index Reading (3 Year Range):Bearish-ExtremeBullish-ExtremeBearish-Extreme
NET POSITION MOVEMENT INDEX:
– 6-Week Change in Strength Index:-12.214.3-19.3


Swiss Franc Futures:

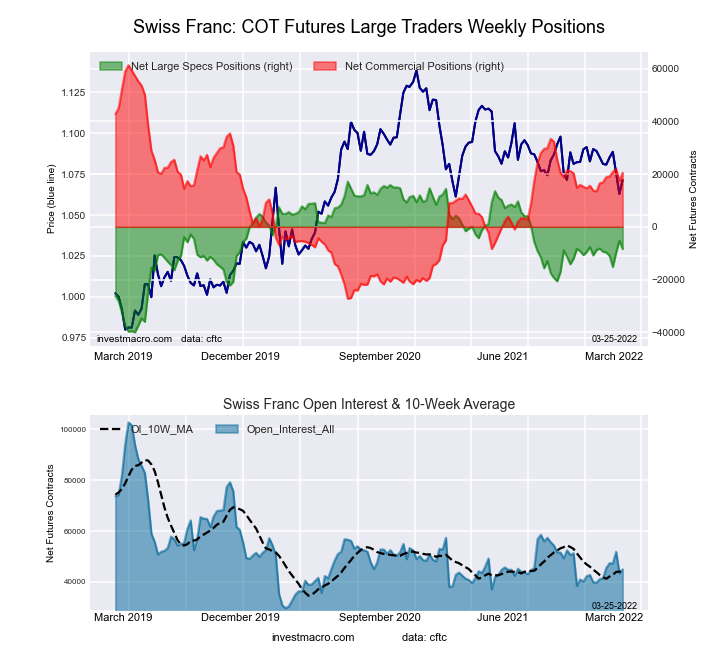
Swiss Franc Forex Futures COT ChartThe Swiss Franc large speculator standing this week resulted in a net position of -8,424 contracts in the data reported through Tuesday. This was a weekly lowering of -3,195 contracts from the previous week which had a total of -5,229 net contracts.

This week’s current strength score (the trader positioning range over the past three years, measured from 0 to 100) shows the speculators are currently Bullish with a score of 55.2 percent. The commercials are Bullish with a score of 53.9 percent and the small traders (not shown in chart) are Bearish with a score of 27.9 percent.

SWISS FRANC StatisticsSPECULATORSCOMMERCIALSSMALL TRADERS
– Percent of Open Interest Longs:13.468.318.1
– Percent of Open Interest Shorts:32.122.645.0
– Net Position:-8,42420,499-12,075
– Gross Longs:6,01230,6638,143
– Gross Shorts:14,43610,16420,218
– Long to Short Ratio:0.4 to 13.0 to 10.4 to 1
NET POSITION TREND:
– Strength Index Score (3 Year Range Pct):55.253.927.9
– Strength Index Reading (3 Year Range):BullishBullishBearish
NET POSITION MOVEMENT INDEX:
– 6-Week Change in Strength Index:1.74.0-13.4


Canadian Dollar Futures:

Canadian Dollar Forex Futures COT ChartThe Canadian Dollar large speculator standing this week resulted in a net position of -4,940 contracts in the data reported through Tuesday. This was a weekly lowering of -22,680 contracts from the previous week which had a total of 17,740 net contracts.

This week’s current strength score (the trader positioning range over the past three years, measured from 0 to 100) shows the speculators are currently Bearish with a score of 42.9 percent. The commercials are Bullish with a score of 54.1 percent and the small traders (not shown in chart) are Bullish with a score of 54.7 percent.

CANADIAN DOLLAR StatisticsSPECULATORSCOMMERCIALSSMALL TRADERS
– Percent of Open Interest Longs:23.647.826.9
– Percent of Open Interest Shorts:27.653.916.8
– Net Position:-4,940-7,56512,505
– Gross Longs:29,31459,26933,406
– Gross Shorts:34,25466,83420,901
– Long to Short Ratio:0.9 to 10.9 to 11.6 to 1
NET POSITION TREND:
– Strength Index Score (3 Year Range Pct):42.954.154.7
– Strength Index Reading (3 Year Range):BearishBullishBullish
NET POSITION MOVEMENT INDEX:
– 6-Week Change in Strength Index:-19.26.820.8


Australian Dollar Futures:

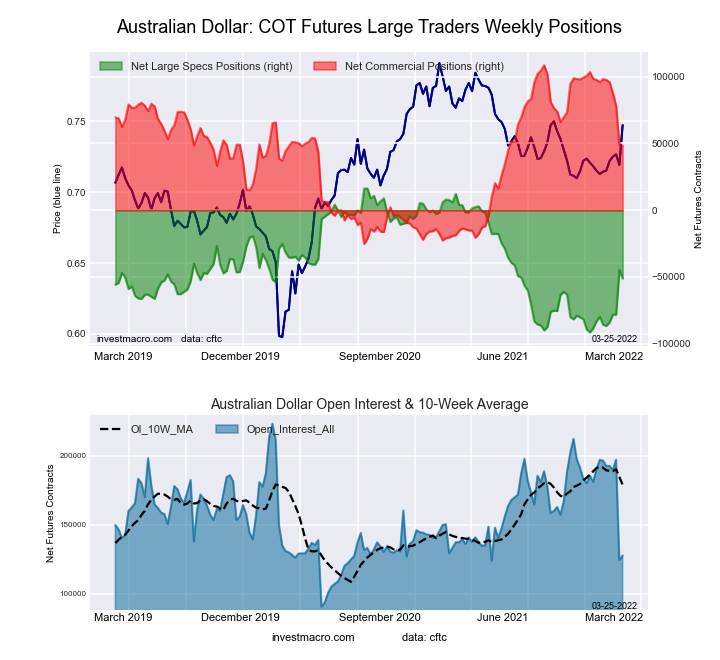
Australian Dollar Forex Futures COT ChartThe Australian Dollar large speculator standing this week resulted in a net position of -51,189 contracts in the data reported through Tuesday. This was a weekly decline of -6,333 contracts from the previous week which had a total of -44,856 net contracts.

This week’s current strength score (the trader positioning range over the past three years, measured from 0 to 100) shows the speculators are currently Bearish with a score of 37.4 percent. The commercials are Bullish with a score of 55.0 percent and the small traders (not shown in chart) are Bullish with a score of 59.3 percent.

AUSTRALIAN DOLLAR StatisticsSPECULATORSCOMMERCIALSSMALL TRADERS
– Percent of Open Interest Longs:18.659.420.0
– Percent of Open Interest Shorts:58.721.517.8
– Net Position:-51,18948,3882,801
– Gross Longs:23,74775,91625,508
– Gross Shorts:74,93627,52822,707
– Long to Short Ratio:0.3 to 12.8 to 11.1 to 1
NET POSITION TREND:
– Strength Index Score (3 Year Range Pct):37.455.059.3
– Strength Index Reading (3 Year Range):BearishBullishBullish
NET POSITION MOVEMENT INDEX:
– 6-Week Change in Strength Index:32.0-37.337.6


New Zealand Dollar Futures:

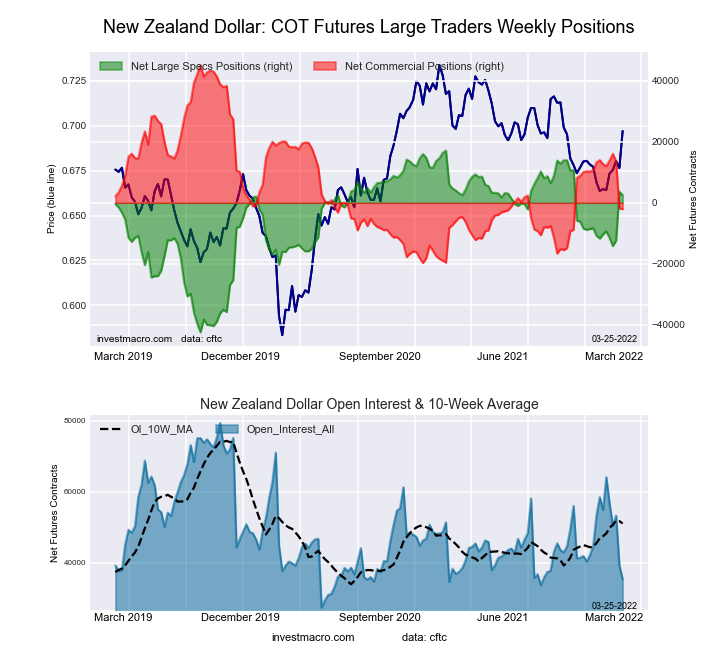
New Zealand Dollar Forex Futures COT ChartThe New Zealand Dollar large speculator standing this week resulted in a net position of 2,520 contracts in the data reported through Tuesday. This was a weekly fall of -1,133 contracts from the previous week which had a total of 3,653 net contracts.

This week’s current strength score (the trader positioning range over the past three years, measured from 0 to 100) shows the speculators are currently Bullish with a score of 75.5 percent. The commercials are Bearish with a score of 27.2 percent and the small traders (not shown in chart) are Bearish with a score of 46.7 percent.

NEW ZEALAND DOLLAR StatisticsSPECULATORSCOMMERCIALSSMALL TRADERS
– Percent of Open Interest Longs:48.740.49.5
– Percent of Open Interest Shorts:41.546.210.7
– Net Position:2,520-2,069-451
– Gross Longs:17,15614,2273,339
– Gross Shorts:14,63616,2963,790
– Long to Short Ratio:1.2 to 10.9 to 10.9 to 1
NET POSITION TREND:
– Strength Index Score (3 Year Range Pct):75.527.246.7
– Strength Index Reading (3 Year Range):BullishBearishBearish
NET POSITION MOVEMENT INDEX:
– 6-Week Change in Strength Index:21.6-22.821.9


Mexican Peso Futures:

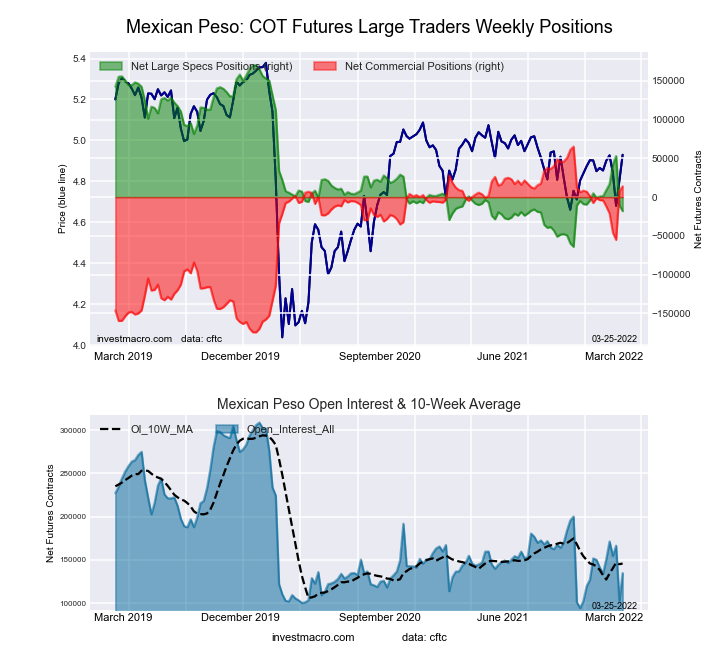
Mexican Peso Futures COT ChartThe Mexican Peso large speculator standing this week resulted in a net position of -18,051 contracts in the data reported through Tuesday. This was a weekly reduction of -7,475 contracts from the previous week which had a total of -10,576 net contracts.

This week’s current strength score (the trader positioning range over the past three years, measured from 0 to 100) shows the speculators are currently Bearish-Extreme with a score of 19.6 percent. The commercials are Bullish with a score of 78.6 percent and the small traders (not shown in chart) are Bullish with a score of 60.5 percent.

MEXICAN PESO StatisticsSPECULATORSCOMMERCIALSSMALL TRADERS
– Percent of Open Interest Longs:43.151.15.1
– Percent of Open Interest Shorts:56.540.82.0
– Net Position:-18,05113,9194,132
– Gross Longs:58,15068,8806,851
– Gross Shorts:76,20154,9612,719
– Long to Short Ratio:0.8 to 11.3 to 12.5 to 1
NET POSITION TREND:
– Strength Index Score (3 Year Range Pct):19.678.660.5
– Strength Index Reading (3 Year Range):Bearish-ExtremeBullishBullish
NET POSITION MOVEMENT INDEX:
– 6-Week Change in Strength Index:-8.27.55.5


Brazilian Real Futures:

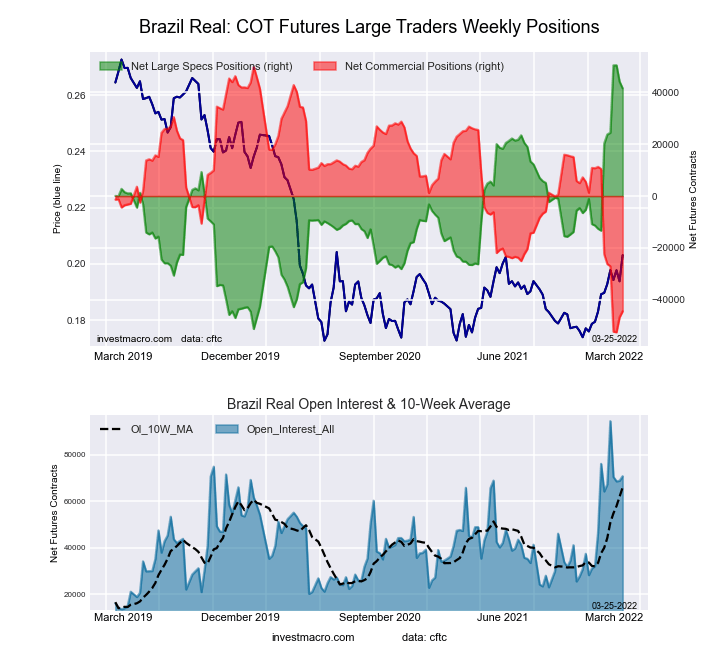
Brazil Real Futures COT ChartThe Brazilian Real large speculator standing this week resulted in a net position of 41,564 contracts in the data reported through Tuesday. This was a weekly fall of -2,599 contracts from the previous week which had a total of 44,163 net contracts.

This week’s current strength score (the trader positioning range over the past three years, measured from 0 to 100) shows the speculators are currently Bullish-Extreme with a score of 91.2 percent. The commercials are Bearish-Extreme with a score of 7.9 percent and the small traders (not shown in chart) are Bullish-Extreme with a score of 100.0 percent.

BRAZIL REAL StatisticsSPECULATORSCOMMERCIALSSMALL TRADERS
– Percent of Open Interest Longs:77.615.36.8
– Percent of Open Interest Shorts:19.078.12.8
– Net Position:41,564-44,4632,899
– Gross Longs:55,00110,8634,851
– Gross Shorts:13,43755,3261,952
– Long to Short Ratio:4.1 to 10.2 to 12.5 to 1
NET POSITION TREND:
– Strength Index Score (3 Year Range Pct):91.27.9100.0
– Strength Index Reading (3 Year Range):Bullish-ExtremeBearish-ExtremeBullish-Extreme
NET POSITION MOVEMENT INDEX:
– 6-Week Change in Strength Index:20.9-21.58.5


Russian Ruble Futures:

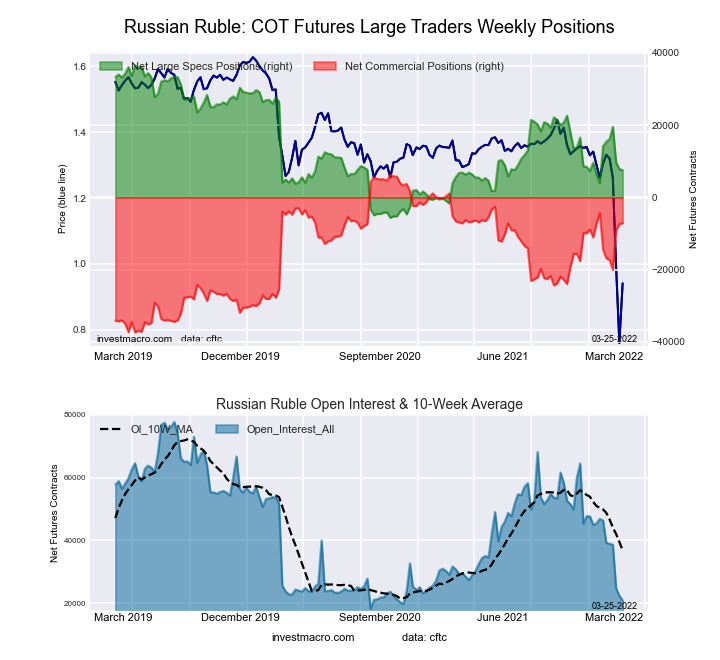
Russian Ruble Futures COT ChartThe Russian Ruble large speculator standing this week resulted in a net position of 7,543 contracts in the data reported through Tuesday. This was a weekly decline of -263 contracts from the previous week which had a total of 7,806 net contracts.

This week’s current strength score (the trader positioning range over the past three years, measured from 0 to 100) shows the speculators are currently Bearish with a score of 31.2 percent. The commercials are Bullish with a score of 69.1 percent and the small traders (not shown in chart) are Bearish with a score of 23.9 percent.

RUSSIAN RUBLE StatisticsSPECULATORSCOMMERCIALSSMALL TRADERS
– Percent of Open Interest Longs:36.660.62.8
– Percent of Open Interest Shorts:0.594.74.7
– Net Position:7,543-7,150-393
– Gross Longs:7,65812,679593
– Gross Shorts:11519,829986
– Long to Short Ratio:66.6 to 10.6 to 10.6 to 1
NET POSITION TREND:
– Strength Index Score (3 Year Range Pct):31.269.123.9
– Strength Index Reading (3 Year Range):BearishBullishBearish
NET POSITION MOVEMENT INDEX:
– 6-Week Change in Strength Index:-15.616.7-18.8


Bitcoin Futures:

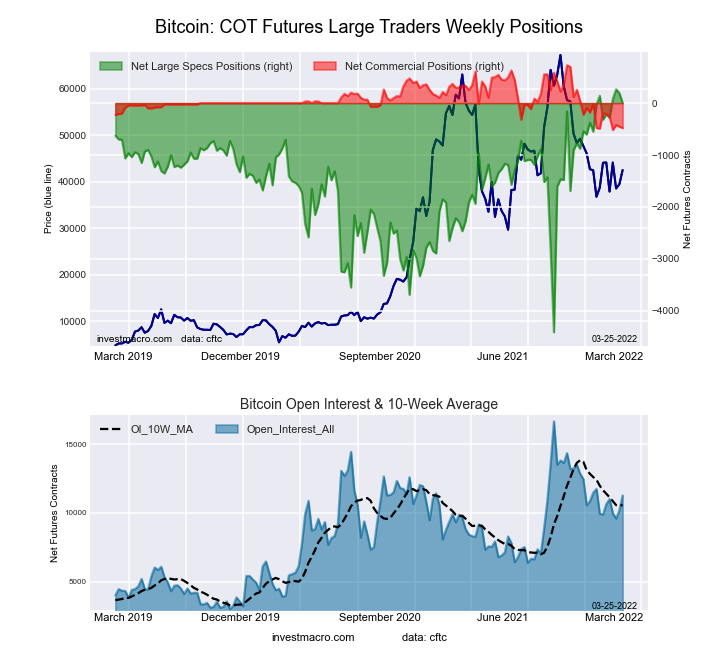
Bitcoin Crypto Futures COT ChartThe Bitcoin large speculator standing this week resulted in a net position of 0 contracts in the data reported through Tuesday. This was a weekly lowering of -190 contracts from the previous week which had a total of 190 net contracts.

This week’s current strength score (the trader positioning range over the past three years, measured from 0 to 100) shows the speculators are currently Bullish-Extreme with a score of 94.3 percent. The commercials are Bearish-Extreme with a score of 2.9 percent and the small traders (not shown in chart) are Bearish with a score of 23.9 percent.

BITCOIN StatisticsSPECULATORSCOMMERCIALSSMALL TRADERS
– Percent of Open Interest Longs:74.72.911.2
– Percent of Open Interest Shorts:74.77.26.9
– Net Position:0-481481
– Gross Longs:8,4253261,263
– Gross Shorts:8,425807782
– Long to Short Ratio:1.0 to 10.4 to 11.6 to 1
NET POSITION TREND:
– Strength Index Score (3 Year Range Pct):94.32.923.9
– Strength Index Reading (3 Year Range):Bullish-ExtremeBearish-ExtremeBearish
NET POSITION MOVEMENT INDEX:
– 6-Week Change in Strength Index:6.8-23.4-0.6


Article By InvestMacroReceive our weekly COT Reports by Email

*COT Report: The COT data, released weekly to the public each Friday, is updated through the most recent Tuesday (data is 3 days old) and shows a quick view of how large speculators or non-commercials (for-profit traders) were positioned in the futures markets.

The CFTC categorizes trader positions according to commercial hedgers (traders who use futures contracts for hedging as part of the business), non-commercials (large traders who speculate to realize trading profits) and nonreportable traders (usually small traders/speculators) as well as their open interest (contracts open in the market at time of reporting).See CFTC criteria here.


Bonds Speculators take a pause on their 10-Year Treasury Notes bearish bets

By InvestMacro | COT | Data Tables | COT Leaders | Downloads | COT Newsletter

Here are the latest charts and statistics for the Commitment of Traders (COT) data published by the Commodities Futures Trading Commission (CFTC).

The latest COT data is updated through Tuesday March 22nd and shows a quick view of how large traders (for-profit speculators and commercial entities) were positioned in the futures markets.

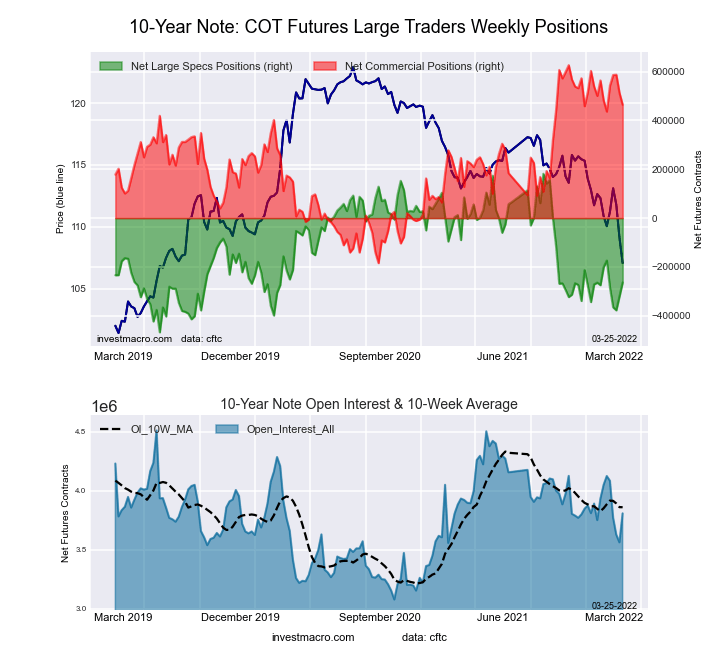
Highlighting the COT bonds data is the pullback in the 10-Year Bond bearish bets this week. The speculative position in the 10-Year Bond has risen for two straight weeks following three straight weeks of declines (or rising bearish bets). The last two week’s rise has shaved off over 113,886 contracts from the total bearish position and brings the current standing to the least bearish level of the past five weeks at a total of -263,834 contracts. The 10-Year has been under pressure like most all bond markets as the Federal Reserve has started raising interest rates with an outlook of more rate increases to come. The 10-Year yield (as bond prices fall, yields rise) has been sharping surging to the upside with the close this week right around the 2.50 percent level, marking its highest yield since May of 2019. The speculator’s 10-Year bond pullback this week will likely be short-lived and it will be interesting to see if this latest bout of inflation, growth and central bank rate rises will be enough to finally break the multi-decade bull market for bonds.

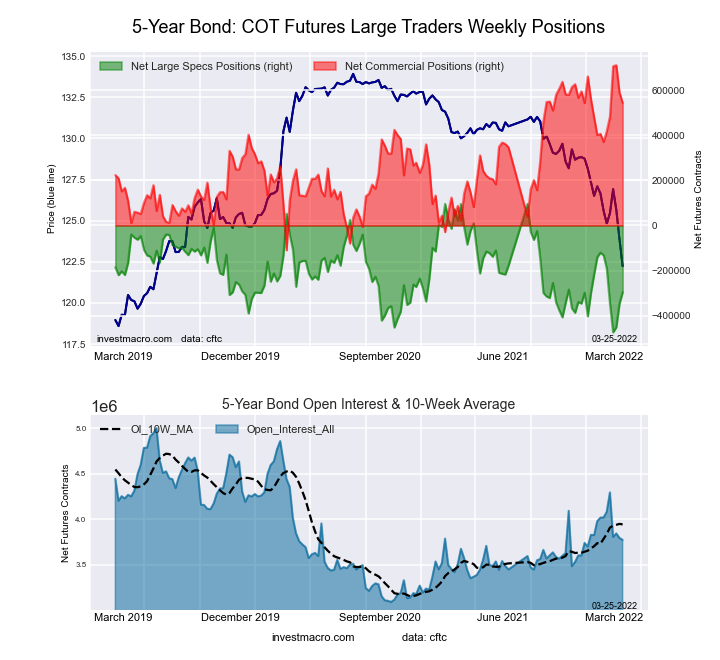
The bond markets with higher speculator bets were the 10-Year Bond (57,163 contracts), Fed Funds (91,899 contracts) and the 5-Year Bond (50,964 contracts).

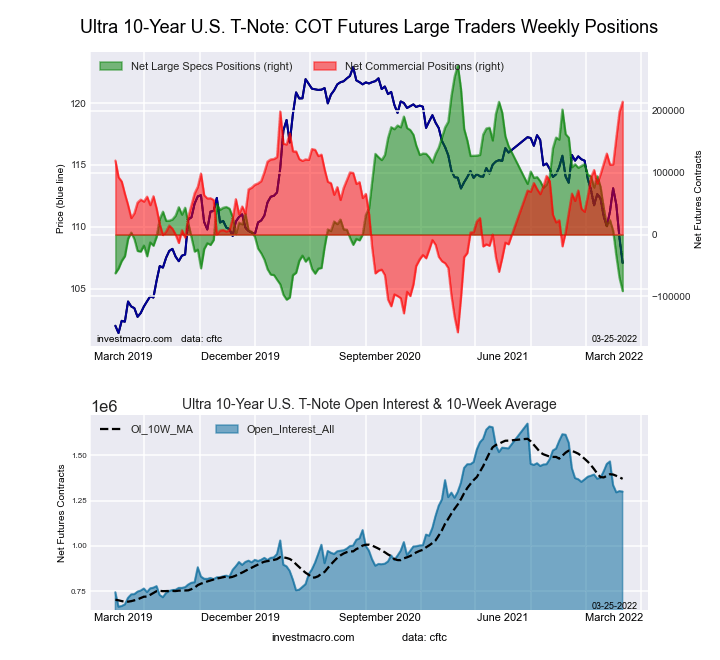
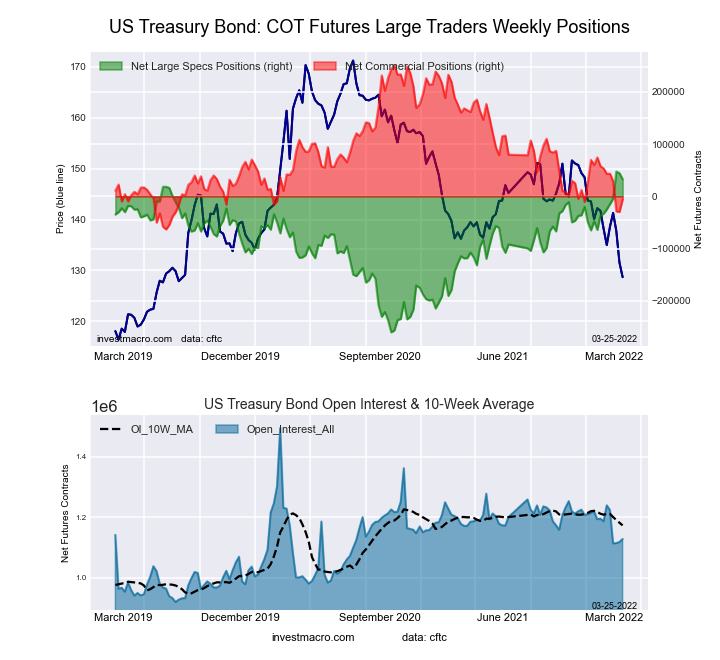
The bond markets with lower speculator bets were the 2-Year Bond (-27,015 contracts), Eurodollar (-128,245 contracts), Ultra 10-Year (-21,571 contracts), Long US Bond (-11,687 contracts) and the Ultra US Bond (-32,279 contracts).


Data Snapshot of Bond Market Traders | Columns Legend
Mar-22-2022OIOI-IndexSpec-NetSpec-IndexCom-NetCOM-IndexSmalls-NetSmalls-Index
Eurodollar10,832,33841-2,656,72203,074,395100-417,67313
FedFunds2,132,17681-13,3823829,68263-16,30018
2-Year2,297,31520-47,44873126,53848-79,09010
Long T-Bond1,128,2293632,55195-5,39418-27,15731
10-Year3,807,55351-263,83431464,33980-200,50532
5-Year3,774,45036-296,33831544,38380-248,04513


3-Month Eurodollars Futures:

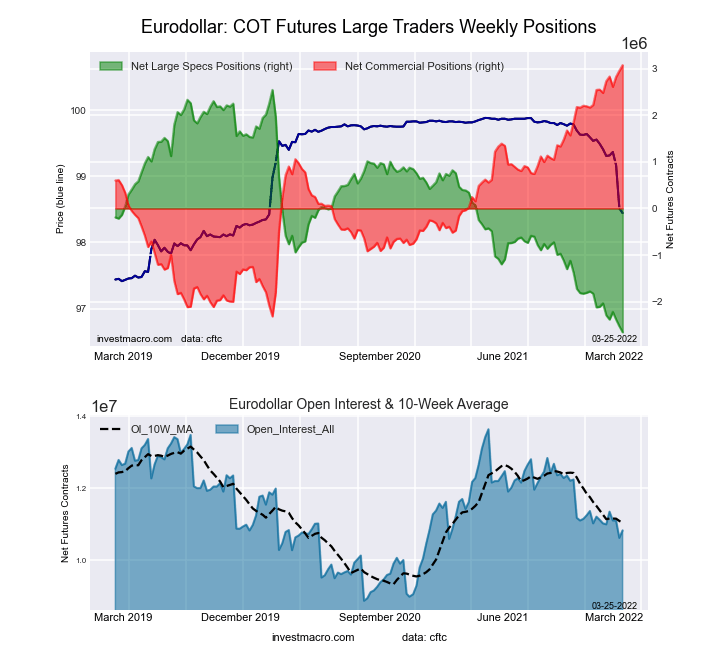
Eurodollar Bonds Futures COT ChartThe 3-Month Eurodollars large speculator standing this week equaled a net position of -2,656,722 contracts in the data reported through Tuesday. This was a weekly lowering of -128,245 contracts from the previous week which had a total of -2,528,477 net contracts.

This week’s current strength score (the trader positioning range over the past three years, measured from 0 to 100) shows the speculators are currently Bearish-Extreme with a score of 0.0 percent. The commercials are Bullish-Extreme with a score of 100.0 percent and the small traders (not shown in chart) are Bearish-Extreme with a score of 12.5 percent.

3-Month Eurodollars StatisticsSPECULATORSCOMMERCIALSSMALL TRADERS
– Percent of Open Interest Longs:4.275.73.6
– Percent of Open Interest Shorts:28.747.47.4
– Net Position:-2,656,7223,074,395-417,673
– Gross Longs:451,7918,204,977389,102
– Gross Shorts:3,108,5135,130,582806,775
– Long to Short Ratio:0.1 to 11.6 to 10.5 to 1
NET POSITION TREND:
– Strength Index Score (3 Year Range Pct):0.0100.012.5
– Strength Index Reading (3 Year Range):Bearish-ExtremeBullish-ExtremeBearish-Extreme
NET POSITION MOVEMENT INDEX:
– 6-Week Change in Strength Index:-11.911.05.8


30-Day Federal Funds Futures:

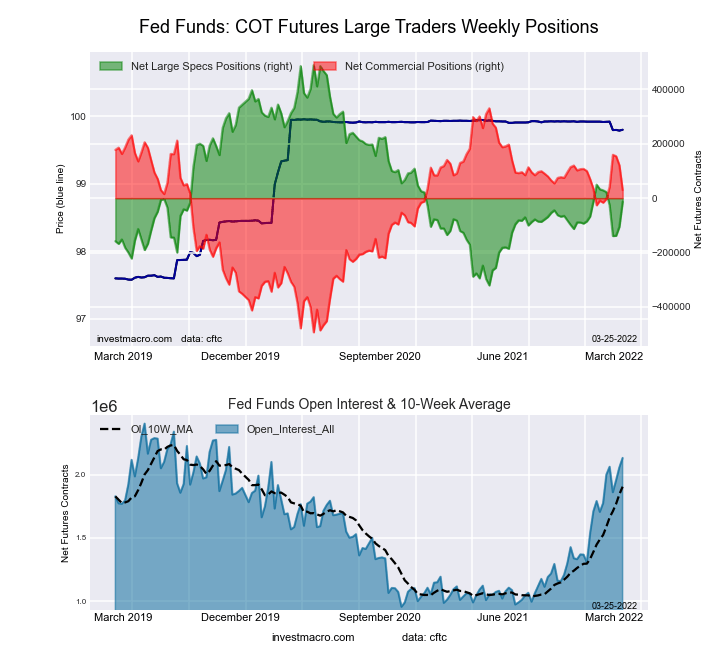
Federal Funds 30-Day Bonds Futures COT ChartThe 30-Day Federal Funds large speculator standing this week equaled a net position of -13,382 contracts in the data reported through Tuesday. This was a weekly advance of 91,899 contracts from the previous week which had a total of -105,281 net contracts.

This week’s current strength score (the trader positioning range over the past three years, measured from 0 to 100) shows the speculators are currently Bearish with a score of 38.0 percent. The commercials are Bullish with a score of 63.5 percent and the small traders (not shown in chart) are Bearish-Extreme with a score of 18.3 percent.

30-Day Federal Funds StatisticsSPECULATORSCOMMERCIALSSMALL TRADERS
– Percent of Open Interest Longs:7.177.01.8
– Percent of Open Interest Shorts:7.775.62.6
– Net Position:-13,38229,682-16,300
– Gross Longs:150,8281,640,74438,998
– Gross Shorts:164,2101,611,06255,298
– Long to Short Ratio:0.9 to 11.0 to 10.7 to 1
NET POSITION TREND:
– Strength Index Score (3 Year Range Pct):38.063.518.3
– Strength Index Reading (3 Year Range):BearishBullishBearish-Extreme
NET POSITION MOVEMENT INDEX:
– 6-Week Change in Strength Index:-5.25.6-10.5


2-Year Treasury Note Futures:

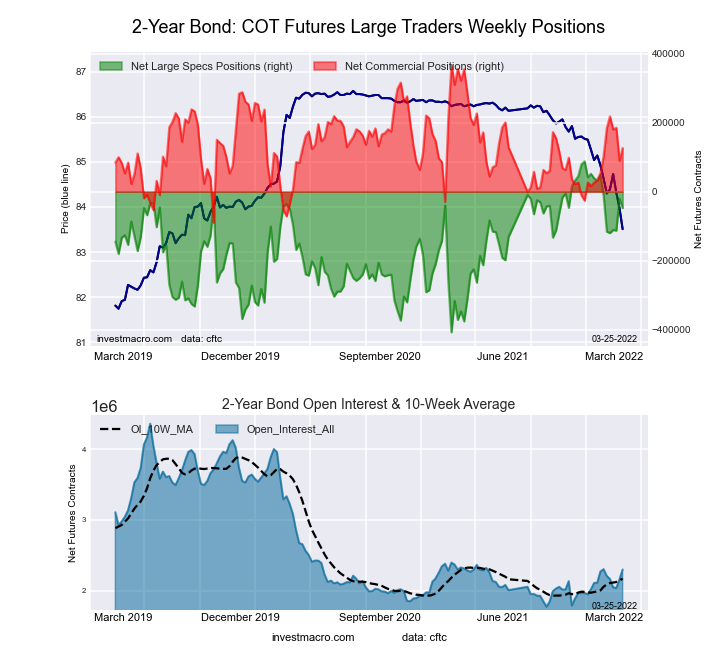
2-Year Treasury Bonds Futures COT ChartThe 2-Year Treasury Note large speculator standing this week equaled a net position of -47,448 contracts in the data reported through Tuesday. This was a weekly fall of -27,015 contracts from the previous week which had a total of -20,433 net contracts.

This week’s current strength score (the trader positioning range over the past three years, measured from 0 to 100) shows the speculators are currently Bullish with a score of 72.7 percent. The commercials are Bearish with a score of 47.5 percent and the small traders (not shown in chart) are Bearish-Extreme with a score of 9.9 percent.

2-Year Treasury Note StatisticsSPECULATORSCOMMERCIALSSMALL TRADERS
– Percent of Open Interest Longs:15.973.96.1
– Percent of Open Interest Shorts:18.068.49.6
– Net Position:-47,448126,538-79,090
– Gross Longs:365,7951,697,892140,374
– Gross Shorts:413,2431,571,354219,464
– Long to Short Ratio:0.9 to 11.1 to 10.6 to 1
NET POSITION TREND:
– Strength Index Score (3 Year Range Pct):72.747.59.9
– Strength Index Reading (3 Year Range):BullishBearishBearish-Extreme
NET POSITION MOVEMENT INDEX:
– 6-Week Change in Strength Index:-7.35.25.5


5-Year Treasury Note Futures:

5-Year Treasury Bonds Futures COT ChartThe 5-Year Treasury Note large speculator standing this week equaled a net position of -296,338 contracts in the data reported through Tuesday. This was a weekly lift of 50,964 contracts from the previous week which had a total of -347,302 net contracts.

This week’s current strength score (the trader positioning range over the past three years, measured from 0 to 100) shows the speculators are currently Bearish with a score of 31.2 percent. The commercials are Bullish with a score of 79.7 percent and the small traders (not shown in chart) are Bearish-Extreme with a score of 12.9 percent.

5-Year Treasury Note StatisticsSPECULATORSCOMMERCIALSSMALL TRADERS
– Percent of Open Interest Longs:9.181.67.1
– Percent of Open Interest Shorts:16.967.213.7
– Net Position:-296,338544,383-248,045
– Gross Longs:342,4713,081,019268,697
– Gross Shorts:638,8092,536,636516,742
– Long to Short Ratio:0.5 to 11.2 to 10.5 to 1
NET POSITION TREND:
– Strength Index Score (3 Year Range Pct):31.279.712.9
– Strength Index Reading (3 Year Range):BearishBullishBearish-Extreme
NET POSITION MOVEMENT INDEX:
– 6-Week Change in Strength Index:-28.821.1-2.5


10-Year Treasury Note Futures:

10-Year Treasury Notes Bonds Futures COT ChartThe 10-Year Treasury Note large speculator standing this week equaled a net position of -263,834 contracts in the data reported through Tuesday. This was a weekly advance of 57,163 contracts from the previous week which had a total of -320,997 net contracts.

This week’s current strength score (the trader positioning range over the past three years, measured from 0 to 100) shows the speculators are currently Bearish with a score of 31.4 percent. The commercials are Bullish-Extreme with a score of 80.0 percent and the small traders (not shown in chart) are Bearish with a score of 32.0 percent.

10-Year Treasury Note StatisticsSPECULATORSCOMMERCIALSSMALL TRADERS
– Percent of Open Interest Longs:10.877.97.9
– Percent of Open Interest Shorts:17.865.713.2
– Net Position:-263,834464,339-200,505
– Gross Longs:412,0302,966,196302,390
– Gross Shorts:675,8642,501,857502,895
– Long to Short Ratio:0.6 to 11.2 to 10.6 to 1
NET POSITION TREND:
– Strength Index Score (3 Year Range Pct):31.480.032.0
– Strength Index Reading (3 Year Range):BearishBullish-ExtremeBearish
NET POSITION MOVEMENT INDEX:
– 6-Week Change in Strength Index:-9.5-2.318.6


Ultra 10-Year Notes Futures:

Ultra 10-Year Treasury Notes Bonds Futures COT ChartThe Ultra 10-Year Notes large speculator standing this week equaled a net position of -91,321 contracts in the data reported through Tuesday. This was a weekly decrease of -21,571 contracts from the previous week which had a total of -69,750 net contracts.

This week’s current strength score (the trader positioning range over the past three years, measured from 0 to 100) shows the speculators are currently Bearish-Extreme with a score of 3.6 percent. The commercials are Bullish-Extreme with a score of 100.0 percent and the small traders (not shown in chart) are Bearish with a score of 41.2 percent.

Ultra 10-Year Notes StatisticsSPECULATORSCOMMERCIALSSMALL TRADERS
– Percent of Open Interest Longs:9.780.59.3
– Percent of Open Interest Shorts:16.763.918.8
– Net Position:-91,321214,698-123,377
– Gross Longs:125,9211,045,958120,546
– Gross Shorts:217,242831,260243,923
– Long to Short Ratio:0.6 to 11.3 to 10.5 to 1
NET POSITION TREND:
– Strength Index Score (3 Year Range Pct):3.6100.041.2
– Strength Index Reading (3 Year Range):Bearish-ExtremeBullish-ExtremeBearish
NET POSITION MOVEMENT INDEX:
– 6-Week Change in Strength Index:-35.727.020.8


US Treasury Bonds Futures:

US Year Treasury Notes Long Bonds Futures COT ChartThe US Treasury Bonds large speculator standing this week equaled a net position of 32,551 contracts in the data reported through Tuesday. This was a weekly lowering of -11,687 contracts from the previous week which had a total of 44,238 net contracts.

This week’s current strength score (the trader positioning range over the past three years, measured from 0 to 100) shows the speculators are currently Bullish-Extreme with a score of 95.2 percent. The commercials are Bearish-Extreme with a score of 18.4 percent and the small traders (not shown in chart) are Bearish with a score of 31.0 percent.

US Treasury Bonds StatisticsSPECULATORSCOMMERCIALSSMALL TRADERS
– Percent of Open Interest Longs:9.772.613.8
– Percent of Open Interest Shorts:6.973.116.3
– Net Position:32,551-5,394-27,157
– Gross Longs:109,965819,658156,236
– Gross Shorts:77,414825,052183,393
– Long to Short Ratio:1.4 to 11.0 to 10.9 to 1
NET POSITION TREND:
– Strength Index Score (3 Year Range Pct):95.218.431.0
– Strength Index Reading (3 Year Range):Bullish-ExtremeBearish-ExtremeBearish
NET POSITION MOVEMENT INDEX:
– 6-Week Change in Strength Index:21.3-18.7-5.4


Ultra US Treasury Bonds Futures:

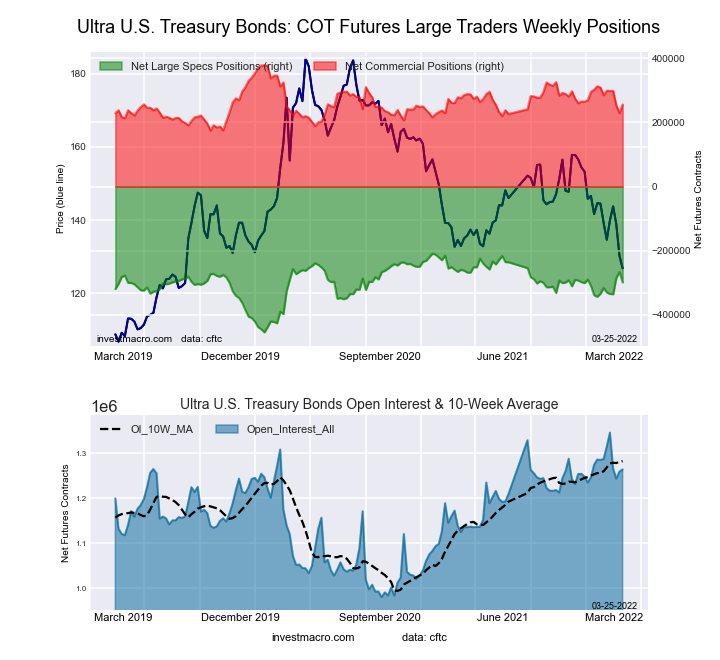
Ultra US Year Treasury Notes Long Bonds Futures COT ChartThe Ultra US Treasury Bonds large speculator standing this week equaled a net position of -298,523 contracts in the data reported through Tuesday. This was a weekly fall of -32,279 contracts from the previous week which had a total of -266,244 net contracts.

This week’s current strength score (the trader positioning range over the past three years, measured from 0 to 100) shows the speculators are currently Bullish with a score of 63.4 percent. The commercials are Bearish with a score of 40.0 percent and the small traders (not shown in chart) are Bullish with a score of 59.1 percent.

Ultra US Treasury Bonds StatisticsSPECULATORSCOMMERCIALSSMALL TRADERS
– Percent of Open Interest Longs:5.681.212.6
– Percent of Open Interest Shorts:29.261.09.2
– Net Position:-298,523255,63042,893
– Gross Longs:70,4251,026,988158,649
– Gross Shorts:368,948771,358115,756
– Long to Short Ratio:0.2 to 11.3 to 11.4 to 1
NET POSITION TREND:
– Strength Index Score (3 Year Range Pct):63.440.059.1
– Strength Index Reading (3 Year Range):BullishBearishBullish
NET POSITION MOVEMENT INDEX:
– 6-Week Change in Strength Index:7.1-14.18.3


Article By InvestMacroReceive our weekly COT Reports by Email

*COT Report: The COT data, released weekly to the public each Friday, is updated through the most recent Tuesday (data is 3 days old) and shows a quick view of how large speculators or non-commercials (for-profit traders) were positioned in the futures markets.

The CFTC categorizes trader positions according to commercial hedgers (traders who use futures contracts for hedging as part of the business), non-commercials (large traders who speculate to realize trading profits) and nonreportable traders (usually small traders/speculators) as well as their open interest (contracts open in the market at time of reporting).See CFTC criteria here.