Why You Should Pay Attention To Global Bond Yields

By Orbex

For those following central bank policy, the rise of bond yields around the world is imminent. These have a profound impact on financial markets, especially forex.

There is a general push by central banks to raise interest rates in an effort to stave off inflation. But not all banks are participating, and those that are, aren’t raising rates as fast as others. All of that shifts the underlying dynamic of currency markets. And that shift is likely to keep happening for several months.

What’s the issue?

The bond yield is basically how much interest is paid on a bond, minus the cost of the bond. This makes things a little more complicated because bonds are traded after they are issued at different prices. So, there are two factors to take under consideration:

1) When a bond is first issued, the seller has to attract interest from investors. They do this by offering to pay interest on the bond. The more popular the bond is the less interest has to be offered to get a buyer.

2) Once someone buys the bond, they can subsequently sell it. If they sell it at the value of the bond, then they don’t make a profit. But, if the demand for the bond has increased in the meantime, then they can sell the bond at a lower price than what it’s worth. And, thus they make a profit. Or, if demand for the bond diminishes, they might have to sell it at a higher price, and lose money. That is what drives the yield.

Central banks don’t “set” interest rates. Bonds have a fixed interest rate at the time of issue.

But depending on the price of the bond as it’s traded, then the yield varies. Central banks can cause a variation in this yield by setting an interest rate target, meaning that they will loan out money at a set rate. This puts competition into the market, lowering or increasing demand for bonds, and affecting yields.

Why you should care

Bonds are the primary investment for people holding liquid assets. That said, anyone who has a lot of cash will hold it in bonds.

Of course, they are going to prefer the bonds that offer the highest yield – that is, return on their investment. If yields go up, then more people will be attracted to buying bonds, instead of stocks, for example. If yields are higher in one currency than another, then investors will shift into that currency, increasing its value.

We also have to remember the mechanics behind this. If demand is lower, then yields naturally rise.

So, if yields are going up, it could also mean that there is less liquidity in the market. In other words, bondholders are forced to offer better terms to investors to attract them. This can be both organic and artificial.

Driving the exchange rate

An artificial lack of liquidity occurs when central banks start selling bonds (increasing the supply) and forcing bond yields to go up. The more bonds they sell, the less money is available in the market. While this makes investing in certain currencies more attractive and can drive them higher, it also means there is less money available for other things like buying stocks, gold, NFTs, and crypto.

Japanese yields are relatively low because the BOJ isn’t raising rates, and the Fed by comparison is pushing rates higher. Thus, it becomes a good investment to sell the yen to buy US bonds. And that explains why the USDJPY in particular has moved so high recently.

Open your account now to gain access to unlimited Orbex Trading Education!


Orbex-LogoArticle by Orbex

Orbex is a fully licensed broker that was established in 2011. Founded with a mission to serve its traders responsibly and provides traders with access to the world’s largest and most liquid financial markets. www.orbex.com

USDCAD Intermediate Correction (4) Hits Fresh Highs

By Orbex

USDCAD

The current structure of the USDCAD currency pair indicates the construction of a large correction wave IV. This is part of the global cycle impulse. This correction consists of sub-waves Ⓐ-Ⓑ-Ⓒ.

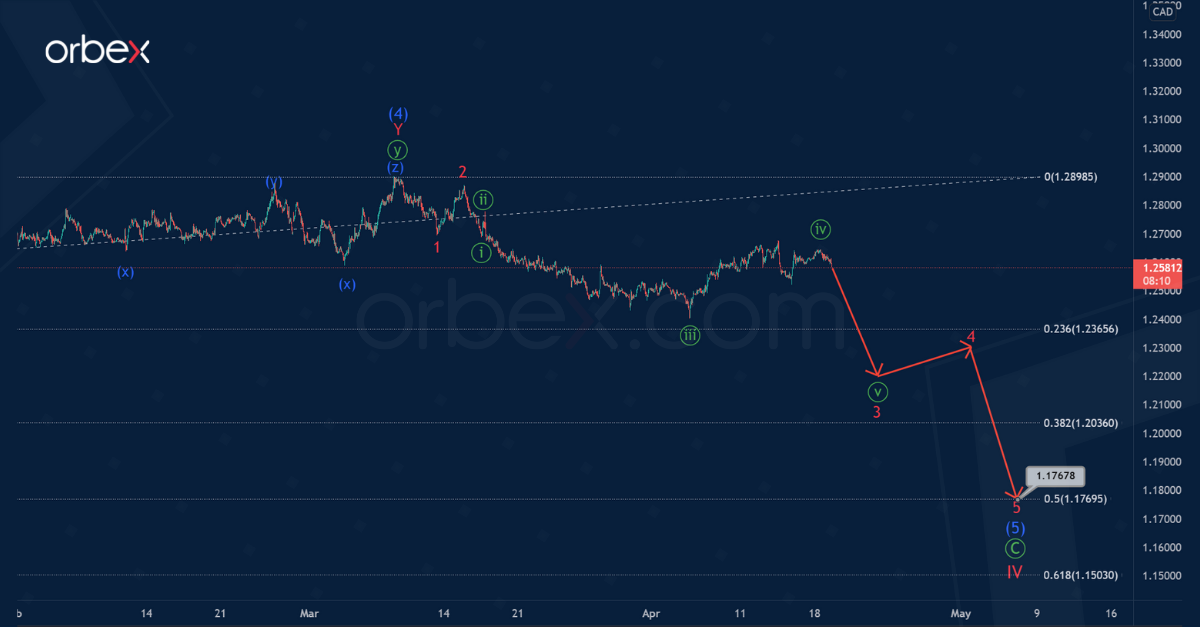
On the current chart, we see the final part of the primary impulse wave Ⓒ. Wave Ⓒ consists of intermediate sub-waves (1)-(2)-(3)-(4)-(5). A deep intermediate correction (4) is currently developing. This can take the form of a triple W-X-Y-X-Z zigzag.

In the near future, prices could rise in the final minor sub-wave Z. This actionary sub-wave is likely to be a minute double zigzag, as shown on the chart, and will end its pattern near the 1.314 level.

At the specified price level, correction (4) will be at 50% of the previous impulse wave (3).

USDCAD

The alternative suggests that the formation of the intermediate correction (4) has ended. In this scenario, it does not have the form of a triple, but of a double zigzag W-X-Y.

Thus, in the last section of the chart, we see the development of the initial part of the intermediate wave (5), which can take the form of a minor impulse 1-2-3-4-5.

If this scenario is confirmed, then in the upcoming trading weeks, market participants can expect an impulse price decline in the 3-4-5 sub-waves, as shown on the chart. And the entire intermediate wave (5) is likely to end near 1.176.

At that level, impulse (5) will be at the 50% Fibonacci extension of intermediate impulse (3).

Time to put your research to the test! Open your Orbex account and start trading now!


Orbex-LogoArticle by Orbex

Orbex is a fully licensed broker that was established in 2011. Founded with a mission to serve its traders responsibly and provides traders with access to the world’s largest and most liquid financial markets. www.orbex.com
Intraday Market Analysis – USD Rally Goes On

By Orbex

GBPUSD tests critical floor

GBPUSD

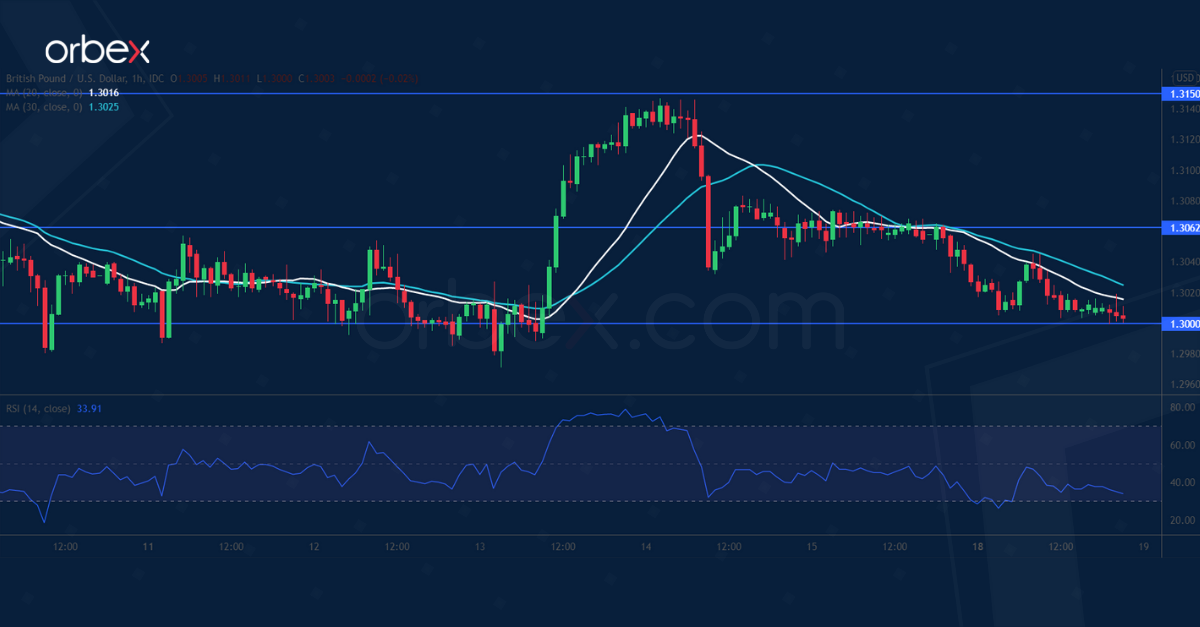
The US dollar continues upward as markets wager a 50 bp Fed hike next month. The pound’s latest rally came to a halt in the supply zone around 1.3150 which coincides with the 30-day moving average.

As the pair gives up its recent gains, the bears still retain control of the direction and seem to be ready to double down at rebounds. A drop below 1.3000 would attract momentum selling and push the pair to November 2020’s lows near 1.2860.

The RSI’s oversold situation may cause a temporary bounce towards 1.3060.

AUDUSD breaks support

AUDUSD

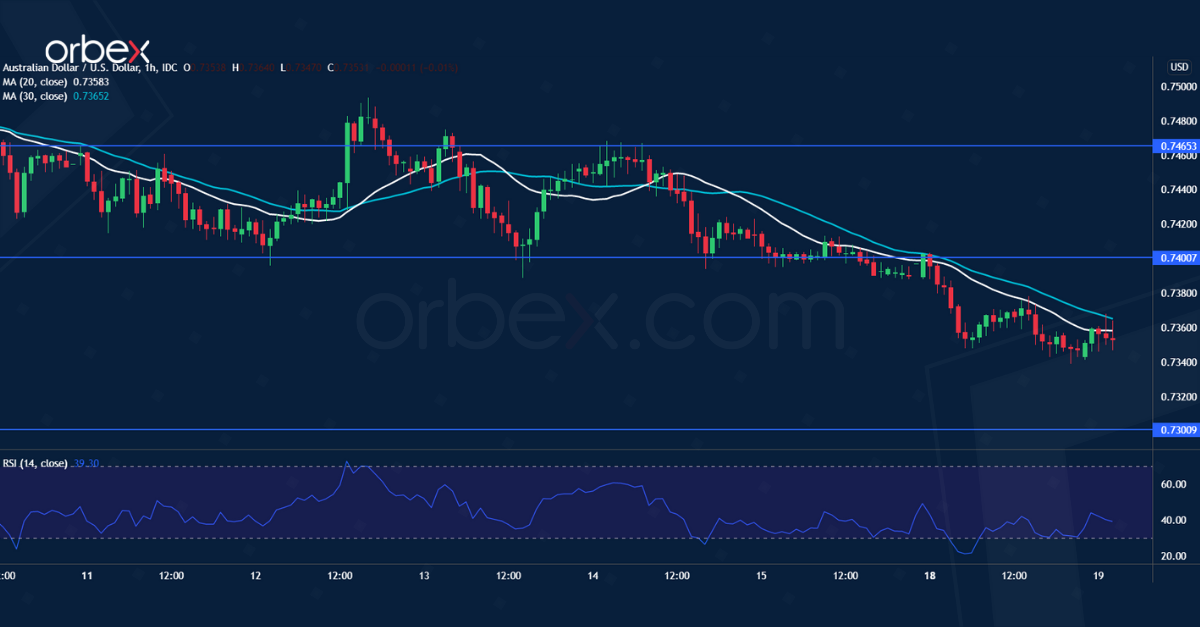
The Australian dollar remains under pressure after dovish RBA minutes. A fall below the demand zone between 0.7380 and 0.7400, which sits on the 30-day moving average, has put the bulls further on the defensive.

As the short-term prospect turns bearish, depressed offers compound the lack of bids, driving the Aussie even lower. 0.7300 would be the next target.

As the RSI recovers into the neutral area, the pair may face stiff selling pressure around the support-turned-resistance at 0.7400.

GER 40 seeks support

DAX 40

The Dax 40 retreats as risk appetite remains subdued across equity markets. The index is still under pressure after it struggled to hold above the psychological level of 14000.

The current pennant may turn out to be another distribution phase. Additionally, a break below 13900 would make the index vulnerable to a new round of sell-off.

13600 would be the next support. The bulls need to push above 14320 in order to turn the cautious mood around. Then 14600 will be the final hurdle before an extended recovery could materialize.


Orbex-LogoArticle by Orbex

Orbex is a fully licensed broker that was established in 2011. Founded with a mission to serve its traders responsibly and provides traders with access to the world’s largest and most liquid financial markets. www.orbex.com

Ichimoku Cloud Analysis 19.04.2022 (EURUSD, XAUUSD, USDCAD)

Article By RoboForex.com

EURUSD, “Euro vs US Dollar”

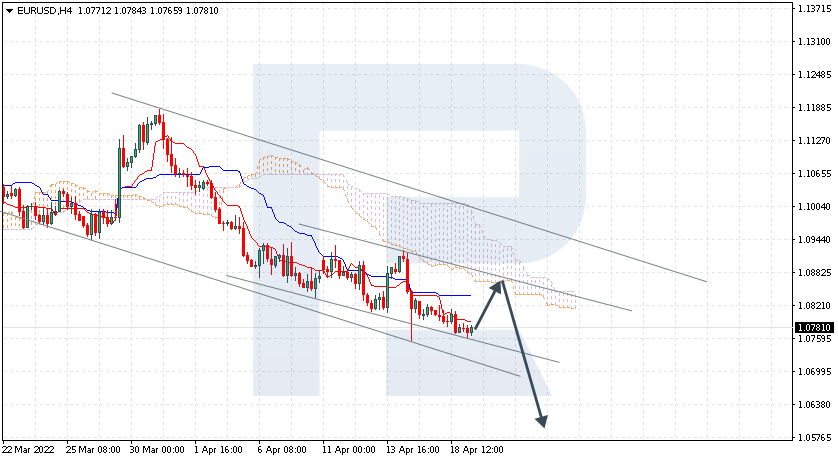
EURUSD is rebounding from Tenkan-Sen at 1.0781; it is testing the downside border of a large Triangle pattern. The instrument is currently moving below Ichimoku Cloud, thus indicating a descending tendency. The markets could indicate that the price may test the cloud’s downside border at 1.0835 and then resume moving downwards to reach 1.0585. Another signal in favour of a further downtrend will be a rebound from the descending channel’s upside border. However, the bearish scenario may no longer be valid if the price breaks the cloud’s upside border and fixes above 1.0955. In this case, the pair may continue growing towards 1.1045. If the asset fixes below 1.0600, it will break the pattern’s downside border and the next downside target will be at 0.9880.

EURUSD
Risk Warning: the result of previous trading operations do not guarantee the same results in the future

XAUUSD, “Gold vs US Dollar”

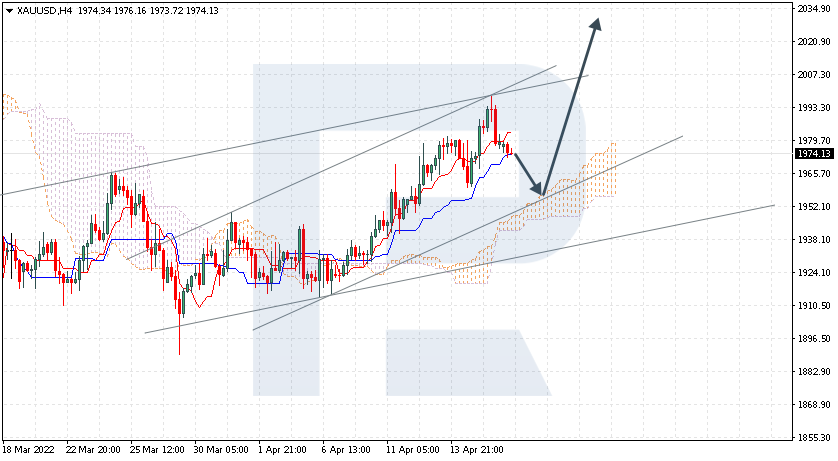
XAUUSD is testing Tenkan-Sen and Kijun-Sen at 1974.00. The instrument is currently moving above Ichimoku Cloud, thus indicating an ascending tendency. The markets could indicate that the price may test the cloud’s upside border at 1960.00 and then resume moving upwards to reach 2025.00. Another signal in favour of a further uptrend will be a rebound from the rising channel’s downside border. However, the bullish scenario may no longer be valid if the price breaks the cloud’s downside border and fixes below 1935.00. In this case, the pair may continue falling towards 1880.00. The asset has also completed a Double Bottom reversal pattern. If, after another descending correction, bulls manage to fix quickly above 1965.00 and rebound from the pattern’s upside border, the next upside target will be at 2040.00.

XAUUSD
Risk Warning: the result of previous trading operations do not guarantee the same results in the future

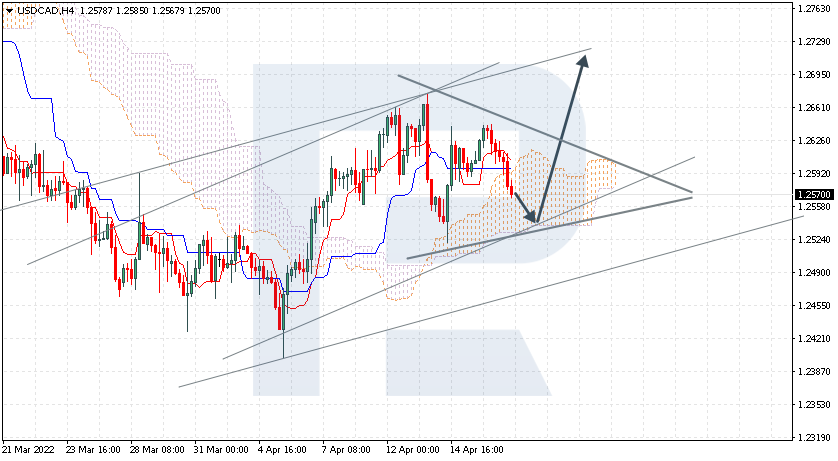
USDCAD, “US Dollar vs Canadian Dollar”

USDCAD continues correcting within the bullish channel at 1.2570; bulls have failed to fix above the resistance at 1.2655 and continue pushing the price towards 1.2900. The instrument is currently moving inside Ichimoku Cloud, thus indicating a sideways tendency. The markets could indicate that the price may test the cloud’s downside border at 1.2530 and then resume moving upwards to reach 1.2695. Another signal in favour of a further uptrend will be a rebound from the rising channel’s downside border. However, the bullish scenario may no longer be valid if the price breaks the cloud’s downside border and fixes below 1.2505. In this case, the pair may continue falling towards 1.2415. To confirm a further uptrend, the price must break the upside border of the Triangle pattern and fix above 1.2635. The pattern materialisation target will be at 1.2755.

USDCAD
Risk Warning: the result of previous trading operations do not guarantee the same results in the future

Article By RoboForex.com

Attention!
Forecasts presented in this section only reflect the author’s private opinion and should not be considered as guidance for trading. RoboForex LP bears no responsibility for trading results based on trading recommendations described in these analytical reviews.

Japanese Candlesticks Analysis 19.04.2022 (XAUUSD, NZDUSD, GBPUSD)

Article By RoboForex.com

XAUUSD, “Gold vs US Dollar”

As we can see in the H4 chart, XAUUSD has formed a Long-Legged Doji reversal pattern not far from the resistance area. At the moment, the asset is reversing in the form of another correctional impulse. In this case, the downside correctional target may be the support level at 1965.00. At the same time, an opposite scenario implies that the price may grow to reach 1995.00 and continue the ascending tendency without correcting and testing the support level.

XAUUSD
Risk Warning: the result of previous trading operations do not guarantee the same results in the future

NZDUSD, “New Zealand vs US Dollar”

As we can see in the H4 chart, NZDUSD has formed a Hammer reversal pattern close to the support area. At the moment, the asset is reversing in the form of a new ascending impulse. In this case, the upside target is at 0.6785. After that, the asset may rebound from the resistance level and resume moving downwards. However, an alternative scenario implies that the price may fall to reach 0.6685 without any corrections.

NZDUSD
Risk Warning: the result of previous trading operations do not guarantee the same results in the future

GBPUSD, “Great Britain Pound vs US Dollar”

As we can see in the H4 chart, GBPUSD has formed a Hammer reversal pattern near the support area. At the moment, the pair is reversing and may form a new ascending impulse. In this case, the upside target may be at 1.3045. After testing the resistance level, the market may rebound from it and resume trading downwards. Still, there might be an alternative scenario, according to which the asset may fall to reach 1.2935 without any pullbacks.

GBPUSD
Risk Warning: the result of previous trading operations do not guarantee the same results in the future

Article By RoboForex.com

Attention!
Forecasts presented in this section only reflect the author’s private opinion and should not be considered as guidance for trading. RoboForex LP bears no responsibility for trading results based on trading recommendations described in these analytical reviews.

The Analytical Overview of the Main Currency Pairs on 2022.04.19

by JustForex

The EUR/USD currency pair

Technical indicators of the currency pair:
  • Prev Open: 1.0803
  • Prev Close: 1.0780
  • % chg. over the last day: -0.21%

Yesterday, there was a bank holiday in almost all European countries, so volatility was low. Fundamentally, the European currency now looks weaker than the dollar index as the Fed is already tightening monetary policy. At the same time, the ECB will only complete its bond-buying program in the third quarter of 2022. Russia continues to attack Ukraine, so Europe will continue to be under price pressure.

Trading recommendations
  • Support levels: 1.0727, 1.0633
  • Resistance levels: 1.0844, 1.0889, 1.0958, 1.1027, 1.1196, 1.1291

From the technical point of view, the trend on the EUR/USD currency pair in the hourly time frame is bearish. Against the uncertainty from ECB, the euro continues to lose ground. The MACD indicator has become negative, but there are signs of divergence. Under such market conditions, it is possible to look for buy trades on intraday timeframes from the support level of 1.0727, but only with short targets and confirmation. Sell trades should be considered from the resistance level of 1.0844 or 1.0889, but only after the additional confirmation.

Alternative scenario: if the price breaks out through the 1.0958 resistance level and fixes above, the uptrend will likely resume.

EUR/USD
News feed for 2022.04.19:
  • – US Building Permits (m/m) at 15:30 (GMT+3).

The GBP/USD currency pair

Technical indicators of the currency pair:
  • Prev Open: 1.3046
  • Prev Close: 1.3010
  • % chg. over the last day: -0.27%

The British currency now looks more confident than the euro as the Bank of England has already raised interest rates three times. Economic data shows no signs of stagflation (slowing economic growth with high inflation). But GBP/USD is still declining due to the growth of the dollar index.

Trading recommendations
  • Support levels: 1.2993, 1.3023
  • Resistance levels: 1.3026, 1.3094, 1.3115, 1.3147, 1.3244, 1.3274

On the hourly time frame, the GBP/USD currency pair trend is still bearish. The MACD indicator has become negative, but there is divergence on the intraday timeframes. Under such market conditions, sell trades should be looked for from the resistance level of 1.3027 or 1.3094, but with confirmation. For buy deals, traders may consider the level of 1.2993, but only after the appearance of a bullish initiative and with short targets.

Alternative scenario: if the price breaks down through the 1.3147 resistance level and fixes above, the mid-term uptrend will likely be resumed.

GBP/USD
There is no news feed for today.

The USD/JPY currency pair

Technical indicators of the currency pair:
  • Prev Open: 126.41
  • Prev Close: 126.99
  • % chg. over the last day: +0.46%

The Japanese yen is approaching its longest decline in 20 years as divergent policies between the central banks of Japan and the US have led to a depreciation of the Japanese currency and a rise in the dollar index. Many investors are betting on a further fall in the yen. Recent CFTC data shows that net short positions in the yen are the largest in three and a half years. Japanese Finance Minister Shunichi Suzuki said on Tuesday that the damage to the economy from the weakening yen is now greater than the benefits, which is the clearest warning against the recent currency decline.

Trading recommendations
  • Support levels: 126.69, 125.72, 124.66, 124.24, 122.97, 122.63, 121.81
  • Resistance levels: 128.19

The medium-term trend on the USD/JPY currency pair is bullish. The MACD indicator has become positive again, but on the higher timeframes, there is a divergence. The price has deviated greatly from the moving averages and does not make significant pullbacks. Under such market conditions, it is best to look for buy deals, expecting the continuation of the uptrend, but after the price makes a pullback to the average lines. First of all, it is worth considering the support level of 126.69, but with additional confirmation. A resistance level of 128.19 may be considered for sell deals, but only after the appearance of a bearish initiative.

Alternative scenario: If the price fixes below 124.66, the uptrend will likely be broken.

USD/JPY
News feed for 2022.04.19:
  • – Japan Industrial Production (m/m) at 07:30 (GMT+3).

The USD/CAD currency pair

Technical indicators of the currency pair:
  • Prev Open: 1.2608
  • Prev Close: 1.2608
  • % chg. over the last day: 0.00%

The Canadian dollar is a commodity currency and is highly dependent on the movement of oil prices and the dollar index. The dollar index continued to rise, but oil prices are also rising for the fourth day in a row, as disruptions in Libya worsen the situation for supplies from Russia. As a result, in terms of fundamental factors, USD/CAD quotes have no unified dynamics at the moment.

Trading recommendations
  • Support levels: 1.2567, 1.2467
  • Resistance levels: 1.2644, 1.2713, 1.2754, 1.2851

The USD/CAD currency pair is bullish in terms of technical analysis. The MACD indicator has become negative. Trade is worth it only with short targets because, fundamentally, there are no prerequisites for the medium-term trend on the USD/CAD currency pair. Under such market conditions, it is better to look for buy trades on the lower timeframes from the support level of 1.2567, but it is better with additional confirmation. For sell deals, it is better to consider the resistance level of 1.2644, but it is also better with confirmation.

Alternative scenario: if the price breaks through and consolidates below 1.2467, the downtrend will likely be resumed.

USD/CAD
There is no news feed for today.

by JustForex


This article reflects a personal opinion and should not be interpreted as an investment advice, and/or offer, and/or a persistent request for carrying out financial transactions, and/or a guarantee, and/or a forecast of future events.

The US economy is on the verge of recession. Gold is rising despite Fed tightening policy

by JustForex

Fears of an impending recession are growing in the United States. Goldman Sachs predicts that a significant narrowing of the gap between the number of vacancies in the labor market and the number of workers is a sign of the beginning of the recession. The US Federal Reserve will have the difficult task of tightening its monetary policy enough to reduce inflation without causing an economic slowdown in the United States. Despite all the assurances from the Fed officials that they can tighten monetary policy and reduce inflation without destroying the economy (economists call it a “soft landing”), this idea raises many skeptics, including former US Treasury Secretary Larry Summers. He believes that the recession is now the most likely outcome for the US economy soon. But it is worth noting that this will not happen tomorrow or next week. The deviation is significant. Analytical houses predict the beginning of a recession in the US in the next 1-2 years.

As the stock market closed yesterday, the Dow Jones index (US30) decreased by 0.11%, the S&P 500 index (US500) lost 0.02%, and NASDAQ Technology Index (US100) fell by 0.14%.

Bank of America reported second-quarter results that exceeded analysts’ expectations. Revenue growth was driven by strong trade growth and increased lending. Shares of BAC gained more than 3%.

The World Bank lowered its 2022 global GDP growth forecast to 3.2% from 4.1%.

The US convenes an unscheduled meeting with the heads of several states: France, Germany, Great Britain, Canada, Italy, Poland, and Romania as part of Russia’s offensive on Ukraine. The NATO Secretary-General, the presidents of the European Commission, and the European Council will also take part.

Major European indices were not traded yesterday. Incumbent French President Emmanuel Macron has said that France does not need Russian gas and has called for sanctions against Russia’s energy sector. The question is, is France really that serious, or does Macron want to raise his rating in this way before the decisive round of the presidential election?

Foreign investments in Russian real estate have fallen to a record high – in the first three months of 2022, their share of investments in commercial real estate was only 1.8%, and at the end of the year, it will be close to zero.

Oil is rising in price for the fourth day in a row as disruptions in Libya exacerbate the situation with supplies from Russia. The 70,000 bpd El-Fil oil field was shut down on April 16 after protests demanding the resignation of Prime Minister Abdul Hamid Dbeiba. Oil production in Russia continued to decline in April, down 7.5% in the first half of the month compared to March.

Last week, EU governments said the EU leadership was preparing proposals to ban Russian oil, although diplomats said Germany did not actively support the embargo. The International Energy Agency has warned that about 3 million barrels per day of Russian oil could be halted from May due to sanctions or buyers who voluntarily reject Russian cargoes.

Gold resumes gains despite the tighter monetary policy of the US Federal Reserve. Gold has inversely correlated with government bond yields, which rise as monetary policy tightens, leading to lower precious metals prices. But at the moment, the gold market shows the outperformance of the gold miners’ equity sector both over the price of gold and the broader equity market. This picture indicates a stable demand for gold and positively impacts the continuation of the uptrend in gold.

Japan’s Nikkei 225 (JP225) decreased by 1.08% yesterday, and Hong Kong’s Hang Seng (HK50) and Australia’s S&P/ASX 200 (AU200) were not trading yesterday. The Chinese Central Bank cut the reserve requirement ratio for most commercial banks by 0.25%, freeing up to 530 billion yuan of liquidity. The reserve requirement ratio will be reduced by 0.5% for small rural and urban commercial banks. This is a positive signal for Asian stock markets. The International Monetary Fund will consider quick financial assistance for debt-laden Sri Lanka. The IMF will help replenish financial reserves and raise financing to pay for basic fuel, food, and medicine imports. Sri Lanka’s devastating financial crisis has erupted as the effects of COVID-19 have exacerbated poor public financial management and rising fuel prices eroded foreign exchange reserves.

Main market quotes:

S&P 500 (F) (US500) 4,391.69 -0.90 (-0.02%)

Dow Jones (US30) 34,411.69 -39.54 (-0.11%)

DAX (DE40) 14,163.85 +87.41 (+0.62%)

FTSE 100 (UK100) 7,616.38 +35.58 (+0.47%)

USD Index 100.80 +0.48 (+0.48%)

Important events for today:
  • – Australia RBA Meeting Minutes (m/m) at 04:30 (GMT+3);
  • – Japan Industrial Production (m/m) at 07:30 (GMT+3);
  • – US Building Permits (m/m) at 15:30 (GMT+3);
  • – Switzerland SNB Chairman Thomas Jordan Speaks at 19:30 (GMT+3).

by JustForex


This article reflects a personal opinion and should not be interpreted as an investment advice, and/or offer, and/or a persistent request for carrying out financial transactions, and/or a guarantee, and/or a forecast of future events.

A volatile week ahead for financial markets?

By Lukman Otunuga Senior Research Analyst, ForexTime

Stocks in Asia traded cautiously on Tuesday, following a negative close on Wall Street overnight as growth concerns, inflation worries and geopolitical tensions hit risk sentiment. European markets opened lower this morning due to the deepening crisis in Ukraine, with the caution likely to find its way back to US markets this afternoon. In the currency space, the mighty dollar rose to a fresh two-year high during early trade, supported by rising treasury yields and Fed hike bets. Gold slipped after almost kissing $2000 in the previous session, while oil benchmarks steadied after jumping on Monday.

Despite the public holiday in most of Europe yesterday, this is shaping up to be another volatile and eventful week for global markets. The latest comments from the World Bank have added to the cocktail of caution that will most likely influence sentiment over the next few sessions. The bank cut its global growth forecast for 2022 by nearly a full percentage point to 3.2% from its previous estimate of 4.1%, thanks to the war in Ukraine, soaring inflation, and the lingering effects of Covid-19. Later today, the International Monetary Fund (IMF) will release its updated global economic outlook with markets expecting a downgrade for growth this year. Such a development may hit investor confidence, sweetening appetite for safe-haven assets.

On the earnings front, Johnson & Johnson and insurance company, Travelers will report their latest results before the opening bell. Streaming giant Netflix will release its earnings after the market close. Traders will also focus on speeches from financial heavyweights Fed Chair Jerome Powell and ECB President Christine Lagarde later this week.

Dollar flexes muscles across the FX space

The dollar tightened its grip on its throne this morning by rising to a fresh two-year high as investors braced for more aggressive U.S rate hikes. Markets have fully priced in a 50bp rate hike at the Fed’s May meeting, with the odds of another half-point rate hike in June very high. Given how the dollar has appreciated against every single G10 currency this month, bulls are certainly in a position of power to drive prices higher.

When considering how the week ahead will be filled with more speeches from Fed officials, this could fuel upside gains if they all sing a hawkish tune. Indeed, we heard from arch-hawk Bullard overnight who signaled an openness to a 75bp hike. The dollar index (DXY) has the potential to challenge 103.00 if a solid daily close above 101.00 is secured.

Commodity spotlight: Gold

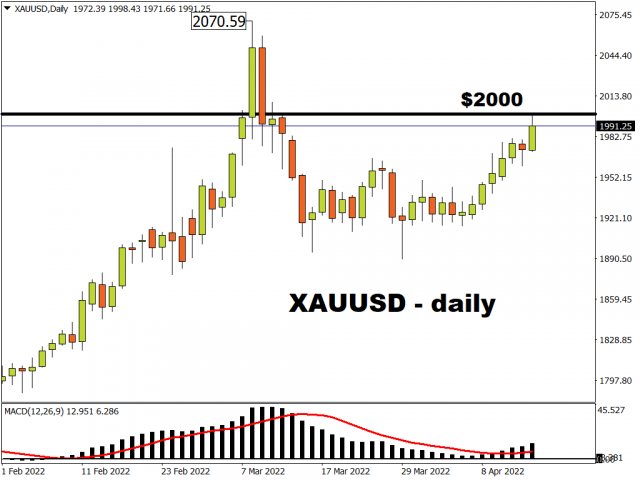
After rallying within a hair’s length of $2000 in the previous session, gold is trading back around $1974 as of writing. With numerous competing themes likely to influence market sentiment this week, gold may find itself pulled and tugged by conflicting forces. Heightened geopolitical risks and global growth concerns could trigger risk aversion, sending investors rushing towards gold’s safe embrace. However, an appreciating dollar, rising Treasury yields, and Fed hike expectations may create multiple obstacles down the road.

Looking at the technical picture, gold has the potential to trend higher, but prices seem to be forming another range. Support can be found at around $1960 and resistance at $2000. A move back below $1960 could trigger a selloff towards $1920. Alternatively, a solid breakout above $2000 may open the doors towards $2009, $2015, and $2050, respectively.

Disclaimer: The content in this article comprises personal opinions and should not be construed as containing personal and/or other investment advice and/or an offer of and/or solicitation for any transactions in financial instruments and/or a guarantee and/or prediction of future performance. ForexTime (FXTM), its affiliates, agents, directors, officers or employees do not guarantee the accuracy, validity, timeliness or completeness, of any information or data made available and assume no liability as to any loss arising from any investment based on the same.


Forex-Time-LogoArticle by ForexTime

ForexTime Ltd (FXTM) is an award winning international online forex broker regulated by CySEC 185/12 www.forextime.com

Trade of the Week: Gold set to breach $2000 again. What’s next?

By Han Tan Chief Market Analyst at Exinity Group

As mentioned in our Week Ahead outlook (posted on Fridays), gold was expected to rise on a souring outlook for the global economy.

The precious metal duly started off the week by rising to within a whisker of the psychologically-important $2000 mark.

Gold’s climb is all the more remarkable in light of the advances seen in the US dollar and Treasury yields.

Typically, gold has an inverse relationship with those two (when the Dollar/yields rise, gold falls, and vice versa).

Instead, the precious metal has been able to break off the shackles from that inverse relationship to climb alongside the greenback as well as Treasury yields.


Why is gold climbing again?

A big reason for this surge in gold prices is due to investors sending money into exchange-traded funds (ETFs) that track gold.

With such inflows, the ETF then buys up more gold, driving prices higher.

So far this year, bullion-backed ETFs have made net purchases of 8.77 million ounces of gold, which is 9% more since the start of the year. At 106.6 million ounces, that’s the most amount of gold being held by these ETFs since February 2021. Last week alone, the amount of money sent into ETFs that track commodities (including gold) have tripled, with most of that money going into precious metal ETFs.

In short, there’s a lot of money chasing after bullion.


Why are investors/traders flocking to gold?

1) Demand for safe havens amid fears of a recession

Just a couple of hours ago, the World Bank revised downwards its global GDP forecast to 3.2% for 2022. That is lower than its previous 4.1% forecast made in January, and also slower than 2021’s 5.7% growth.

This past Sunday, Goldman Sachs, a highly influential bank on Wall Street, forecasted a 35% chance of a recession in the US over the next two years. Such headlines across the financial news wires fuelled more demand for safe havens – assets which can protect investors’ wealth in times of great fear and uncertainty.

READ MORE: What are safe haven assets?

Also, markets are concerned that the prolonged lockdowns in China could mean a challenging 2022 for the rest of the world, despite China announcing a better-than-expected Q1 GDP print earlier today.

Then there’s also the war in the Ukraine that’s driving up global inflation and investors’ fears. With inflation already at eye-watering heights, a drastic pullback in spending (because consumers can no longer afford those sky-high prices) could mean slower economic growth, or worse, a recession.


2) Gold as an inflation hedge

Gold has long been seen as a way to preserve investors wealth against rising consumer prices. In light of the red-hot inflation figures seen around the world, this narrative is getting louder and attracting more believers, which is sending gold prices higher.

READ MORE: Inflation everywhere! What does it mean for markets?


Where to next for gold prices?

$2000 seems imminent for gold.

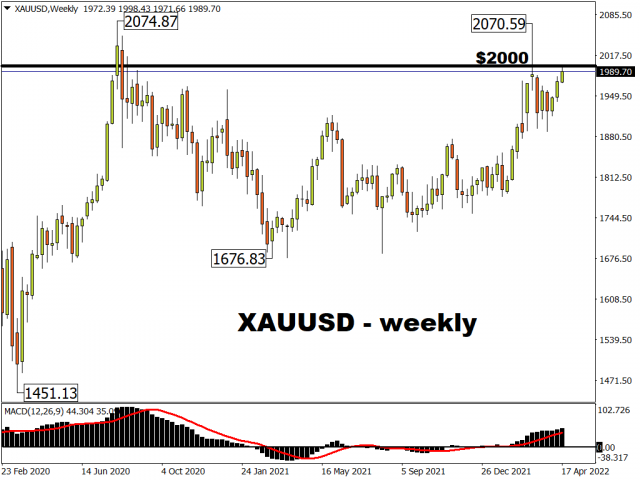
If it crosses above that psychologically-important mark, which appears likely at this stage, then there’s little resistance on the way back to the $2070 region.

Gold bulls will be looking to launch another assault at the $2074.87 record high that was recorded in August 2020. After all, they came tantalizingly close back in March, coming to within less than five dollars of the precious metal’s highest-ever peak.

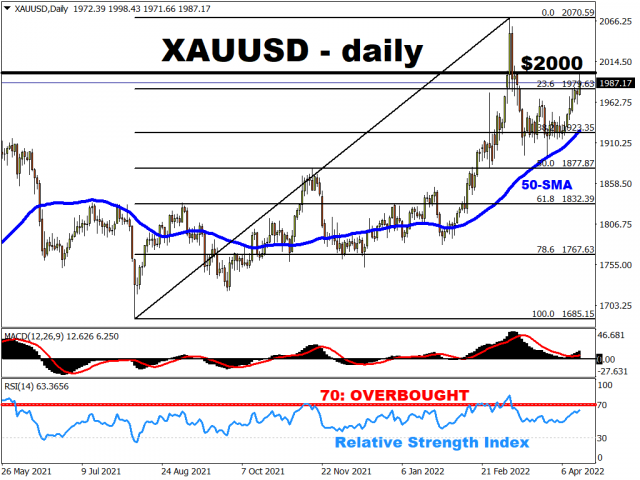
The fact that gold was able to punch past a key resistance level, being the 23.6% Fibonacci retracement line from the August 2021 through March 2022 ascent, may just have paved the way for $2000 gold this week.

However, a note of caution …

Looking at the past two times when gold broke above $2000, it wasn’t able to hold its head above that level for long.

And such an episode may play out again for a third time.

With the 14-day relative strength index looking to surpass the 70 threshold which typically denotes overbought conditions, such a technical event could trigger a swift pullback in gold prices.


What needs to happen this week to send gold prices …

  • above $2000?

From a fundamental perspective, markets have to be fed even more negative headlines about a global economy or inflation that’s becoming worse.

The IMF (International Monetary Fund) is expected to make a downward revision to its forecast for how much the global economy can grow this year. This is due in part to the ongoing war between Russia and the Ukraine, which is keeping commodity prices elevated and threatening a recession in other countries.

More dire warnings about the global economy by the IMF could encourage gold bulls.


  • back down to the mid-$1900s?

On the other hand, gold could be met with a moment of reckoning if we see even more hawkish talk out of Fed officials.

Note that these central bankers are about to enter a period of radio silence (no public statements) before the next FOMC meeting in the first week of May.

Hence, this week would be the last chance market participants can get more clues about whether the Fed will hike by 50-basis points in May, which would be double the usual adjustments of 25 basis points at a time.

If markets are surer that larger-than-usual Fed rate hikes are in store, that should send Treasury yields even higher, with yields on 10-year Treasuries moving even closer to the psychologically-important 3% mark.

Typically, the higher Treasury yields go, then demand for gold weakens.

This is usually because investors might pivot towards the higher yields that Treasuries offer compared to gold which offers zero yields (the precious metal doesn’t offer payments in return for holding it).

While as pointed out at the start of this report that the inverse relationship between Treasury yields/dollar and gold prices has been broken for a while, it could still come back with a vengeance and foil gold bulls’ attempt to post a new record high in the immediate future.

Such a pullback could see gold then retesting support around the $1980 mark, with stronger support potentially arriving at the February peak of $1974.42, followed by the previous cycle high of $1966.20.


Disclaimer: The content in this article comprises personal opinions and should not be construed as containing personal and/or other investment advice and/or an offer of and/or solicitation for any transactions in financial instruments and/or a guarantee and/or prediction of future performance. ForexTime (FXTM), its affiliates, agents, directors, officers or employees do not guarantee the accuracy, validity, timeliness or completeness, of any information or data made available and assume no liability as to any loss arising from any investment based on the same.


Forex-Time-LogoArticle by ForexTime

ForexTime Ltd (FXTM) is an award winning international online forex broker regulated by CySEC 185/12 www.forextime.com

I’ve studied stadium financing for over two decades – and the new Bills stadium is one of the worst deals for taxpayers I’ve ever seen

By Victor Matheson, College of the Holy Cross 

After New York lawmakers blew past the deadline to approve the state budget, they finally came to an agreement on April 9, 2022, that included a US$850 million subsidy for a new stadium in Buffalo for the NFL’s Bills.

As a sports economist who has studied stadium deals for over two decades, I am not exaggerating when I write that the New York Legislature has managed to craft one of the worst stadium deals in recent memory – a remarkable feat considering the high bar set by other misguided state and local governments across the country.

Study after study has shown that stadiums are terrible public investments. The taxpayers financing them rarely want to pay for them. So why are governments willing to subsidize them?

A return to the bad old days

There were many things to dislike about the Bills stadium project. At $850 million, it is the largest taxpayer handout for a new stadium in U.S. history even before additional subsidies such as annual maintenance costs, property tax exemptions and tax exemptions for municipal bond interest are considered. These factors could easily drive the total government price tag well over $1 billion.

With taxpayers footing over 60% of the $1.4 billion price tag, it also runs counter to the trend of the past decade toward lower levels of public funding for stadium construction.

State and local governments on average had covered roughly two-thirds of stadium construction costs during the first wave of the modern stadium boom that began in 1991. During the Great Recession, however, government leaders found it politically unpalatable to hand over hundreds of millions of dollars to billionaire owners as they were laying off teachers and firefighters.

Over the past decade, my ongoing research has shown that public subsidies have fallen to only one-third of building costs, on average. In fact, the most recent Super Bowl was played in the entirely privately financed SoFi Stadium in Los Angeles.

The Bills deal evokes the bad old days.

Stadium subsidies in general are terrible public policy, and this arrangement is no exception.

The Bills and their owners, Terry and Kim Pegula, don’t need a handout. With a net worth of $5.8 billion, Terry Pegula ranks as the ninth-richest owner in the NFL. The generous revenue-sharing structure of the NFL means that even playing in one of the league’s smallest markets, the Bills have earned over $300 million in operating income since the Pegulas purchased the team for $1.4 billion just seven years ago. And since then, the value of the Bills has risen by another $900 million. The Pegulas have earned enough on their investment in just seven years to pay for the entirety of a new stadium on their own.

But the only thing better for a team owner than a new stadium is a new stadium that someone else pays for. Indeed, the new stadium is likely to further drive up the value of the Bills far more than the $350 million the Pegulas are contributing to the stadium’s construction costs.

Stadiums make poor neighbors

These taxpayer-funded deals are often pitched as an investment in the local economy, but two decades of academic research on the topic have conclusively shown that stadiums and franchises have little or no impact on local economies. The Bills are not likely to be an exception.

For one, most of the customers at a sports venue are residents of the metro area who would simply spend money elsewhere in the local economy in the absence of the team. Second, stadiums often make poor neighbors. NFL venues, like the Bills’ current home, Highmark Stadium, are huge facilities that are rarely used: The Bills play eight home games each year in the regular season. This creates little incentive for investing in the surrounding neighborhoods.

And don’t think that NFL stadiums typically host a multitude of other events. Over its 50 years of existence, aside from a pair of annual high school football games and a few miscellaneous competitions, Highmark Stadium has hosted a grand total of 30 major concerts, three college football games and two large hockey games. And Buffalo’s venue is not out of the ordinary for any large, outdoor stadium.

Rather than creating a dense area of housing, retail establishments and restaurants, Highmark Stadium instead sits alone as an island of concrete in a sea of parking lots.

The threat of relocation

The stadium project is deeply unpopular, with one survey finding that 55% of New Yorkers are opposed to the plan, versus only 22% in favor of it.

So why did it get included in the state budget?

For one, stadiums are a perfect example of the classic special-interest problem. For a handful of passionate fans in Buffalo, a new stadium may determine which candidate gets their vote. But for the rest of the state, a small increase in their tax burden is unwelcome but not problematic enough to compel a voter to switch sides.

Teams have also gotten smart about minimizing transparency, which is bad for public policy but good for team owners. The Bills stadium proposal was added to the state budget and dropped on unsuspecting taxpayers just days before a final vote was scheduled in the Legislature. With such a short timeline, it was impossible for lawmakers to fully analyze the issue, and there was little time for public interest groups to mobilize against the handouts.

The Pegulas were essentially able to extort New York taxpayers by threatening to relocate the team if they didn’t pay up. Buffalo is only the 49th-largest metro area in the U.S. At least half a dozen cities across the U.S. without NFL franchises are both richer and at least twice as populous, including San Diego, St. Louis, Portland and Austin, not to mention the possibility of a franchise in London.

With their current lease expiring in 2023, the team had already indicated that the 2022 season could have been its last in Buffalo.

This threat was a slap in the face of loyal Bills fans who have supported the team for over 60 years through subzero temperatures, lake-effect snow, four straight Super Bowl losses in the 1990s and more losing seasons than winning ones.

The NFL has long kept the number of teams lower than the number of cities that could profitably support a franchise. So as long as owners are willing to use the threat of relocation, I don’t believe any city’s fans – and any state’s taxpayers – are safe.The Conversation

About the Author:

Victor Matheson, Professor of Economics and Accounting, College of the Holy Cross

This article is republished from The Conversation under a Creative Commons license. Read the original article.