
By Orbex

The current structure of the USDCAD currency pair indicates the construction of a large correction wave IV. This is part of the global cycle impulse. This correction consists of sub-waves Ⓐ-Ⓑ-Ⓒ.
On the current chart, we see the final part of the primary impulse wave Ⓒ. Wave Ⓒ consists of intermediate sub-waves (1)-(2)-(3)-(4)-(5). A deep intermediate correction (4) is currently developing. This can take the form of a triple W-X-Y-X-Z zigzag.
In the near future, prices could rise in the final minor sub-wave Z. This actionary sub-wave is likely to be a minute double zigzag, as shown on the chart, and will end its pattern near the 1.314 level.
At the specified price level, correction (4) will be at 50% of the previous impulse wave (3).
Free Reports:
 Sign Up for Our Stock Market Newsletter – Get updated on News, Charts & Rankings of Public Companies when you join our Stocks Newsletter
 Get our Weekly Commitment of Traders Reports - See where the biggest traders (Hedge Funds and Commercial Hedgers) are positioned in the futures markets on a weekly basis.
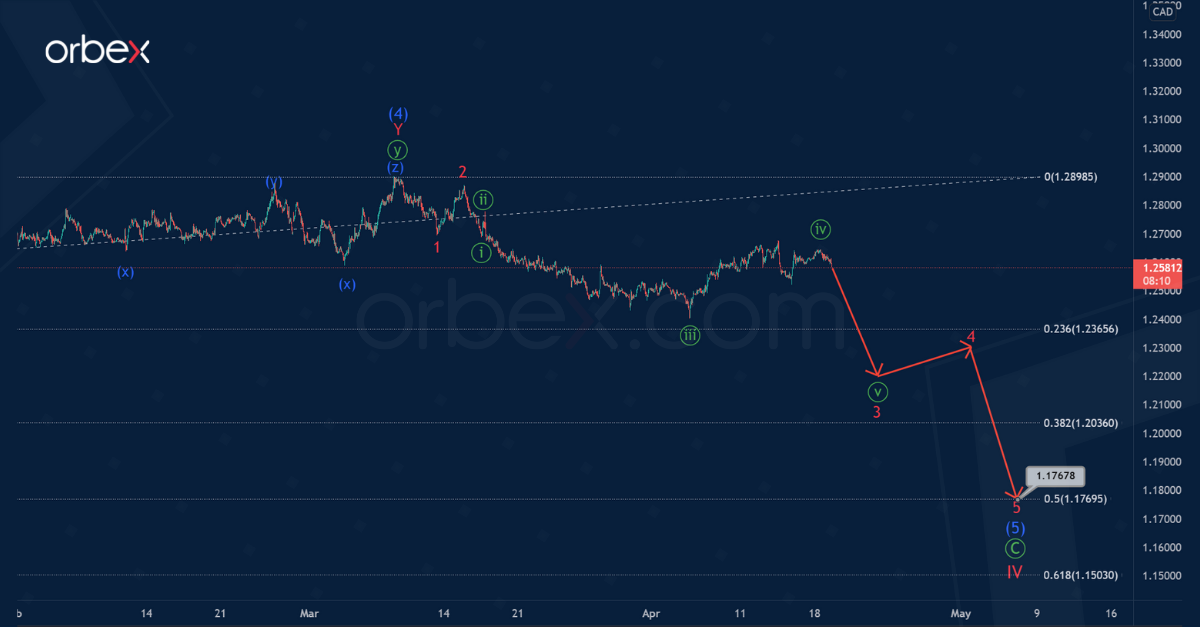
The alternative suggests that the formation of the intermediate correction (4) has ended. In this scenario, it does not have the form of a triple, but of a double zigzag W-X-Y.
Thus, in the last section of the chart, we see the development of the initial part of the intermediate wave (5), which can take the form of a minor impulse 1-2-3-4-5.
If this scenario is confirmed, then in the upcoming trading weeks, market participants can expect an impulse price decline in the 3-4-5 sub-waves, as shown on the chart. And the entire intermediate wave (5) is likely to end near 1.176.
At that level, impulse (5) will be at the 50% Fibonacci extension of intermediate impulse (3).
Time to put your research to the test! Open your Orbex account and start trading now!
![]() Article by Orbex
Article by Orbex
Orbex is a fully licensed broker that was established in 2011. Founded with a mission to serve its traders responsibly and provides traders with access to the world’s largest and most liquid financial markets. www.orbex.com

- The Bank of Canada kept its interest rate unchanged. Platinum prices reached a three‑week high Jul 16, 2026
- Stock indices rose after the release of US inflation data. China’s GDP slowed sharply Jul 15, 2026
- GBP/USD Awaits Political News: What Will Happen Next Jul 15, 2026
- USD/JPY Holds at Highs: Pressure Lingers on Yen Jul 14, 2026
- Oil prices jumped 4% amid a new wave of escalation between the US and Iran Jul 13, 2026
- EUR/USD: US Inflation Will Determine Everything Jul 13, 2026
- COT Metals Charts: Weekly Speculator Bets see small gains for Silver & Gold Jul 12, 2026
- COT Bonds Charts: Speculator Bets led by SOFR 3-Months & 2-Year Bonds Jul 12, 2026
- COT Energy Charts: Weekly Speculator Changes led by Brent Oil Jul 12, 2026
- COT Soft Commodities Charts: Weekly Speculator Changes led by Sugar, Corn & Soybeans Jul 12, 2026