The US dollar rallies as a 75bp rate hike by the Fed could be on the table. The single currency remains under pressure after last week’s sell-off.
1.0920 has become an important supply area after buyers’ failed attempts to push higher. Further above, the psychological level of 1.1000 is another support-turned-resistance, suggesting that the path of least resistance is down.
Bearish trend followers could be waiting to fade the next rebound. The pair is treading water above 1.0760 as the RSI rises back to the neutrality area.
XAUUSD keeps high ground
Gold slipped as the greenback rallied across the board amid the Fed’s increasingly hawkish stance. The previous rally cleared the resistance at 1990 but struggled to grind to the psychological level of 2000.
A drop below 1961 revealed underlying weakness and caused a liquidation of leveraged buyers. 1940 at the base of a previous breakout is the next stop to gauge the bulls’ commitment.
An oversold RSI may trigger a buy-the-dips behavior and lead to a limited rebound. 1980 is now the closest resistance.
SPX 500 breaks channel
The S&P 500 recoups losses as the quarterly earnings season heats up. The index has been sliding down in a bearish channel, which indicates a cautious mood in the short term.
The latest rally above the upper band (4420) and resistance at 4460 could prompt sellers to cover their positions, paving the way for a potential reversal towards 4590.
4360 is a fresh support. In fact, a series of higher lows would show buying interest and convince followers to jump in with both feet. Otherwise, 4300 would be the next support.
Orbex is a fully licensed broker that was established in 2011. Founded with a mission to serve its traders responsibly and provides traders with access to the world’s largest and most liquid financial markets. www.orbex.com
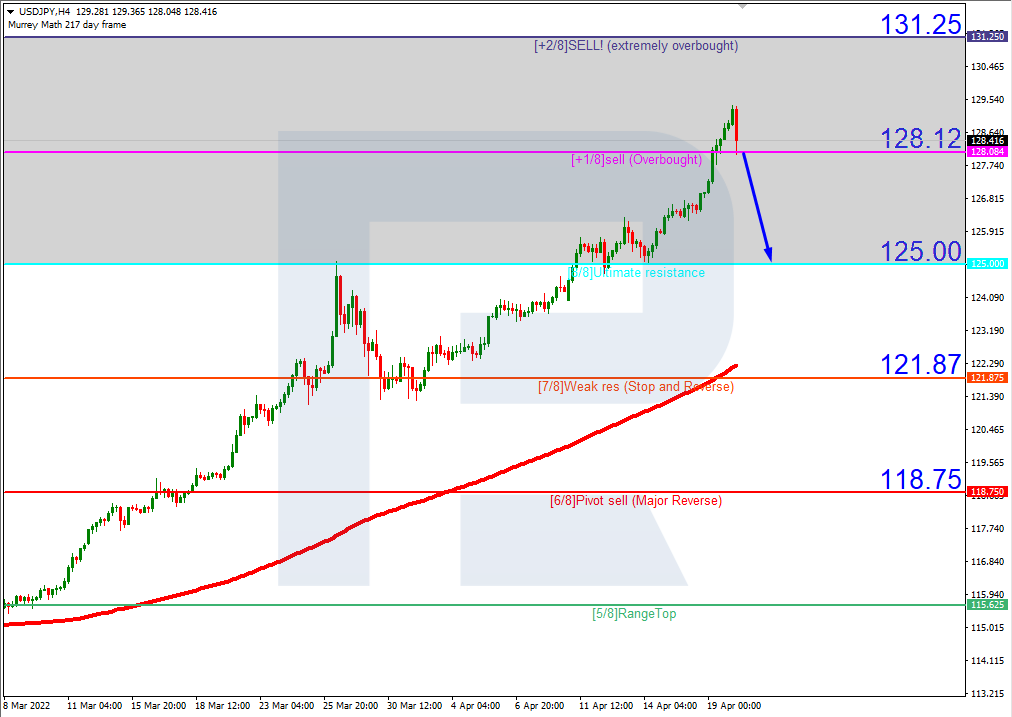
As we can see in the H4 chart, USDJPY is trading within the “overbought area”. In this case, the price is expected to break +1/8 and continue falling to reach the support at 8/8. However, this scenario may no longer be valid if the price breaks the resistance at +2/8 to the upside. After that, the lines in the chart will be redrawn, thus helping us to define new upside targets.
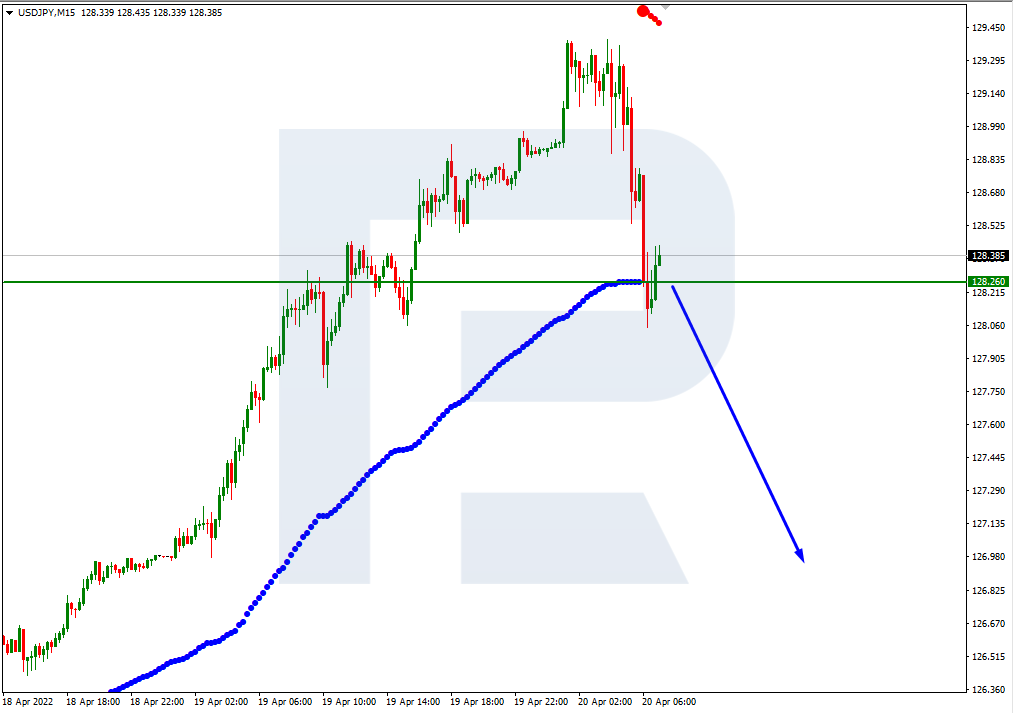
In the M15 chart, the pair may break the downside line of the VoltyChannel indicator and, as a result, continue trading downwards.
USDCAD, “US Dollar vs Canadian Dollar”
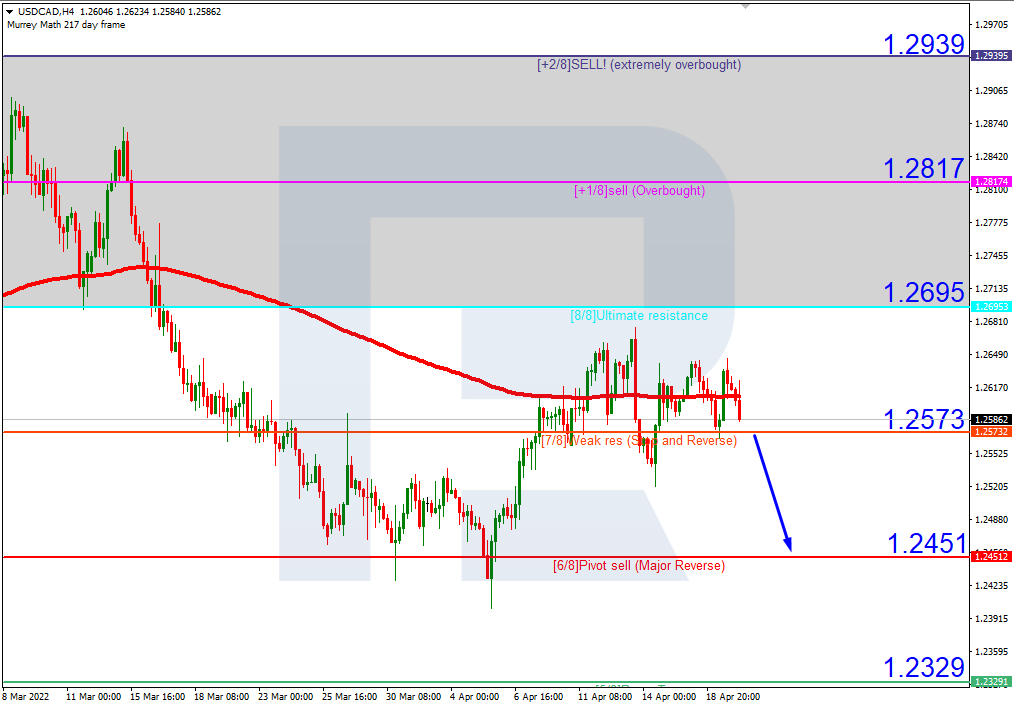
As we can see in the H4 chart, USDCAD is moving at the 200-day Moving Average, thus indicating a sideways tendency. However, the asset is trading not far from the “overbought area”, that’s why it is highly likely to resume falling. To confirm this idea, the pair must break 7/8. In this case, the next downside target will be the support at 6/8. On the other hand, this scenario may no longer be valid if the pair breaks the resistance at 8/8 to the upside. After that, the instrument may reverse and move upwards to reach +1/8.
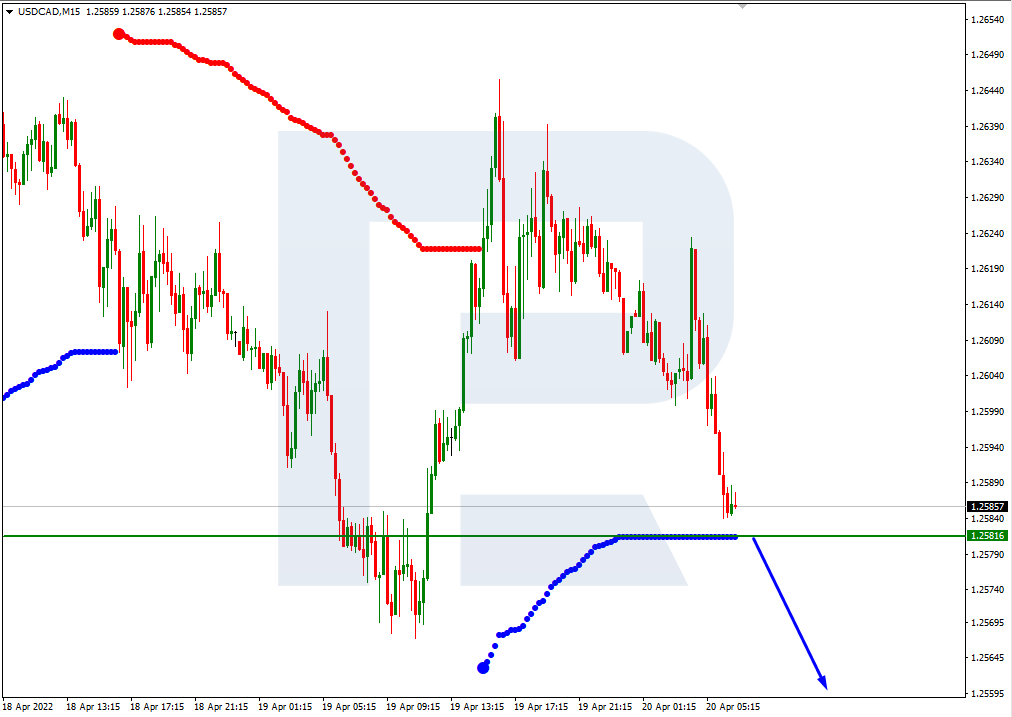
In the M15 chart, the pair may break the downside line of the VoltyChannel indicator and, as a result, continue its decline towards 6/8 in the H4 chart.
Attention! Forecasts presented in this section only reflect the author’s private opinion and should not be considered as guidance for trading. RoboForex LP bears no responsibility for trading results based on trading recommendations described in these analytical reviews.
Minneapolis Fed President Neel Kashkari, a member of the Federal Open Market Committee (FOMC), said on Tuesday that if global supply chain disruptions remain, policymakers will have to take even more aggressive action to lower inflation. Meanwhile, Chicago Fed President Charles Evans, who is not a voting member of the FOMC this year, said he expects two 50-basis-point interest rate hikes at the next meetings. As markets tend to include the price in a future scenario, the dollar index is rising.
From the technical point of view, the trend on the EUR/USD currency pair in the hourly time frame is bearish. The price has taken a more flat structure. The MACD indicator has become inactive. Under such market conditions, it is possible to look for buy trades on intraday timeframes from the support level of 1.0727, but only with short targets and confirmation. Sell trades should be considered from the resistance levels of 1.0844 or 1.0889, but only after the additional confirmation.
Alternative scenario: if the price breaks out through the 1.0958 resistance level and fixes above, the uptrend will likely resume.
News feed for 2022.04.20:
– German Producer Price Index (m/m) at 09:00 (GMT+3);
– Eurozone Industrial Production (m/m) at 12:00 (GMT+3);
– US Existing Home Sales (m/m) at 17:00 (GMT+3).
The GBP/USD currency pair
Technical indicators of the currency pair:
Prev Open: 1.3011
Prev Close: 1.2998
% chg. over the last day: -0.10%
The situation on the GBP/USD currency pair remains the same. The British currency now looks more confident than the euro as the Bank of England raised interest rates three times. Economic data shows no signs of stagflation (slowing economic growth with high inflation). But GBP/USD quotes are declining due to the steady growth of the dollar index due to falling spread between the yields of the US and UK government bonds.
On the hourly time frame, the GBP/USD currency pair trend is still bearish. The MACD indicator has become positive, but there is divergence on the intraday timeframes. Under such market conditions, sell trades should be considered from the resistance level of 1.3094, but with confirmation. For buy deals, traders may consider the level of 1.3002, but only after the appearance of a bullish initiative and with short targets.
Alternative scenario: if the price breaks down through the 1.3147 resistance level and fixes above, the mid-term uptrend will likely be resumed.
There is no news feed for today.
The USD/JPY currency pair
Technical indicators of the currency pair:
Prev Open: 126.94
Prev Close: 128.88
% chg. over the last day: +1.53%
The dollar rose to a 20-year high against the Japanese yen on Tuesday. The opposite policies of the US and Japanese central banks led to a strong uptrend in the USD/JPY currency pair. There is growing dissatisfaction in Japan with ultra-soft monetary policy. Many analysts believe the central bank needs to step in to strengthen the yen temporarily. Morgan Stanley said in its latest research note that the yen’s decline against the dollar was justified by Japan’s deteriorating terms of trade and a surge in commodity prices, which led to higher import costs.
Trading recommendations
Support levels: 128.19, 126.69, 125.72, 124.66, 124.24, 122.97, 122.63, 121.81
Resistance levels: 129.36
The mid-term trend on the USD/JPY currency pair is bullish. The MACD indicator is positive, but there is a divergence on the higher timeframes. The price has significantly deviated from the moving averages and does not make significant pullbacks. Under such market conditions, it is best to look for buy deals, expecting the continuation of the uptrend, but after the price makes a pullback to the average lines. First of all, it is worth considering the support level of 126.69, but with additional confirmation. A resistance level of 129.36 may be considered for sell deals, but only with short targets.
Alternative scenario: If the price fixes below 124.66, the uptrend will likely be broken.
There is no news feed for today.
The USD/CAD currency pair
Technical indicators of the currency pair:
Prev Open: 1.2609
Prev Close: 1.2621
% chg. over the last day: +0.09%
The Canadian dollar is a commodity currency and is highly dependent on the movement of oil prices and the dollar index. The dollar index continued to rise yesterday, while oil prices went down, which caused the USD/CAD to rise. Oil prices jumped about 1% from the opening today after the International Monetary Fund (IMF) lowered its economic growth forecasts. This gave a boost to the Canadian dollar. From the fundamental point of view, the USD/CAD quotes do not have the unified dynamics now as both the Bank of Canada and the US Federal Reserve are aimed to tighten the monetary policy, and the growth in oil prices has a positive effect on the strengthening of the Canadian currency.
Trading recommendations
Support levels: 1.2567, 1.2467
Resistance levels: 1.2644, 1.2713, 1.2754, 1.2851
The USD/CAD currency pair trend is bullish in terms of technical analysis. Currently, the price is trading in the price corridor at the level of the moving averages. The MACD indicator has become inactive. It is worth trading only with short term targets, since there are fundamentally no prerequisites for a medium-term trend on the USD/CAD currency pair. Under such market conditions, it is better to look for buy trades on the lower timeframes from the support level of 1.2567, but it is better with additional confirmation because the level has already been tested. For sell deals, it is better to consider the resistance level of 1.2644, but it is also better with confirmation.
Alternative scenario: if the price breaks through and consolidates below 1.2467, the downtrend will likely be resumed.
News feed for 2022.04.20:
– Canada Consumer Price Index (m/m) at 15:30 (GMT+3);
This article reflects a personal opinion and should not be interpreted as an investment advice, and/or offer, and/or a persistent request for carrying out financial transactions, and/or a guarantee, and/or a forecast of future events.
Inflationary pressures caused by the war in Ukraine are increasing market expectations for an aggressive response from US monetary policymakers, leading to higher US Treasury yields, a rising dollar index, and a falling yen. The 10-year US Treasury bonds reached 2.9% yesterday for the first time since 2018, but that didn’t spoil investor sentiment as their focus is now on quarterly earnings, and investors are betting on growth in the technology sector. As the stock market closed yesterday, the Dow Jones Index (US30) increased by 1.61%, and the S&P 500 Index (US500) added 1.61%. NASDAQ Technology Index (US100) jumped by 2.15%.
Netflix stock fell more than 23% on the report in the last trading session. The report of a decline in subscribers in the first quarter fell short of analysts’ expectations. The streaming service Netflix lost 200,000 subscribers due to inflation and competition in the market. The service lost another 700,000 subscribers after it exited the Russian market. At the same time, analysts predicted an increase of 2.5 million people.
Tesla investors will be looking forward today to see if the electric car company will keep its ambitious 2022 delivery targets, as operations at its largest plant in Shanghai are limited due to the COVID-19 outbreak in the region and new plants are slow to ramp up capacity. But it should be noted that Kathy Wood’s Ark Invest fund predicts Tesla stock will more than quadruple to $4600 by 2026 as mass electrification of cars in the future.
Major European indices closed yesterday in the red zone. German DAX (DE30) decreased by 0.07% yesterday, French CAC 40 (FR 40) fell by 0.83%, Spanish IBEX 35 (ES35) lost 0.06%, British FTSE 100 (UK100) decreased by 0.20%. European markets are under price pressure because of the war in Ukraine. Record inflation in the region and uncertainty about the ECB’s actions are the main reasons for the euro’s decline. Meanwhile, the Swiss National Bank (SNB) considers the current rise in inflation a temporary phenomenon, Chairman Thomas Jordan said on Tuesday. Central banks, including the US Federal Reserve and the Bank of England, have already started to raise interest rates to fight rising prices, though the SNB is still holding the lowest interest rate globally at -0.75%. And this is despite the fact that inflation in Switzerland jumped by 2.4% in March from a year earlier, the highest level in recent years.
The International Monetary Fund lowered its forecast for global growth by 3.6% in 2022 and 2023 from previous forecasts of 4.4% and 3.8%, respectively.
Oil prices rose about 1% on Wednesday, recouping some of their losses in the previous session because of concerns about energy demand after the International Monetary Fund (IMF) lowered its economic growth forecasts. The situation in the oil market is extremely uncertain now. On the one hand, the EU’s rejection of Russian oil may increase the already high deficit. On the other hand, the US and its partners are going to release strategic reserves in order to lower oil prices.
European automaker Stellantis N.V. will stop production at its plant in Kaluga. Also, the US General Motors is getting ready for its final exit from the Russian market: dealers have been notified that they will stop supplying cars and parts and the Russian office’s employees have been laid off.
Russians are being offered to buy Visa and MasterCard cards from a number of CIS countries on the Internet, as well as virtual cards from a US bank. It will be possible to pay for them abroad, replenish foreign services and withdraw currency in cash while traveling. The cards of Uzbekistan, Georgia, Serbia, and Kyrgyzstan are offered.
The founder of Tinkoff Bank (the parent company of TCS Group) Oleg Tinkov appealed to Western countries to be “more rational and humane” to help stop the war in Ukraine, where innocent people and soldiers were killed. The billionaire opposes the war in Ukraine. Tinkoff Bank declined to comment on Tinkov’s personal opinion, recalling that he is not a decision-maker in Tinkoff Group companies, has not been in Russia for a long time, and has been dealing with his health in recent years.
Asian stock markets traded yesterday without a single trend. Japan’s Nikkei 225 (JP225) increased by 0.69% yesterday, Hong Kong’s Hang Seng (HK50) fell by 2.28%, and Australia’s S&P/ASX 200 (AU200) jumped by 0.56%. China’s yuan hit its lowest level since October after the central bank promised support for the service sector and left the Loan Prime Rate unchanged. To the surprise of many analysts, China kept its benchmark lending rates for corporations and households unchanged, which runs counter to the global trend of tighter monetary policy. Japan recorded a trade deficit in March that was more than four times higher than market forecasts, as exports to China slowed sharply, and soaring energy prices increased the cost of imports, exacerbating economic problems caused by the war in Ukraine.
Main market quotes:
S&P 500 (F) (US500) 4,462.21 +70.52 (+1.61%)
Dow Jones (US30) 34,911.20 +499.51 (+1.45%)
DAX (DE40) 14,153.46 −10.39 (−0.073%)
FTSE 100 (UK100) 7,601.28 −15.10 (−0.20%)
USD Index 100.98 +0.19 (+0.19%)
Important events for today:
– China Loan Prime Rate (m/m) at 04:15 (GMT+3);
– German Producer Price Index (m/m) at 09:00 (GMT+3);
– Eurozone Industrial Production (m/m) at 12:00 (GMT+3);
– Canada Consumer Price Index (m/m) at 15:30 (GMT+3);
This article reflects a personal opinion and should not be interpreted as an investment advice, and/or offer, and/or a persistent request for carrying out financial transactions, and/or a guarantee, and/or a forecast of future events.
“Even short term, diverging trends can signal an unhealthy market”
By Elliott Wave International
If you’ve been an investor for any appreciable length of time, no doubt you’ve noticed that all of the stock market indexes usually move in unison.
For example, when the Dow Industrials rally, the S&P 500 and NASDAQ usually do so too — the same applies during a broad downtrend.
As the April 8 U.S. Short Term Update, a thrice weekly Elliott Wave International publication which provides near-term forecasts for key U.S. financial markets, notes:
Think of the final days of [the big down wave] in March 2009, at the end of the Dow’s 54% decline from October 2007. Nearly every stock index made a low within days of March 9, 2009 — blue chips, technology, small caps, transports, secondary stock indexes — and all rallied in unison thereafter.
However, when stock indexes begin to diverge, this is usually a sign that the existing trend is about to reverse.
As a case in point, let’s return to that 2007-2009 bear market that was just mentioned. However, this time, let’s look at its beginning.
This chart and commentary are from the Sept. 26, 2007 U.S. Short Term Update:
Here’s the structure in the DJIA, which is the strongest of the blue-chip indexes. The pattern is similar in the S&P with the main difference being that the S&P did not push above last week’s high … leaving a short-term inter-market bearish divergence.
About two weeks after that analysis, the Dow and S&P topped — kicking off a nearly year-and-a-half bear market.
Let’s return to 2022 and additional commentary from the April 8 U.S. Short Term Update:
Even short term, diverging trends can signal an unhealthy market, depending of course on context.
Short term trends are diverging.
The very next trading (April 11), the Dow Industrials tumbled more than 400 points. And, as of this intraday writing on April 12, the Dow is down about 145 points.
As you might imagine, the Elliott wave model puts the recent, short-term diverging trends into context.
In other words, by reviewing the Elliott wave structures of the main stock indexes, you can get a good idea if those 400- and 145-point drops are part of a short-term correction or the start of a prolonged downtrend.
If you’d like to delve into the details of how to analyze financial markets using the Elliott wave model, you are encouraged to read Frost & Prechter’s Elliott Wave Principle: Key to Market Behavior. Here’s a quote from that book:
Every wave serves one of two functions: action or reaction. Specifically, a wave may either advance the cause of the wave of one larger degree or interrupt it. The function of a wave is determined by its relative direction. An actionary or trend wave is any wave that trends in the same direction as the wave of one larger degree of which it is a part. A reactionary or countertrend wave is any wave that trends in the direction opposite to that of the wave of one larger degree of which it is part. Actionary waves are labeled with odd numbers and letters. Reactionary waves are labeled with even numbers and letters.
Exciting news! You can read the entire online version of the book for free once you become a Club EWI member. In case you don’t know, Club EWI is the world’s largest Elliott wave educational community.
Don’t worry about cost — A Club EWI membership is free. More than that, members enjoy free access to an abundance of Elliott wave resources on financial markets, investing and trading — without any obligation.
This article was syndicated by Elliott Wave International and was originally published under the headline This Usually Spells Trouble for the Stock Market (It’s Happening Now). EWI is the world’s largest market forecasting firm. Its staff of full-time analysts led by Chartered Market Technician Robert Prechter provides 24-hour-a-day market analysis to institutional and private investors around the world.
People in the world’s developed nations live in a post-industrial era, working mainly in service or knowledge industries. Manufacturers increasingly rely on sensors, robots, artificial intelligence and machine learning to replace human labor or make it more efficient. Farmers can monitor crop health via satellite and apply pesticides and fertilizers with drones.
Commercial fishing, one of the oldest industries in the world, is a stark exception. Industrial fishing, with factory ships and deep-sea trawlers that land thousands of tons of fish at a time, are still the dominant hunting mode in much of the world.
The end product is largely a commodity that travels around the world like a manufactured part or digital currency, rather than fresh domestic produce from the sea. An average fish travels 5,000 miles before reaching a plate, according to sustainable-fishing advocates. Some is frozen, shipped to Asia for processing, then refrozen and returned to the U.S.
But these patterns are starting to change. In my new book, “The Blue Revolution: Hunting, Harvesting, and Farming Seafood in the Information Age,” I describe how commercial fishing has begun an encouraging shift toward a less destructive, more transparent post-industrial era. This is true in the U.S., Scandinavia, most of the European Union, Iceland, New Zealand, Australia, South Korea, the Philippines and much of South America.
Sustainable fishing limits catches at or below levels that fisheries can replace at their natural reproductive pace.
Fishing with data
Changes in behavior, technology and policy are occurring throughout the fishing industry. Here are some examples:
Global Fishing Watch, an international nonprofit, monitors and creates open-access visualizations of global fishing activity on the internet with a 72-hour delay. This transparency breakthrough has led to the arrest and conviction of owners and captains of boats fishing illegally.
The Global Dialogue on Seafood Traceability, an international business-to-business initiative, creates voluntary industry standards for seafood traceability. These standards are designed to help harmonize various systems that track seafood through the supply chain, so they all collect the same key information and rely on the same data sources. This information lets buyers know where their seafood comes from and whether it was produced sustainably.
Fishing boats in New Bedford, Massachusetts – the top U.S. fishing port, based on total catch value – are rigged with sensors to develop a Marine Data Bank that will give fishermen data on ocean temperature, salinity and oxygen levels. Linking this data to actual stock behavior and catch levels is expected to help fishermen target certain species and avoid unintentional bycatch.
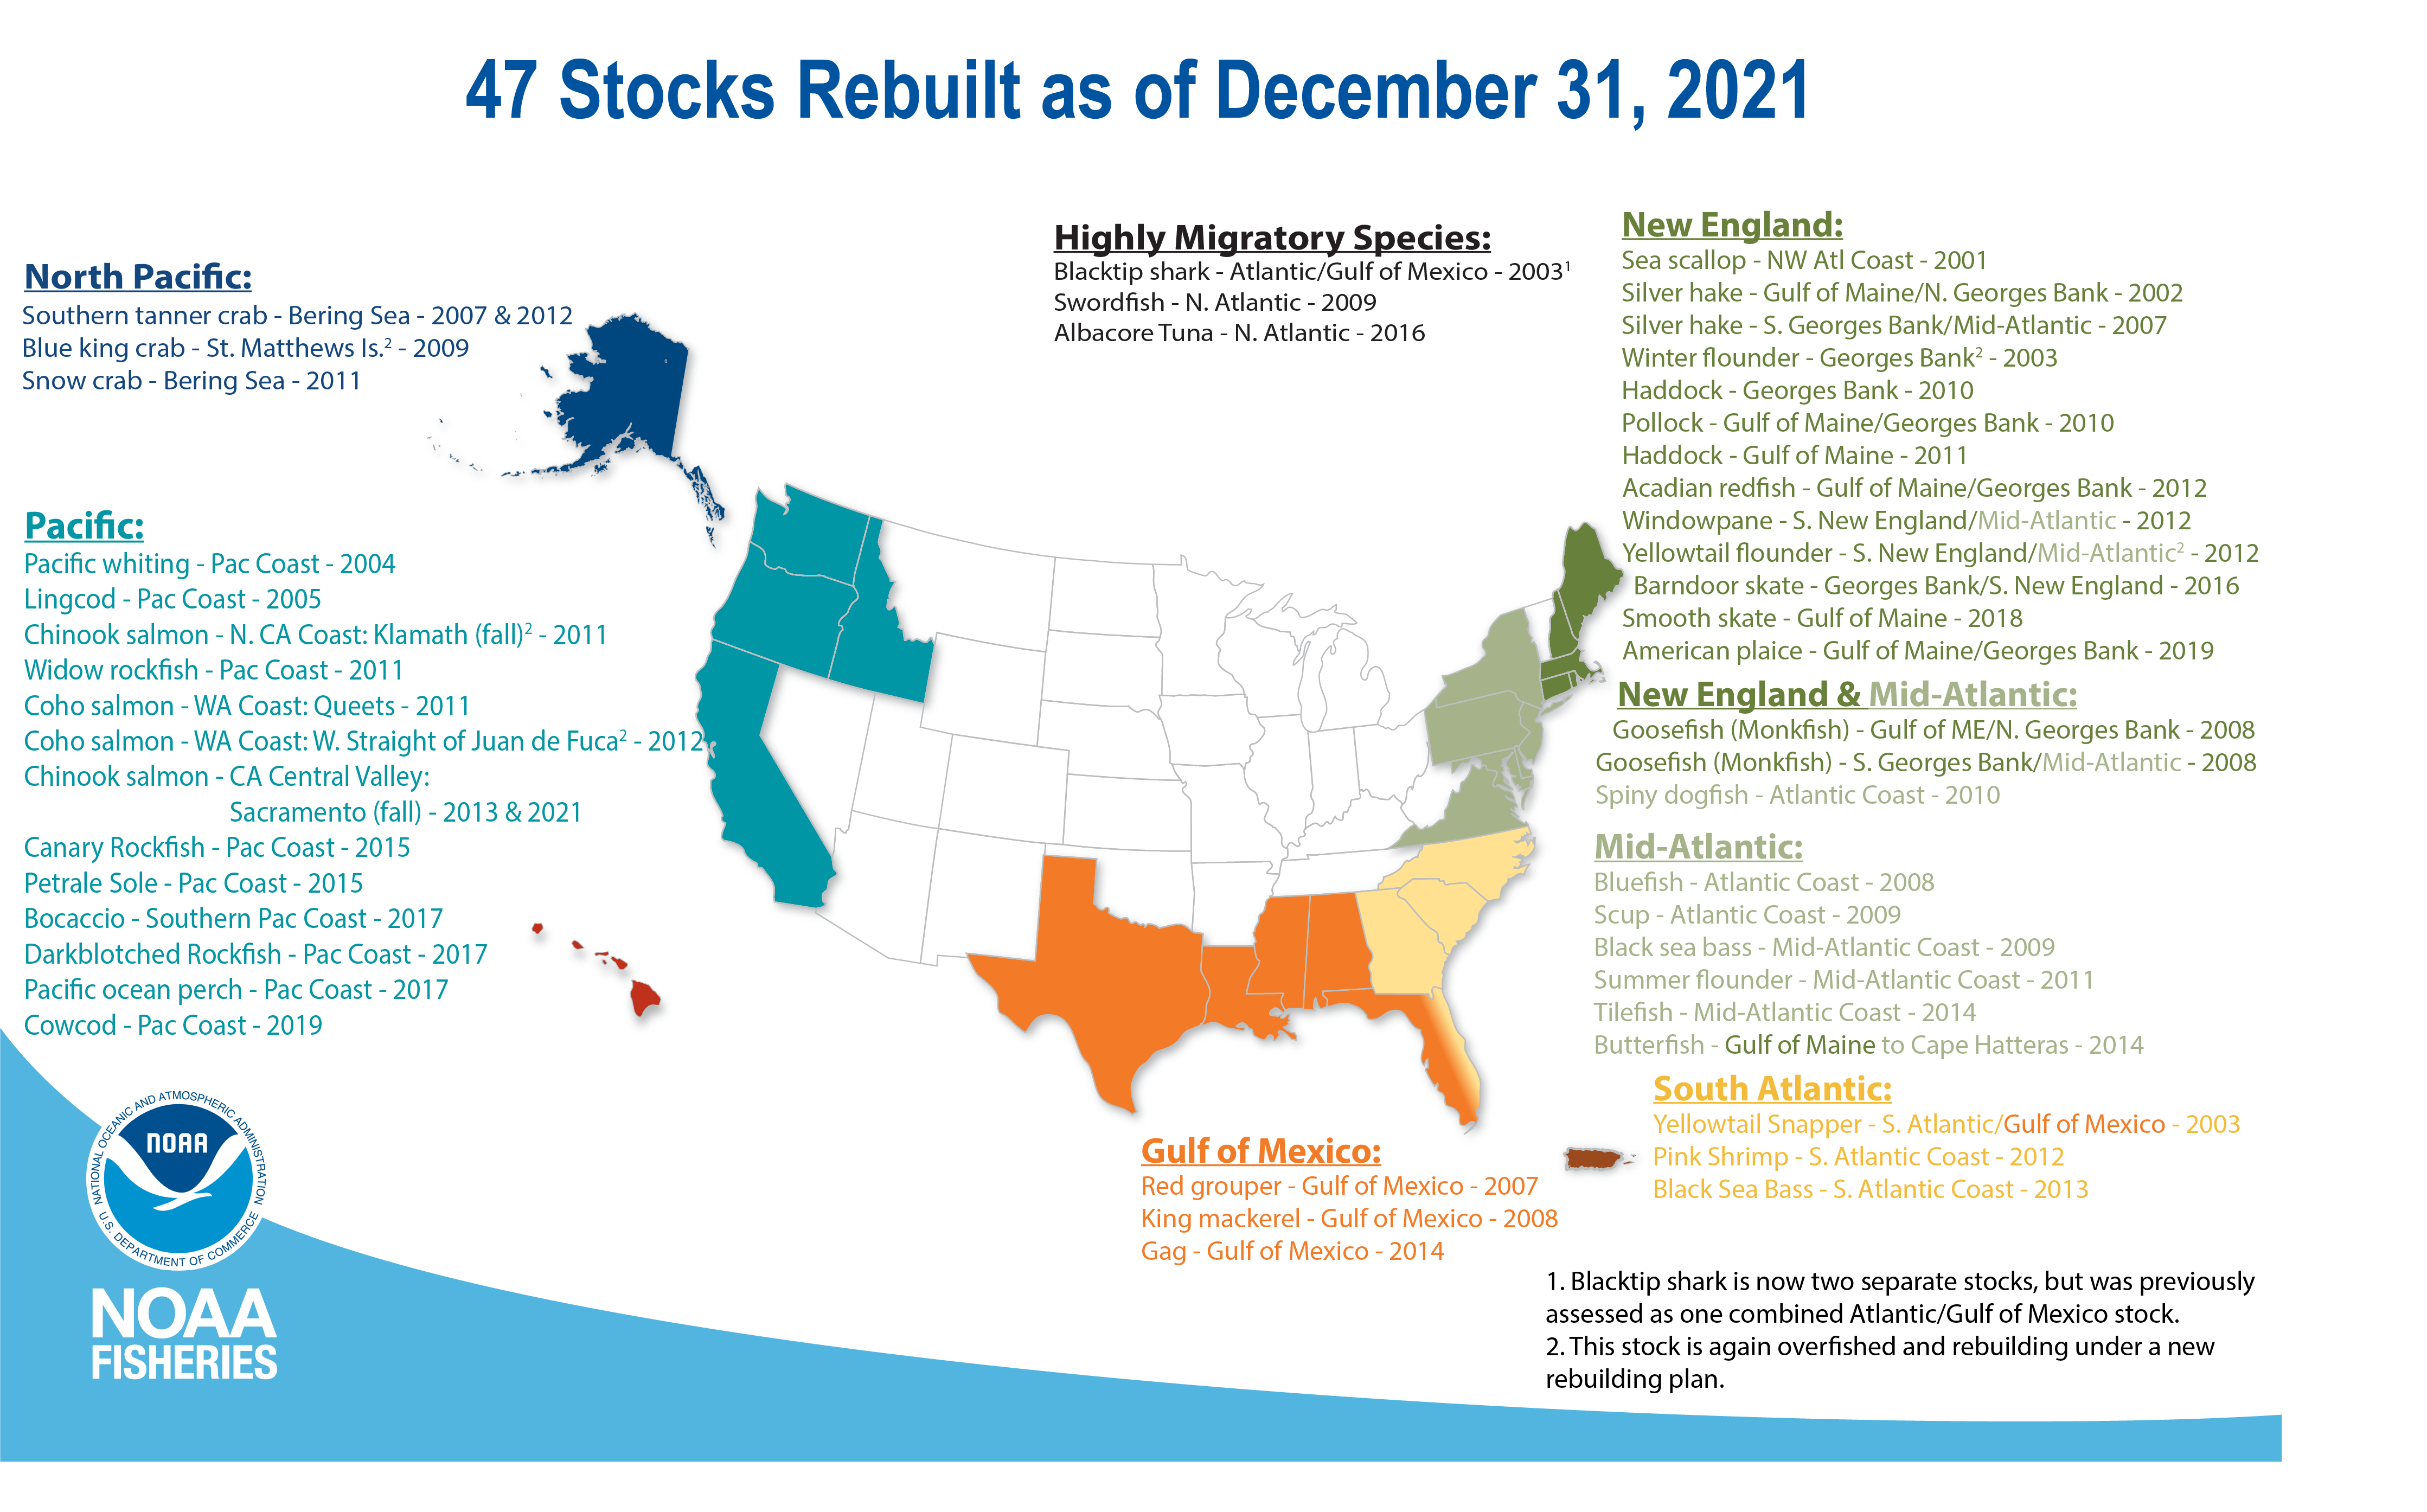
Annual catch limits, divvied up through individual quotas for each fisherman, have helped curb overfishing. Imposing catch shares can be highly controversial, but since the year 2000, 47 U.S. stocks that were overfished and shut down have been rebuilt and reopened for fishing, thanks to policy judgments based on the best available science. Examples include Bering Sea snow crab, North Atlantic swordfish and red grouper in the Gulf of Mexico.
A growing “fishie” movement that mirrors the widespread “foodie” locavore movement has been gaining steam for more than a decade. Taking a page from agriculture, subscribers to community-supported fisheries pay in advance for regular deliveries from local fishermen. Such engagement between consumers and producers is beginning to shape buying patterns and introduce consumers to new types of fish that are abundant but not iconic like the cod of yore.
Industrial-scale ocean salmon farming in Norway in the 1990s was largely responsible for the perception that farmed fish were bad for wild fish and ocean habitats. Today this industry has moved to less dense deep-water offshore pens or land-based recirculating systems.
Virtually all new salmon farms in the U.S. – in Florida, Wisconsin, Indiana, and several planned for Maine and California – are land-based. In some cases, water from the fish tanks circulates through greenhouses to grow vegetables or hemp, a system called aquaponics.
There is heated debate over proposals to open U.S. federal waters, between 3 and 200 miles offshore, for ocean aquaculture. Whatever the outcome, it’s clear that without a growing mariculture industry, the U.S. won’t be able to reduce and may even widen its $17 billion seafood trade deficit.
Vancouver, Canada-based Willowfield Enterprises raises coho salmon in recirculating tanks on land.
A voracious China
This kind of progress isn’t uniform throughout the fishing industry. Notably, China is the world’s top seafood producer, accounting for 15% of the global wild catch as well as 60% of aquaculture production. Chinese fishing exerts huge influence on the oceans. Observers estimate that China’s fishing fleet may be as large as 800,000 vessels and its distant-water fleet may include up to 17,000 vessels, compared to 300 for the U.S.
Most Chinese distant-water ships are so large that they scoop up as many fish in one week as local boats from Senegal or Mexico might catch in a year. Much of this fishing would not be profitable without government subsidies. Clearly, holding China to higher standards is a priority for maintaining healthy global fisheries.
The ocean’s restorative power
There is no shortage of gloomy information about how overfishing, along with other stresses like climate change, is affecting the world’s oceans. Nonetheless, I believe it bears emphasizing that over 78% of current marine fish landings come from biologically sustainable stocks, according to the United Nations. And overharvested fisheries often can rebound with smart management.
Another success story is Cabo Pulmo, a five-mile stretch of coast at the southeast end of Mexico’s Baja Peninsula. Once a vital fishing ground, Cabo Pulmo was barren in the early 1990s after intense overfishing. Then local communities persuaded the Mexican government to turn the area into a marine park where fishing was barred.
“In 1999, Cabo Pulmo was an underwater desert. Ten years later, it was a kaleidoscope of life and color,” ecologist Enric Sala, director of National Geographic’s Pristine Seas Project, observed in 2018.
Scientists say that thanks to effective management, marine life in Cabo Pulmo has recovered to a level that makes the reserve comparable to remote, pristine sites that have never been fished. Fishing outside of the refuge has also rebounded, showing that conservation and fishing are not incompatible. In my view, that’s a good benchmark for a post-industrial ocean future.
About the Author:
Nicholas P. Sullivan, Senior Research Fellow, Fletcher Maritime Studies Program, and Senior Fellow, Council on Emerging Market Enterprises, Tufts University
“You can do it quickly, you can do it cheaply, or you can do it right. We did it right.” These were some of the opening remarks from David Toback, leader of the Collider Detector at Fermilab, as he announced the results of a decadelong experiment to measure the mass of a particle called the W boson.
I am a high energy particle physicist, and I am part of the team of hundreds of scientists that built and ran the Collider Detector at Fermilab in Illinois – known as CDF.
After trillions of collisions and years of data collection and number crunching, the CDF team found that the W boson has slightly more mass than expected. Though the discrepancy is tiny, the results, described in a paper published in Science on April 7, 2022, have electrified the particle physics world. If the measurement is correct, it is yet another strong signal that there are missing pieces to the physics puzzle of how the universe works.
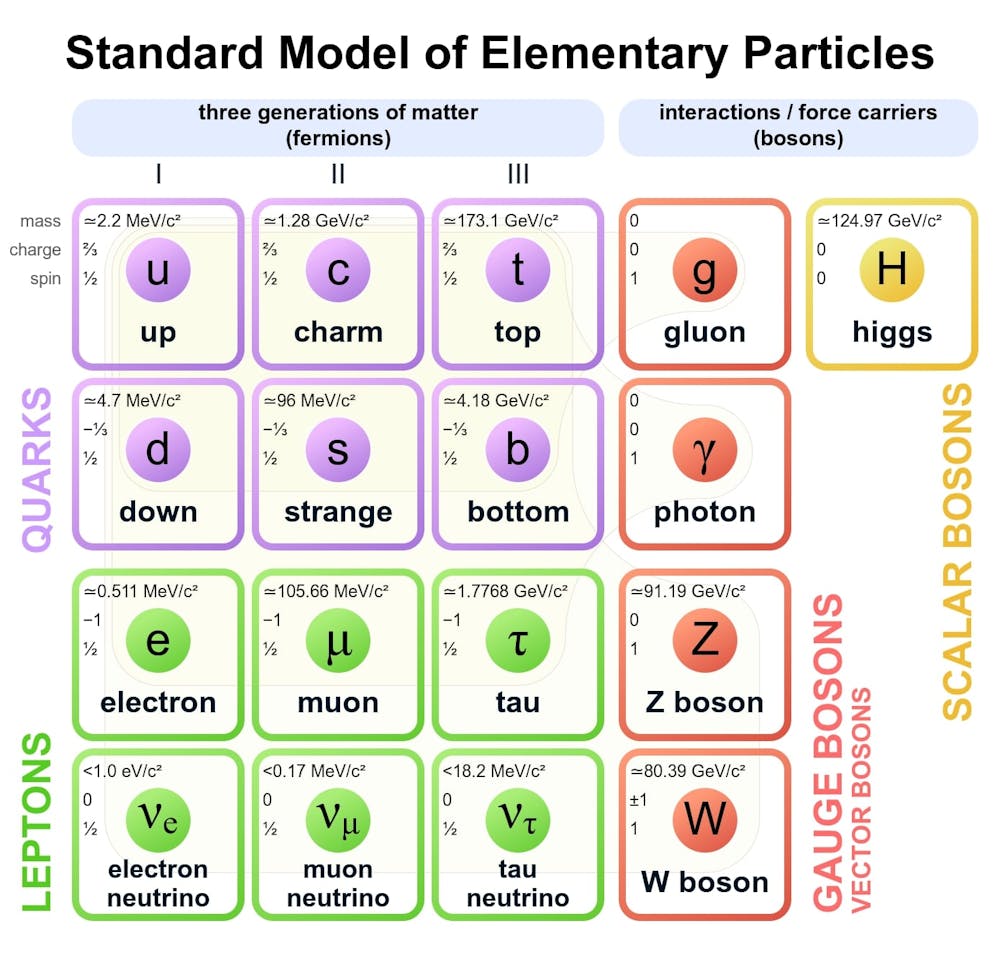
The Standard Model of particle physics describes the particles that make up the mass and forces of the universe. MissMJ/WikimediaCommons
The strong force holds atomic nuclei together. But some nuclei are unstable and undergo radioactive decay, slowly releasing energy by emitting particles. This process is driven by the weak force, and since the early 1900s, physicists sought an explanation for why and how atoms decay.
According to the Standard Model, forces are transmitted by particles. In the 1960s, a series of theoretical and experimental breakthroughs proposed that the weak force is transmitted by particles called W and Z bosons. It also postulated that a third particle, the Higgs boson, is what gives all other particles – including W and Z bosons – mass.
Since the advent of the Standard Model in the 1960s, scientists have been working their way down the list of predicted yet undiscovered particles and measuring their properties. In 1983, two experiments at CERN in Geneva, Switzerland, captured the first evidence of the existence of the W boson. It appeared to have the mass of roughly a medium-sized atom such as bromine.
By the 2000s, there was just one piece missing to complete the Standard Model and tie everything together: the Higgs boson. I helped search for the Higgs boson on three successive experiments, and at last we discovered it in 2012 at the Large Hadron Collider at CERN.
The Standard Model was complete, and all the measurements we made hung together beautifully with the predictions.
The Collider Detector at Fermilab collected data from trillions of collisions that produced millions of W bosons. Bodhita/WikimediaCommons, CC BY-SA
Measuring W bosons
Testing the Standard Model is fun – you just smash particles together at very high energies. These collisions briefly produce heavier particles that then decay back into lighter ones. Physicists use huge and very sensitive detectors at places like Fermilab and CERN to measure the properties and interactions of the particles produced in these collisions.
In CDF, W bosons are produced about one out of every 10 million times when a proton and an antiproton collide. Antiprotons are the antimatter version of protons, with exactly the same mass but opposite charge. Protons are made of smaller fundamental particles called quarks, and antiprotons are made of antiquarks. It is the collision between quarks and antiquarks that create W bosons. W bosons decay so fast that they are impossible to measure directly. So physicists track the energy produced from their decay to measure the mass of W bosons.
In the 40 years since scientists first detected evidence of the W boson, successive experiments have attained ever more precise measurements of its mass. But it is only since the measurement of the Higgs boson – since it gives mass to all other particles – that researchers could check the measured mass of W bosons against the mass predicted by the Standard Model. The prediction and the experiments always matched up – until now.
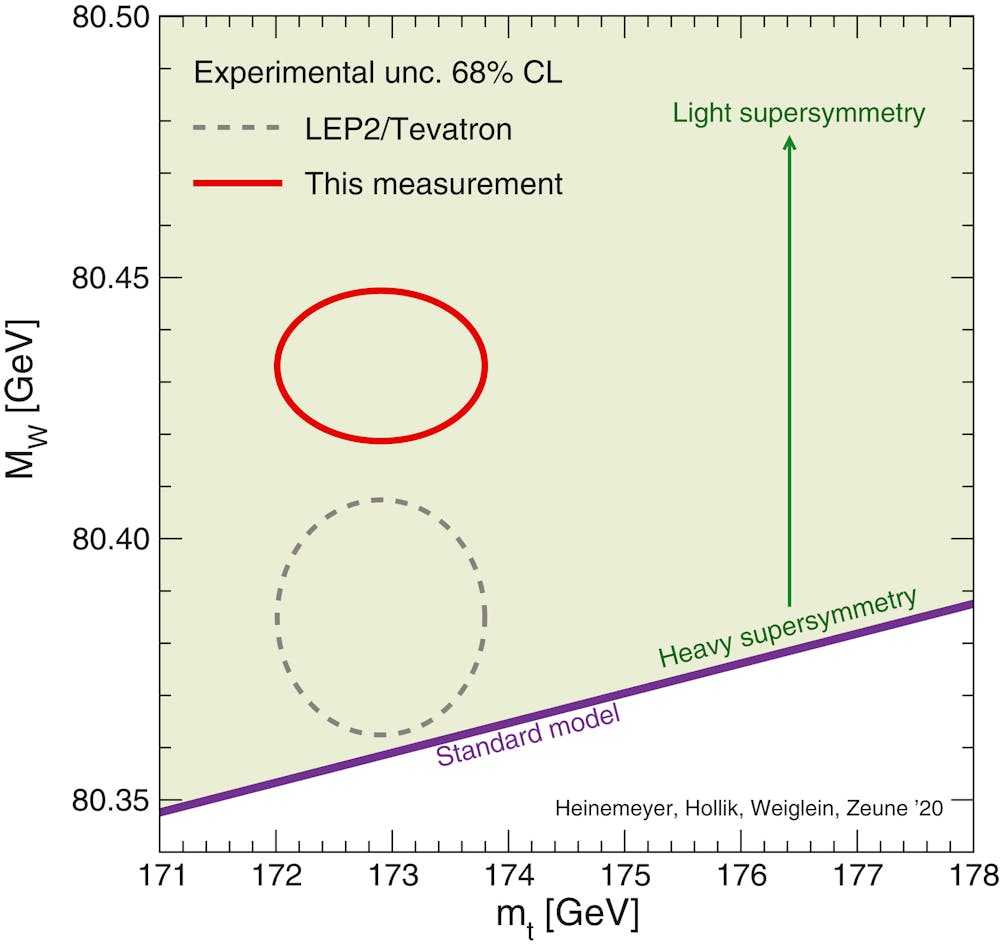
The new measurement of the W boson (red circle) is much farther from the mass predicted by the Standard Model (purple line) and also greater than the preliminary measurement from the experiment. CDF Collaboration via Science Magazine, CC BY
Unexpectedly heavy
The CDF detector at Fermilab is excellent at accurately measuring W bosons. From 2001 to 2011, the accelerator collided protons with antiprotons trillions of times, producing millions of W bosons and recording as much data as possible from each collision.
The Fermilab team published initial results using a fraction of the data in 2012. We found the mass to be slightly off, but close to the prediction. The team then spent a decade painstakingly analyzing the full data set. The process included numerous internal cross-checks and required years of computer simulations. To avoid any bias creeping into the analysis, nobody could see any results until the full calculation was complete.
When the physics world finally saw the result on April 7, 2022, we were all surprised. Physicists measure elementary particle masses in units of millions of electron volts – shortened to MeV. The W boson’s mass came out to be 80,433 MeV – 70 MeV higher than what the Standard Model predicts it should be. This may seem like a tiny excess, but the measurement is accurate to within 9 MeV. This is a deviation of nearly eight times the margin of error. When my colleagues and I saw the result, our reaction was a resounding “wow!”
What this means for the Standard Model
The fact that the measured mass of the W boson doesn’t match the predicted mass within the Standard Model could mean three things. Either the math is wrong, the measurement is wrong or there is something missing from the Standard Model.
First, the math. In order to calculate the W boson’s mass, physicists use the mass of the Higgs boson. CERN experiments have allowed physicists to measure the Higgs boson mass to within a quarter-percent. Additionally, theoretical physicists have been working on the W boson mass calculations for decades. While the math is sophisticated, the prediction is solid and not likely to change.
The next possibility is a flaw in the experiment or analysis. Physicists all over the world are already reviewing the result to try to poke holes in it. Additionally, future experiments at CERN may eventually achieve a more precise result that will either confirm or refute the Fermilab mass. But in my opinion, the experiment is as good a measurement as is currently possible.
That leaves the last option: There are unexplained particles or forces causing the upward shift in the W boson’s mass. Even before this measurement, some theorists had proposed potential new particles or forces that would result in the observed deviation. In the coming months and years, I expect a raft of new papers seeking to explain the puzzling mass of W bosons.
As a particle physicist, I am confident in saying that there must be more physics waiting to be discovered beyond the Standard Model. If this new result holds up, it will be the latest in a series of findings showing that the Standard Model and real-world measurements often don’t quite match. It is these mysteries that give physicists new clues and new reasons to keep searching for fuller understanding of matter, energy, space and time.
– Back in February, I shared with you an updated monthly chart of gold futures with a completed Cup & Handle pattern just ahead of a potential breakout above the preset trigger.
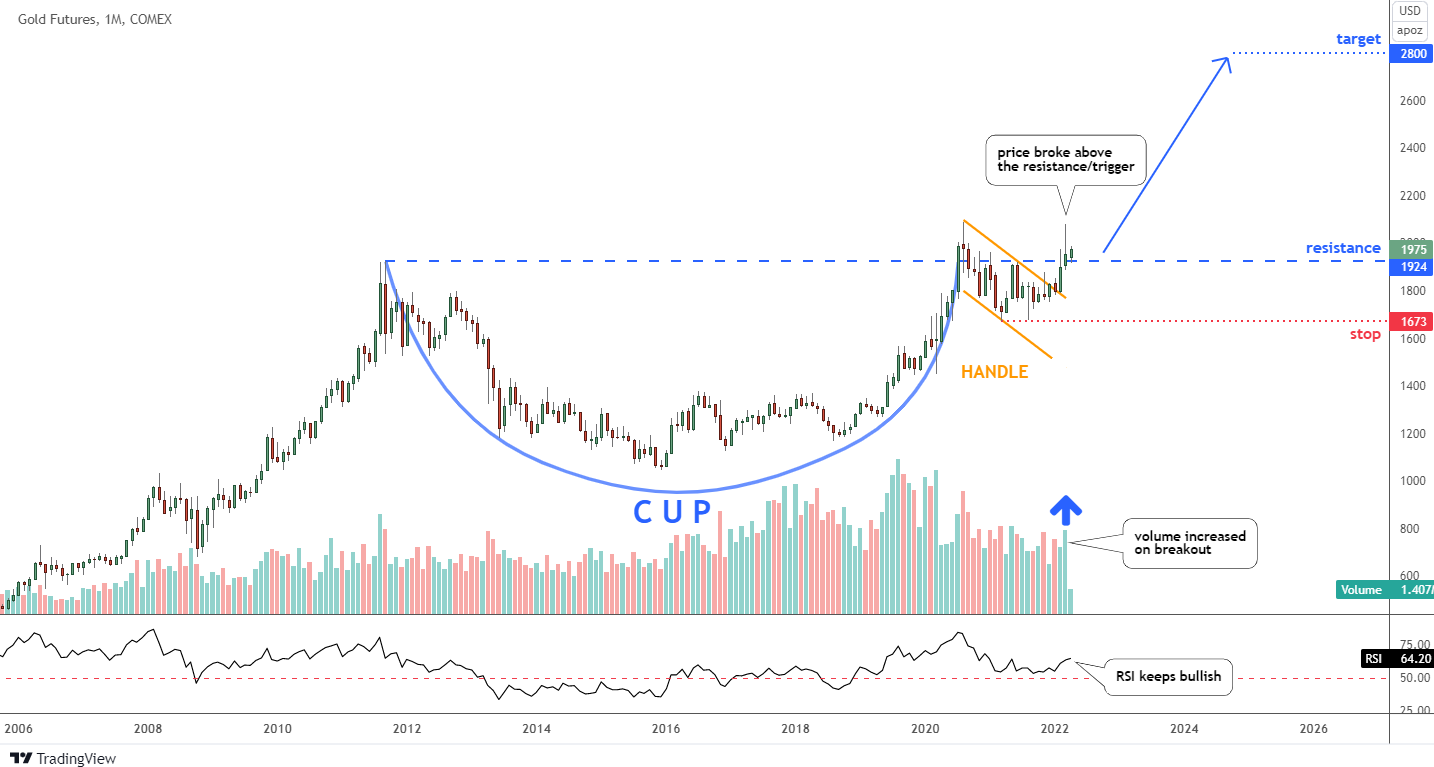
Most readers supported the ambitious target of $2,800 for that exact pattern. So let’s check on the chart below and see how it plays out these days.
Indeed, the bullish impulse gathered enough power to break above the resistance that acted as a trigger for this pattern. The volume increased significantly, as it was required to overcome the barrier and confirm the breakout. The RSI has supported that rally as it turned north, either.
The candle of March has a long upper shadow as the price of gold failed to crack the all-time high of $2,089 despite a strong rally. It stopped just ten dollars away at $2,079; then the price dropped like a rock losing almost two hundred bucks to $1,888. However, the metal has managed to close that month in green at $1,954, still above the trigger of $1,924.
The current month of April has a bullish candle on the price chart, and the RSI keeps above the support. The odds are still in favor of bulls, and the following chart with a lower time frame supports that outlook.
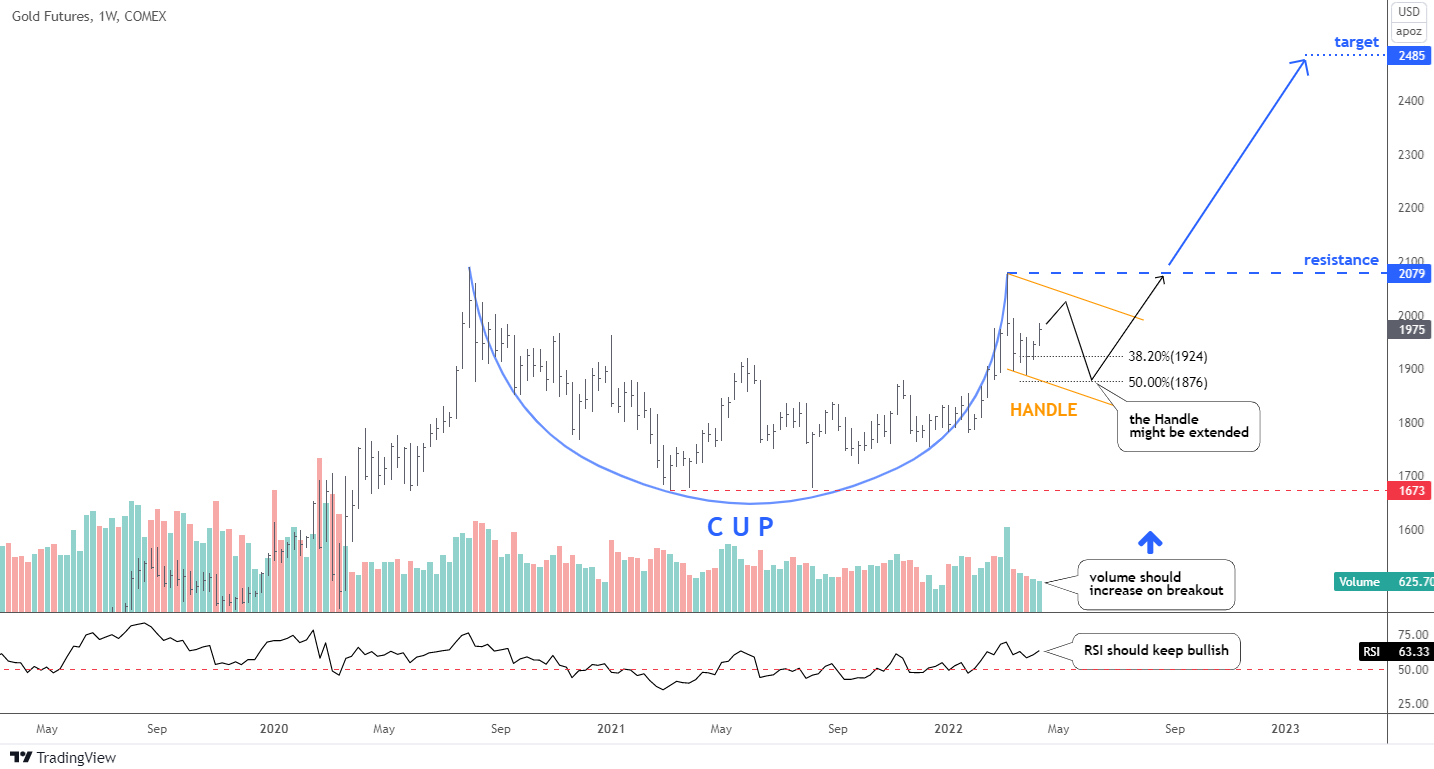
You might have thought that you have already seen this chart with the same pattern before. However, this is a brand new chart with a weekly period. One thing has been repeated for sure, the Cup & Handle bullish pattern. On the monthly chart above, this part looks smaller. It is located on the right side after the Cup.
This Cup (blue) has an almost ideal shape, as its tops are located in the same price area. The Handle (orange) has dipped to the regular Fibonacci retracement levels between 38.2 ($1,924) and 50 ($1,876) percent. This part might be extended as I highlighted it within a black zigzag. However, it should not drop too deep into the area of the Cup not to invalidate it.
The bullish trigger has been set at the most recent top of $2,079. The upside target for this smaller pattern is located closer indeed at $2,485, which is still awesome. It was calculated by adding the depth of the Cup to the breakout point (resistance).
The volume is in the valley part of the range, and it should grow significantly when the price of gold would come first for a breakout above the Handle and then to overcome the resistance.
The RSI indicator should stay above the “waterline” to support bulls.
Disclosure: This contributor has no positions in any stocks mentioned in this article. This article is the opinion of the contributor themselves. The above is a matter of opinion provided for general information purposes only and is not intended as investment advice. This contributor is not receiving compensation (other than from INO.com) for their opinion.
Calling all beginner Forex traders! We’ve put together a comprehensive webinar dedicated to teaching you how to trade the financial markets!
Next Tuesday, April 26th our seasoned market expert David Kindley will be going live on Zoom to offer you a comprehensive beginners guide to Elliott Waves.
Sign up now for a chance to learn:
The Basics of Elliott Waves
Identifying the Wave Counts
Explaining Wave Formations
Riding the Waves to Prosperity
The webinar is free to attend, but seats are limited.
Book your spot today to start trading responsibly!
Orbex is a fully licensed broker that was established in 2011. Founded with a mission to serve its traders responsibly and provides traders with access to the world’s largest and most liquid financial markets. www.orbex.com
Russia used a hypersonic missile against a Ukrainian arms depot in the western part of the country on March 18, 2022. That might sound scary, but the technology the Russians used is not particularly advanced. However, next-generation hypersonic missiles that Russia, China and the U.S. are developing do pose a significant threat to national and global security.
I am an aerospace engineer who studies space and defense systems, including hypersonic systems. These new systems pose an important challenge due to their maneuverability all along their trajectory. Because their flight paths can change as they travel, these missiles must be tracked throughout their flight.
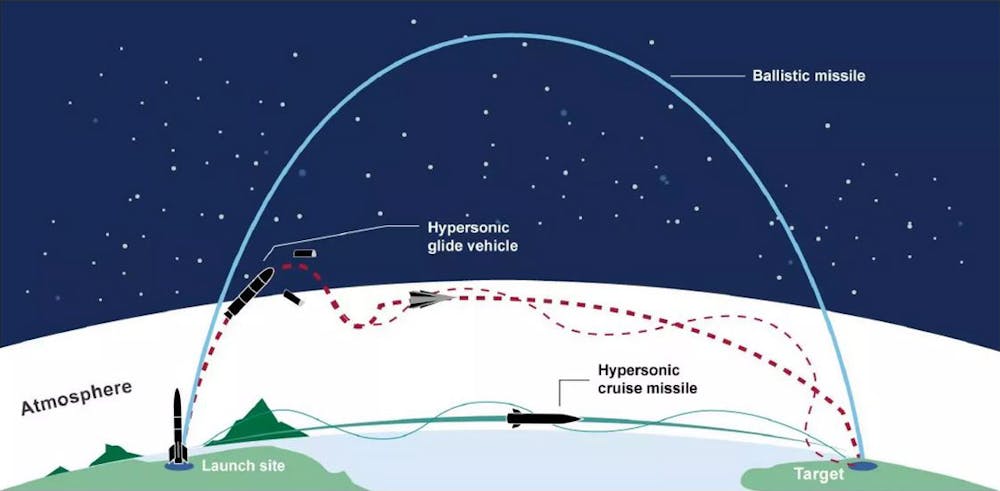
A second important challenge stems from the fact that they operate in a different region of the atmosphere from other existing threats. The new hypersonic weapons fly much higher than slower subsonic missiles but much lower than intercontinental ballistic missiles. The U.S. and its allies do not have good tracking coverage for this in-between region, nor does Russia or China.
Hypersonic missiles can change course to avoid detection and anti-missile defenses. U.S. Air Force graphic
Destabilizing effect
Russia has claimed that some of its hypersonic weapons can carry a nuclear warhead. This statement alone is a cause for concern whether or not it is true. If Russia ever operates this system against an enemy, that country would have to decide the probability of the weapon being conventional or nuclear.
How hypersonic missiles threaten to upend the relative stability of the current era of nuclear weapons.
In the case of the U.S., if the determination were made that the weapon was nuclear, then there is a very high likelihood that the U.S. would consider this a first strike attack and respond by unloading its nuclear weapons on Russia. The hypersonic speed of these weapons increases the precariousness of the situation because the time for any last-minute diplomatic resolution would be severely reduced.
It is the destabilizing influence that modern hypersonic missiles represent that is perhaps the greatest risk they pose. I believe the U.S. and its allies should rapidly field their own hypersonic weapons to bring other nations such as Russia and China to the negotiating table to develop a diplomatic approach to managing these weapons.
What is hypersonic?
Describing a vehicle as hypersonic means that it flies much faster than the speed of sound, which is 761 miles per hour (1,225 kilometers per hour) at sea level and 663 mph (1,067 kph) at 35,000 feet (10,668 meters) where passenger jets fly. Passenger jets travel at just under 600 mph (966 kph), whereas hypersonic systems operate at speeds of 3,500 mph (5,633 kph) – about 1 mile (1.6 kilometers) per second – and higher.
Hypersonic systems have been in use for decades. When John Glenn came back to Earth in 1962 from the first U.S. crewed flight around the Earth, his capsule entered the atmosphere at hypersonic speed. All of the intercontinental ballistic missiles in the world’s nuclear arsenals are hypersonic, reaching about 15,000 mph (24,140 kph), or about 4 miles (6.4 km) per second at their maximum velocity.
ICBMs are launched on large rockets and then fly on a predictable trajectory that takes them out of the atmosphere into space and then back into the atmosphere again. The new generation of hypersonic missiles fly very fast, but not as fast as ICBMs. They are launched on smaller rockets that keep them within the upper reaches of the atmosphere.
Hypersonic missiles are not as fast as intercontinental ballistic missiles but are able to vary their trajectories. U.S. Government Accounting Office
Three types of hypersonic missiles
There are three different types of non-ICBM hypersonic weapons: aero-ballistic, glide vehicles and cruise missiles. A hypersonic aero-ballistic system is dropped from an aircraft, accelerated to hypersonic speed using a rocket and then follows a ballistic, meaning unpowered, trajectory. The system Russian forces used to attack Ukraine, the Kinzhal, is an aero-ballistic missile. The technology has been around since about 1980.
A hypersonic glide vehicle is boosted on a rocket to high altitude and then glides to its target, maneuvering along the way. Examples of hypersonic glide vehicles include China’s Dongfeng-17, Russia’s Avangard and the U.S. Navy’s Conventional Prompt Strike system. U.S. officials have expressed concern that China’s hypersonic glide vehicle technology is further advanced than the U.S. system.
A hypersonic cruise missile is boosted by a rocket to hypersonic speed and then uses an air-breathing engine called a scramjet to sustain that speed. Because they ingest air into their engines, hypersonic cruise missiles require smaller launch rockets than hypersonic glide vehicles, which means they can cost less and be launched from more places. Hypersonic cruise missiles are under development by China and the U.S. The U.S. reportedly conducted a test flight of a scramjet hypersonic missile in March 2020.
Difficult to defend against
The primary reason nations are developing these next-generation hypersonic weapons is how difficult they are to defend against due to their speed, maneuverability and flight path. The U.S. is starting to develop a layered approach to defending against hypersonic weapons that includes a constellation of sensors in space and close cooperation with key allies. This approach is likely to be very expensive and take many years to implement.
With all of this activity on hypersonic weapons and defending against them, it is important to assess the threat they pose to national security. Hypersonic missiles with conventional, non-nuclear warheads are primarily useful against high-value targets, such as an aircraft carrier. Being able to take out such a target could have a significant impact on the outcome of a major conflict.
However, hypersonic missiles are expensive and therefore not likely to be produced in large quantities. As seen in the recent use by Russia, hypersonic weapons are not necessarily a silver bullet that ends a conflict.



 Article by Orbex