
By Orbex
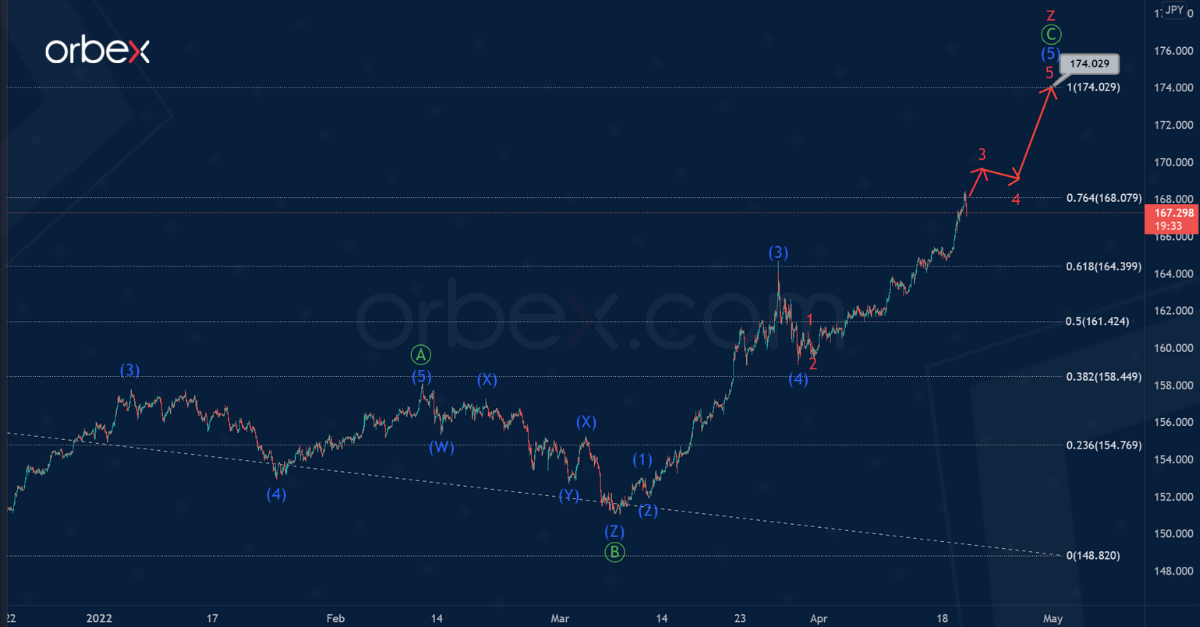
In the long term, the GBPJPY pair seems to be forming a large correction trend, taking the form of a triple zigzag. On the 1H timeframe, the final actionary wave z of the cycle degree is visible.
It is likely that the wave z takes the form of a simple zigzag Ⓐ-Ⓑ-Ⓒ of the primary degree. After the end of correction Ⓑ, which took the form of a triple combination, prices began to rise.
It is possible that the first four parts are complete as part of the potential impulse Ⓒ. The currency could now grow within the intermediate impulse (5).
The completion of the entire wave Ⓒ is possible near 174.02. At that level, wave z will be equal to wave y.
Free Reports:
 Sign Up for Our Stock Market Newsletter – Get updated on News, Charts & Rankings of Public Companies when you join our Stocks Newsletter
 Get our Weekly Commitment of Traders Reports - See where the biggest traders (Hedge Funds and Commercial Hedgers) are positioned in the futures markets on a weekly basis.

Alternatively, only the formation of the intermediate impulse (3), which is part of the primary wave Ⓒ, has come to an end.
Thus, a correction decline in the intermediate wave (4) could happen in the near future. It is possible that prices will fall to 159.74. At that level, correction (4) will be at 50% along the Fibonacci lines of impulse (3).
Join our responsible trading community – Open your Orbex account now!
![]() Article by Orbex
Article by Orbex
Orbex is a fully licensed broker that was established in 2011. Founded with a mission to serve its traders responsibly and provides traders with access to the world’s largest and most liquid financial markets. www.orbex.com

- The Bank of Canada kept its interest rate unchanged. Platinum prices reached a three‑week high Jul 16, 2026
- Stock indices rose after the release of US inflation data. China’s GDP slowed sharply Jul 15, 2026
- GBP/USD Awaits Political News: What Will Happen Next Jul 15, 2026
- USD/JPY Holds at Highs: Pressure Lingers on Yen Jul 14, 2026
- Oil prices jumped 4% amid a new wave of escalation between the US and Iran Jul 13, 2026
- EUR/USD: US Inflation Will Determine Everything Jul 13, 2026
- COT Metals Charts: Weekly Speculator Bets see small gains for Silver & Gold Jul 12, 2026
- COT Bonds Charts: Speculator Bets led by SOFR 3-Months & 2-Year Bonds Jul 12, 2026
- COT Energy Charts: Weekly Speculator Changes led by Brent Oil Jul 12, 2026
- COT Soft Commodities Charts: Weekly Speculator Changes led by Sugar, Corn & Soybeans Jul 12, 2026