Some funders are embracing ‘trust-based philanthropy’ by giving money without lots of obligations

By Emily Finchum-Mason, University of Washington 

With most foundations, the board of directors and top executives set all funding priorities. Nonprofits seeking money from those funders, in turn, must demonstrate an intention to do work that conforms to those priorities. The same system prevails with many individual wealthy donors.

Any nonprofit awarded a grant must follow the funder’s priorities and comply with all of its reporting requirements – which, with some foundations, can be very time-consuming.

Funders, rather than the communities they aim to support, hold most of the power in this arrangement. That can steer priorities in the wrong direction because the organizations that deal primarily or exclusively with those issues are probably more aware of what’s going on and what works best.

I’m studying the growing number of foundations bucking this traditional model. Instead of calling all the shots, these funders are embracing what’s known as trust-based philanthropy. This approach emphasizes building collaborative relationships in which funders are accountable to their grantees, not just the other way around.

How this works

You might think that a great deal of paperwork is necessary due to tax regulations. But the Internal Revenue Service actually gives foundations and other big donors considerable discretion in terms of how to manage their application process and reporting requirements, without jeopardizing tax breaks that can amount to hundreds of millions of dollars or more.

While cumbersome grant reporting requirements arose for the sake of accountability, some experts argue that they can unnecessarily burden nonprofits and privilege organizations whose programs and priorities align with donors’ priorities. This approach can result in organizations led by people of color getting less money.

Trust-based philanthropy can be executed in a variety of ways. It draws on ideas that are as old as philanthropy itself, like almsgiving money or goods to the poor.

Trust-based practices acknowledge the deeply rooted history of racial inequity in philanthropy, a history in which people of color had been actively marginalized and in which social interventions had often been designed with white people in mind. Through relationship building, collaboration and learning, trust-based practices seek to dismantle the inequitable social systems that organized philanthropy helped sow.

The idea gained steam in 2018, when a group of foundations joined together under the banner of the Trust-Based Philanthropy Project to make the sector more inclusive. Since then, experts have sought to spell out best practices and emphasize racial equity as a fundamental principle.

A different mindset

The philosophy behind trust-based philanthropy is about changing funders’ core organizational culture and values. In practice, trust-based philanthropy can take many different forms.

It may include unrestricted funding, meaning that money is provided to charities that choose how to spend it.

Funders may also limit application and reporting requirements or make the reporting process a two-way conversation between the funder and the cause they’re supporting.

Another option is to let grantees and communities that are supposed to benefit from funding weigh in on decision-making processes around the grant-making.

But, to be sure, trust-based philanthropy is not about ending grantee accountability or flouting IRS requirements.

An unexpected boost

Trust-based practices accelerated at the outset of the COVID-19 pandemic in early 2020, as foundations scrambled to quickly meet the needs of the groups they already supported, as well as some new organizations. Funders also had to immediately revise their requirements, some of which were no longer practical or feasible, and they needed to have a better sense of the challenges facing specific communities.

For example, in lieu of the kind of annual reporting process most foundations require, the Sheng-Yen Lu Foundation, which funds groups that help low-income immigrant and refugee communities in Washington state, asked grantees to provide a single paragraph describing the work they were doing and how it could best assist them going forward. It focused on building supportive relationships with the groups it funds to better help those in need.

Since then, the Sheng-Yen Lu Foundation has also provided grantees with several options for reporting. They can choose to follow up on funding over the telephone, submit a grant report that they wrote for another foundation, or write a brief paragraph discussing their progress and ongoing needs.

But that foundation has tapped trust-based approaches since 2018.

Rachel Allen, its vice president, indicates that one of the ways that this shows up is a focus on reflection and learning. In determining what information they need from grantees, the foundation’s leaders ask themselves, “What do we need to learn? How can we do better?”

Other funders that have embraced this approach include the Durfee, Satterberg and Stryker Johnston foundations. Together, they have about $600 million in total assets. They made over $73 million in grants in 2019.

Some high-profile megadonors, like the philanthropist MacKenzie Scott, are also taking trust-based approaches.

It’s unclear how much money foundations and donors give away via trust-based approaches, largely because the scope and scale of this approach to giving has not been systematically studied until now. Further, the variety of trust-based philanthropic tools, including unrestricted funding, participatory governance and grant-making, makes it hard to identify them all as the same broader trend.

Nevertheless, trust-based philanthropic practices are clearly growing more popular, a change that many nonprofit advocates welcome.The Conversation

About the Author:

Emily Finchum-Mason, Doctoral candidate in Public Policy and Management, University of Washington

This article is republished from The Conversation under a Creative Commons license. Read the original article.


Australia is investigating a digital currency, or e-dollar, but its benefits seem slight and the risks to privacy large

By Nafis Alam, Monash University 

– We are used to thinking of money as notes and coins, the kind most of us hold in our wallets. But most money – in Australia it’s 96.3% – is digital, held by financial institutions and moved around via bank transfers, debit cards and credit cards.

Late last year Treasurer Josh Frydenberg promised to consult about introducing a third type of currency, a central bank digital currency, and asked the treasury to come up with a position by the end of 2022.

A central bank digital currency (CBDC) would be an “e-dollar”, each one worth $1 dollar, but able to be held digitally without being put into a bank – such as on computers or in digital wallets on phones.

It could allow direct consumer-to-consumer and consumer-to-business payments without the intervention of financial institutions, and allow people who don’t want to use banks to hold funds in a form that’s safer than cash.

It could also head off attempts by private firms – such as Facebook, which proposed something called Libre – to do the same sort of thing.

For transactions, it would have a clear advantage over so-called cryptocurrencies such as Bitcoin, whose values fluctuate because they are not tied to a currency.

Many central banks are investigating the idea, but most say they are unlikely to issue a retail CBDC in the foreseeable future.

Australia’s Reserve is particularly unenthusiastic, declaring there is “currently no strong public policy case to introduce a CBDC for retail use”.

Whereas in much of the rest of the world the use of cash is shrinking, in Australia there are more banknotes in circulation as a proportion of the economy than at any time since the introduction of decimal currency in 1966.


Most of the cash appears to be used to store money rather than execute transactions. But if ever Australians could be weaned off cash, there would be savings for the Reserve Bank in the cost of printing and distributing cash, and also, most likely, fewer robberies.

But how the idea would work isn’t clear.

Like bus and train cards

One model would be to produce a digital token almost exactly the same as cash. Like a banknote, it could be passed from one person to another in anonymity, with no central authority involved.

The bus and train cards used in some parts of Australia are like this – unless an owner chooses to register ownership, there is no record of who used the card.

One downside is that, unlike cash, very large sums could be held on very small devices, which could be stolen or lost. A New Zealand study notes that cash is relatively bulky, “making it unlikely that consumers would carry
large amounts on their person or store large amounts in their homes”.

And it could facilitate illegal transactions. The current Coalition government is so concerned about the use of cash for illegal transactions that it introduced legislation – never enacted – which would have banned the use of cash for payments over A$10,000.

Banks and other organisations are already required to report transactions of $10,000 or more to the Australian Transaction Reports and Analysis Centre.

Or more like Bitcoin

An alternative, the one most often talked about as a consumer digital currency, would use blockchain technologies of the kind used in Bitcoin and other cryptocurrencies to register and track ownership, and verify transactions.

With blockchain, every transfer is recordable and hard to delete. The central bank (in Australia’s case, the Reserve Bank) would be able to track transactions.

It can be thought of as an account at a central bank, which could be used to transfer money to other accounts. In most models, the account would pay no interest.

And the central bank could limit transactions. Some, such as Bank of England Bank of England deputy governor Jon Cunliffe, see this as an advantage.

He says it could be like

giving your children pocket money but programming the money so that it couldn’t be used for sweets

In his book The Future of Money, Cornell University economist Eswar Prasad warns about societies in which central bank digital money becomes “an additional instrument of government control over citizens”.

China’s ‘programmable’ e-currency

China became the first major economy to pilot a digital currency in 2020.

The consulting firm Oliver Wyman says the digital Yuan will be “programmable” and could be set to only be used for payments after “activation” when certain predefined conditions are met.

China’s government, but not other users, would have the ability to monitor transactions in real time, in what China calls “controlled anonymity”.

This isn’t what much of the rest of the world seems to want. A survey of European consumers finds the thing they most want from an e-currency is privacy (43%) ahead of security (18%) and offline usability (8%).

The United States is continuing to investigate the idea, pointing to benefits including getting payments quickly to people in times of crisis (assuming there are working electricity and internet connections) and providing services to the unbanked.

Privacy is the roadblock

Privacy isn’t of concern in the other arena central banks are moving ahead with plans for a digital currency – wholesale money. Australia’s Reserve Bank is well advanced on Project Atom, which would allow financial institutions to transfer money between each other more quickly.

At the retail level, much of the world is moving slowly. Australia’s Reserve Bank says apart from the developed economies of Sweden and Canada, most of the economies advancing the idea are emerging, including the Bahamas, Cambodia, Eastern Caribbean, Ecuador, Nigeria and Ukraine.

They have weaker electronic banking infrastructure than Australia, and populations that can’t easily access physical banks.The Conversation

About the Author:

Nafis Alam, Professor and Head, School of Business, Monash University

This article is republished from The Conversation under a Creative Commons license. Read the original article.


The Analytical Overview of the Main Currency Pairs on 2022.05.09

by JustForex

The EUR/USD currency pair

Technical indicators of the currency pair:
  • Prev Open: 1.0540
  • Prev Close: 1.0545
  • % chg. over the last day: +0.05%

According to European Central Bank President Christine Lagarde, stagflation is not the most likely economic outcome for the Eurozone, although the war in Ukraine is slowing growth and accelerating inflation. ECB officials are still determined to continue normalizing monetary policy, and many remain open to the possibility of a first interest rate hike in July. Lagarde also added that net asset purchases should end early in the third quarter based on available data. Asked about interest rates, the ECB President said officials would keep “all options open” and move forward gradually.

Trading recommendations
  • Support levels: 1.0453
  • Resistance levels: 1.0566, 1.0633, 1.0723, 1.0766, 1.0799, 1.0869, 1.0955

From the technical point of view, the trend on the EUR/USD currency pair on the hourly time frame is still bearish. The price has dropped below the moving averages, and the MACD indicator has become negative. Under such market conditions, traders can look for sell deals from the resistance level of 1.0566, but only after the additional confirmation. Buy trades can be considered on intraday timeframes from the support level of 1.0453, but only with short targets and confirmation.

Alternative scenario: if the price breaks out through the 1.0770 resistance level and fixes above, the uptrend will likely resume.

EUR/USD
News feed for 2022.05.09:
  • – US FOMC Member Bostic Speaks at 15:45 (GMT+3).

The GBP/USD currency pair

Technical indicators of the currency pair:
  • Prev Open: 1.2356
  • Prev Close: 1.2326
  • % chg. over the last day: -0.24%

Bank of England officials expect a serious economic slowdown in the second half of the year while inflation rises. At the same time, they plan to raise the interest rate to 2.5%, with inflation at 7.0%. To curb inflation, the interest rate must be either at the same level as inflation or 1%. As a result, the UK economy will likely face a slowdown, and inflation has not even reached its peak. Investors understand this, so the British pound is under selling pressure, especially when the dollar index rises.

Trading recommendations
  • Support levels: 1.2293, 1.2127
  • Resistance levels: 1.2450, 1.2519, 1.2602, 1.2695, 1.2792, 1.2981, 1.3010, 1.3114

On the hourly time frame, the GBP/USD currency pair trend is still bearish. The MACD indicator became negative, selling pressure remained high, but divergence appeared. Under such market conditions, sell trades should be looked for from the resistance level of 1.2450 intraday. For buy deals, traders may consider the level of 1.2127, but only with short targets and after confirmation in the form of buyers’ initiative.

Alternative scenario: if the price breaks down through the 1.2695 resistance level and fixes above, the mid-term uptrend will likely be resumed.

GBP/USD
There is no news feed for today.

The USD/JPY currency pair

Technical indicators of the currency pair:
  • Prev Open: 130.18
  • Prev Close: 130.53
  • % chg. over the last day: +0.27%

At the last monetary policy meeting, the Bank of Japan announced it would continue its easing policy to manage the economy. At the same time, Kuroda said he would leave interest rates unchanged and continue the asset purchase program. The fundamental picture of the USD/JPY currency pair remains unchanged. The monetary policy of the central banks of the United States and Japan is still at different poles, contributing to the growth of USD/JPY quotes in the medium term. Therefore, any pullback should be used as a buying opportunity. But inflation in Japan is rising slowly and is approaching the 2% target. As soon as the country’s inflation rate reaches 2%, the Bank of Japan will abandon its ultra-soft monetary policy.

Trading recommendations
  • Support levels: 130.57, 129.42, 128.55, 127.29, 126.91, 126.00, 125.57
  • Resistance levels: 131.24

The medium-term trend on the USD/JPY currency pair is still bullish. The MACD indicator has become positive, and the buying pressure has increased. Under such market conditions, it is best to look for buy deals, expecting the continuation of the uptrend. First of all, it is worth considering the support level of 130.57. A resistance level of 131.24 may be considered for sell deals, but only with additional confirmation and short targets.

Alternative scenario: If the price fixes below 128.55, the uptrend will likely be broken.

USD/JPY
News feed for 2022.05.09:
  • – Japan Monetary Policy Meeting Minutes at 02:50 (GMT+3);
  • – Japan Services PMI (m/m) at 03:30 (GMT+3).

The USD/CAD currency pair

Technical indicators of the currency pair:
  • Prev Open: 1.2827
  • Prev Close: 1.2907
  • % chg. over the last day: +0.62%

Canada’s unemployment rate fell to 5.2% in April, the lowest level since 1976. Economists and policymakers expect job creation to slow as employment is already well above the pre-pandemic level. The imbalance between supply and demand for jobs is the main reason why the Bank of Canada is tightening its monetary policy. Analysts believe that the Bank of Canada will continue to raise interest rates in the coming months aggressively.

Trading recommendations
  • Support levels: 1.2908, 1.2774, 1.2692, 1.2644, 1.2607, 1.2521
  • Resistance levels: 1.3033

In terms of technical analysis, the USD/CAD currency pair is bullish. The price forms a wide price corridor, but buyer pressure prevails. The MACD indicator is in the positive zone, but the divergence of higher timeframes is increasing. Trade is worth it only with short targets because, fundamentally, both the dollar index and the Canadian dollar are inclined to grow. Under such market conditions, it is better to look for buy trades on the lower timeframes from the support level of 1.2908, but it is better with additional confirmation. For sell deals, it is better to consider the resistance level of 1.3033, but it is also better with confirmation and short targets.

Alternative scenario: if the price breaks through and consolidates below 1.2693, the downtrend will likely be resumed.

USD/CAD
There is no news feed for today.

by JustForex


This article reflects a personal opinion and should not be interpreted as an investment advice, and/or offer, and/or a persistent request for carrying out financial transactions, and/or a guarantee, and/or a forecast of future events.

Major US stock indices continue to decline amid negative investor sentiment

by JustForex

Last week, the Nasdaq (US100) and S&P 500 (US500) indices fell for the fifth week in a row and the Dow Jones Industrial Average (US30) for the sixth. This is the longest losing streak for the S&P 500 since mid-2011 and the Nasdaq since late 2012. Investors are concerned that aggressive tightening by the Fed could lead the economy to recession. As the stock market closed on Friday, the Dow Jones index (US30) decreased by 0.30% (-0.24% for the week), the S&P 500 (US500) lost 0.57% (-0.18% for the week), and the NASDAQ Technology Index (US100) fell by 1.40% on Friday and became the fall leader (-1.52%) for the week.

Markets estimate a 75% chance of a 75 basis point rate hike at the Fed’s June meeting, although Fed Chairman Jerome Powell indicated last week that the Committee was not considering a 75% rate hike. Market volatility is likely to continue as a more hawkish Fed stance, a sharp rise in bond yields, and geopolitical risks such as the war in Ukraine affect investor sentiment. Rumors that Russian President Vladimir Putin may declare war on Ukraine to call up reserves during his Victory Day speech have undermined market sentiment. So far, Putin has characterized Russia’s actions in Ukraine as a “special military operation” rather than a war or invasion.

In April, the US economy added 428,000 jobs, slightly slower than in recent months. The unemployment rate remained at 3.6%. The main news in the Labor Department’s jobs report was that average hourly earnings increased by only 0.3%, bringing the annual growth rate for the last three months to 3.8%. This is much slower than the growth rate in nominal wages in 2021. If this trend continues, the country will soon face a slowdown in job creation.

Major European indices traded lower on Friday. German DAX (DE30) fell by 1.64% (-2.30% for the week), French CAC 40 (FR40) decreased by 1.73% (-3.26% for the week), Spanish IBEX 35 (ES35) lost 1.34% (-2.32% for the week), British FTSE 100 (UK100) was down by 1.54% (-1.61% for the week). According to European Central Bank President Christine Lagarde, stagflation is not the most likely economic outcome for the Eurozone, although the war in Ukraine is slowing growth and accelerating inflation. ECB officials are still determined to continue normalizing monetary policy, and many remain open to the possibility of a first interest rate hike in July. Lagarde also added that net asset purchases should end early in the third quarter based on available data.

Germany will show solidarity with European Union countries looking for alternatives to Russian gas and oil. It will help other countries without ports in the North Sea or the Baltic Sea gain access to liquefied natural gas (LNG). Last week on Thursday, Germany took steps to boost its LNG imports by leasing four floating storage and regasification units and choosing the port of Wilhelmshaven on the North Sea as its first transshipment point. Oil prices are trading around $109-110 for WTI crude. The main focus is now on the negotiations in the European Union over the Russian oil embargo, which is likely to reduce global supplies further. European Union governments are set to meet this week to decide how to secure countries most dependent on Russian energy, such as Hungary, Slovakia, and the Czech Republic. The proposal requires a unanimous vote of EU members.

According to the hedge fund Crescat Capital LLC, silver remains one of the most undervalued opportunities in financial markets (for the next 1-2 years). Also, according to the fund’s analysts, precious metals companies have been performing incredibly well lately, which will undoubtedly affect their value growth.

Asian markets traded without a single trend last week. Japan’s Nikkei 225 (JP225) gained 0.97% over the week, Hong Kong’s Hang Seng (HK50) fell by 1.33% last week, and Australia’s S&P/ASX 200 (AU200) decreased by 3.09% over the week. China’s export growth slowed in April to its lowest level since June 2020. Last month, exports rose 3.9% year on year to $273.62 billion, up from a 14.7% increase in March. However, the export figure was above the average result of the analysts’ survey. Imports changed little in April as tighter and expanded COVID-19 restrictions halted factory production and reduced domestic demand, exacerbating the overall economic problems.

In the commodities market, futures on gasoline (+10.82%), natural gas (+10.17%), Brent oil (+5.67%), WTI oil (+5.65%), and wheat (+5.09%) showed the biggest gains at the end of the week. Futures on palladium (-11.92%), lumber (-8.96%), coffee (-5.4%), cocoa (-3.7%), copper (-3.63%), soybeans (-3.56%), corn (-3.32%) and silver (-3.1%) showed the biggest drop.

Main market quotes:

S&P 500 (F) (US500) 4,123.34 -23.53 (-0.57%)

Dow Jones (US30) 32,899.37 -98.60 (-0.30%)

DAX (DE40) 13,674.29 -228.23 (-1.64%)

FTSE 100 (UK100) 7,387.94 -115.33 (-1.54%)

USD Index 103.66 -0.09 (-0.09%)

Important events for today:
  • – Japan Monetary Policy Meeting Minutes at 02:50 (GMT+3);
  • – Japan Services PMI (m/m) at 03:30 (GMT+3);
  • – US FOMC Member Bostic Speaks at 15:45 (GMT+3).

by JustForex


This article reflects a personal opinion and should not be interpreted as an investment advice, and/or offer, and/or a persistent request for carrying out financial transactions, and/or a guarantee, and/or a forecast of future events.

USDCNH Eyeing 6.920 Following Cycle Correction

By Orbex

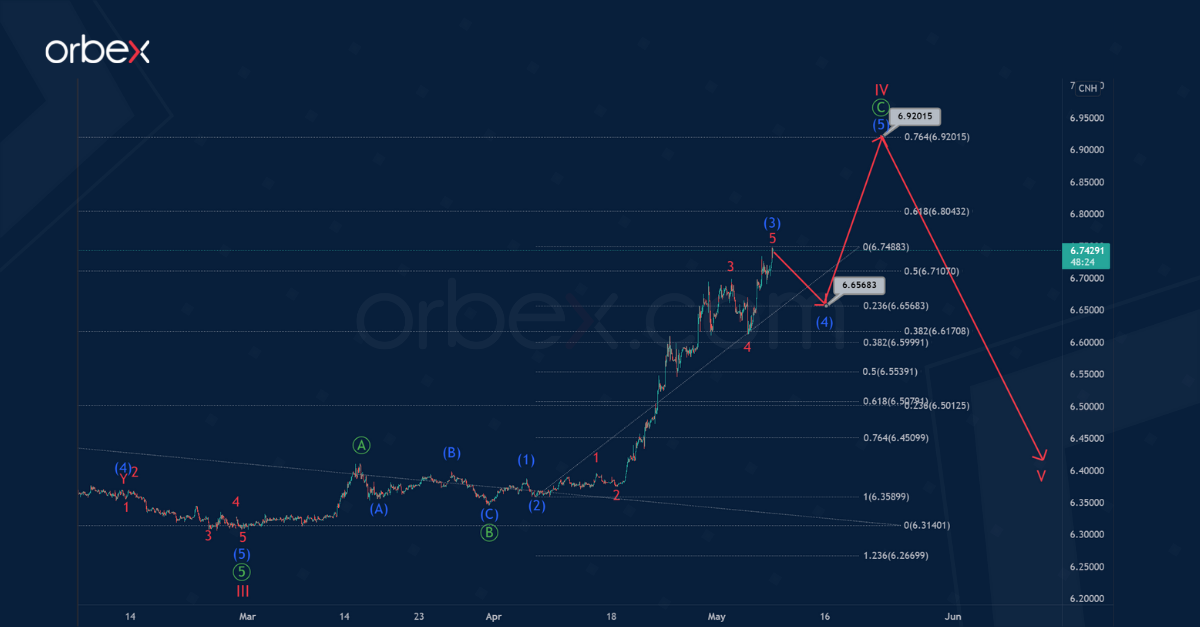
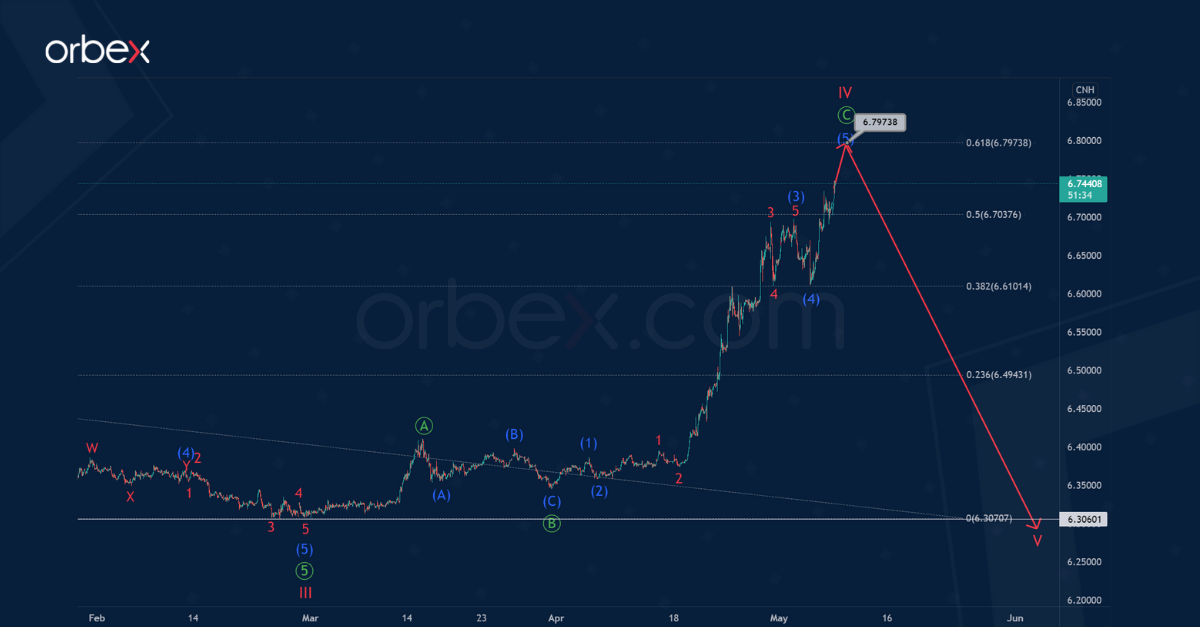
The USDCNH formation hints at a zigzag consisting of primary sub-waves Ⓐ-Ⓑ-Ⓒ.

The last primary wave Ⓒ of this correction pattern takes the form of an intermediate 5-wave impulse (1)-(2)-(3)-(4)-(5).

The current structure indicates that the market has completed the bullish intermediate impulse (3). Soon, an intermediate correction (4) will form near 6.656, which will be at 23.6% of impulse (3).

After the end of sub-wave (4), prices are likely to rise to the level of 6.920. This is where wave (5) will be at 76.4% of impulse (3).

An alternative option assumes that the construction of a cycle correction IV will be completed much earlier than in the first option.

Most likely, in the primary impulse, sub-waves (1)-(2)-(3)-(4) have ended. It is possible that in the near future the bulls will continue to move the price up in the intermediate wave (5) to 6.797. At that level, wave IV will be at 61.8% of cycle impulse III.

After reaching the level of 6.797, a bearish trend is expected in the market within the cycle wave V. This could fall to the previous low of 6.306, or even lower.


Orbex-LogoArticle by Orbex

Orbex is a fully licensed broker that was established in 2011. Founded with a mission to serve its traders responsibly and provides traders with access to the world’s largest and most liquid financial markets. www.orbex.com

Intraday Market Analysis – USD Keeps Momentum

By Orbex

Intraday Market Analysis – USD Keeps Momentum

EURUSD consolidates

EUR USD

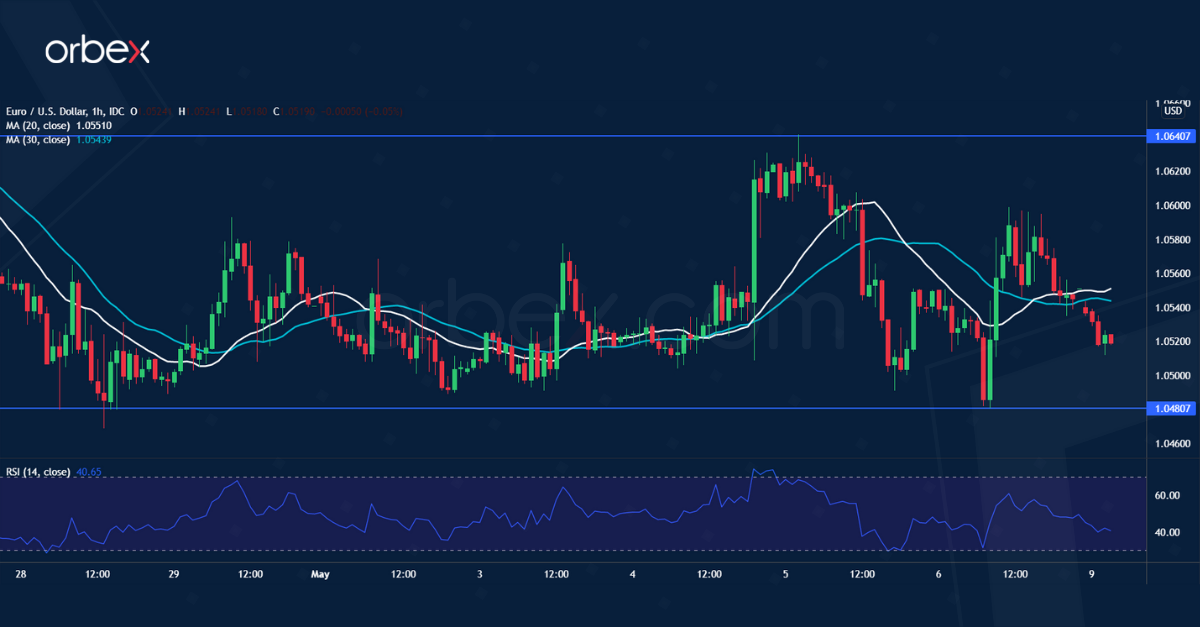
The US dollar climbed after better-than-expected NFP in April. The euro is licking its wounds after it broke March 2020’s lows near 1.0640. The price is seeking support above March 2017’s lows (1.0500). The previous rebound came to a halt at the support-turned-resistance at 1.0640. A bullish breakout could drive the bears into giving up their chips, reducing the pressure and potentially paving the way for a rally towards 1.0810. A fall below the current consolidation range (1.0480) would send the single currency to 1.0400.


USDCAD bounces higher
USD CAD

The Canadian dollar softens as April’s labour market performance fell short of expectations. A combination of a break above March’s high (1.2900) and a bullish MA cross on the daily chart confirms the market’s upbeat mood. The latest retracement found support in the major demand zone over 1.2720. A break above 1.2840 may have flushed remaining selling interests out. Last December’s high at 1.2960 is the last hurdle and its breach could open the door for an extended rally above 1.3100.


GER 40 struggles for support
GER 40


The Dax 40 tumbles as risk appetite subsides amid global policy tightening. The index has met stiff selling pressure at the origin of the late April sell-off at 14300. A drop below the psychological level of 14000 prompted buyers to bail out, invalidating the latest rebound in the process. A bearish MA cross is another sign that an imminent sell-off could be building up. A deeper correction below 13570 would send the price action to 13300. 13820 is a fresh resistance in case of a rebound.


Orbex-LogoArticle by Orbex

Orbex is a fully licensed broker that was established in 2011. Founded with a mission to serve its traders responsibly and provides traders with access to the world’s largest and most liquid financial markets. www.orbex.com

Currency Speculators drop Euro bets into bearish territory on interest rates & low growth

By InvestMacro | COT | Data Tables | COT Leaders | Downloads | COT Newsletter
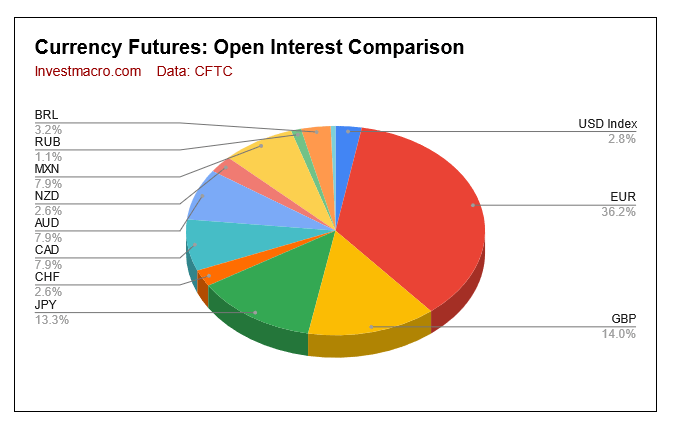
COT Open Interest Currencies Forex

Here are the latest charts and statistics for the Commitment of Traders (COT) data published by the Commodities Futures Trading Commission (CFTC).

The latest COT data is updated through Tuesday May 3rd 2022 and shows a quick view of how large traders (for-profit speculators and commercial entities) were positioned in the futures markets. All currency positions are in direct relation to the US dollar where, for example, a bet for the euro is a bet that the euro will rise versus the dollar while a bet against the euro will be a bet that the euro will decline versus the dollar.

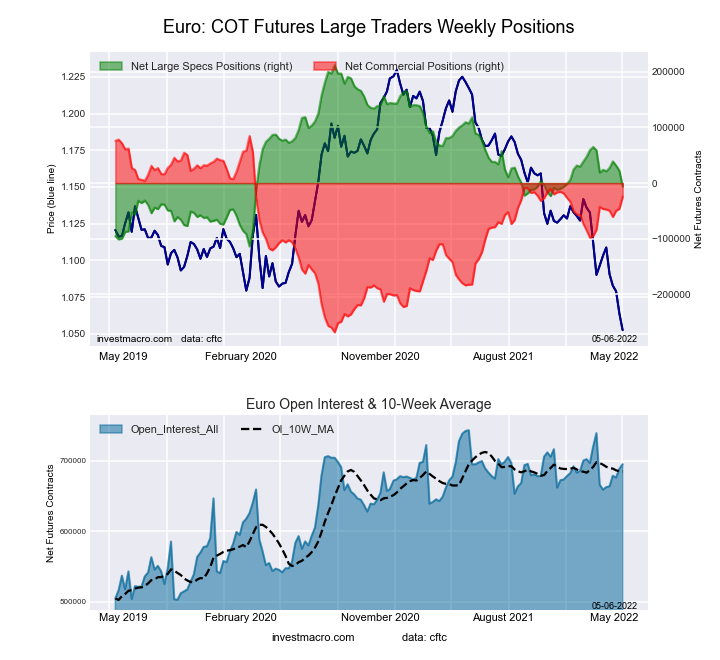
Highlighting the COT currency data was the continued drop in speculator bets for European common currency futures contracts. Euro speculators reduced their bets for the third straight week this week and have now trimmed the net position by a total of -45,438 contracts over this three-week period. This decreasing sentiment among speculators accelerated this week with a large drop of -28,579 contracts and knocked the net contract level back into a bearish position for the first time since the beginning of October 2021.

The fundamental backdrop for the euro is one of weak growth and low interest rates compared to many of the other major currency countries. The Eurozone GDP for the first quarter of 2022 amounted to just 0.2 percent growth following a fourth quarter of 2021 growth reading of 0.3 percent. The war in Ukraine combined with surging inflation and weakening consumer demand has some banks believing a GDP contraction could be on the horizon while others see parity in the euro versus the US dollar as inevitable. Eurozone interest rates are forecasted to rise this year but they have been behind their major currency counterparts. The US, Canada, UK, Australia and New Zealand have all raised their benchmark interest rates over the past quarter and look likely to see more over the year, possibly widening the interest rate differential even more if the European Central Bank does not act.

This week was a very rare week when all the currencies we cover had lower speculator bets including the Euro (-28,579 contracts), Canadian dollar (-11,852 contracts), New Zealand dollar (-6,676 contracts), Mexican peso (-5,503 contracts), Japanese yen (-5,259 contracts), Brazil real (-5,096 contracts), British pound sterling (-4,192 contracts), Swiss franc (-1,038 contracts), US Dollar Index (-808 contracts), Australian dollar (-865 contracts) and Bitcoin (-24 contracts).
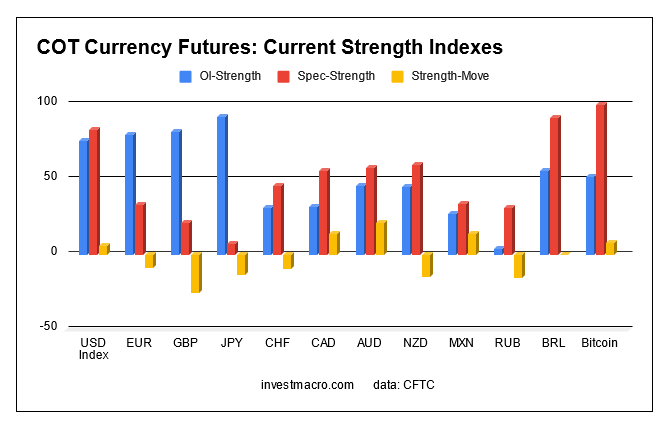

Forex Strength Speculators levels

Speculator strength standings for each Commodity where strength index is current net position compared to past three years, above 80 is bullish extreme, below 20 is bearish extreme OI Strength = Current Open Interest level compared to last 3 years range Spec Strength = Current Net Speculator level compared to last 3 years range Strength Move = Six week change of Spec Strength


Data Snapshot of Forex Market Traders | Columns Legend
May-03-2022OIOI-IndexSpec-NetSpec-IndexCom-NetCOM-IndexSmalls-NetSmalls-Index
USD Index54,0927633,07183-35,684152,61345
EUR694,92680-6,37833-24,5866930,96426
GBP268,49682-73,8132189,02682-15,21324
JPY254,81392-100,7947120,26494-19,47014
CHF49,38531-13,9074630,54268-16,6357
CAD152,779329,02956-12,959513,93038
AUD152,25746-28,5165834,22544-5,70939
NZD50,84445-6,610609,87946-3,26914
MXN151,9332714,62334-18,552653,92960
RUB20,93047,54331-7,15069-39324
BRL61,5495641,78891-43,37191,58383
Bitcoin10,05152388100-42904114


US Dollar Index Futures:

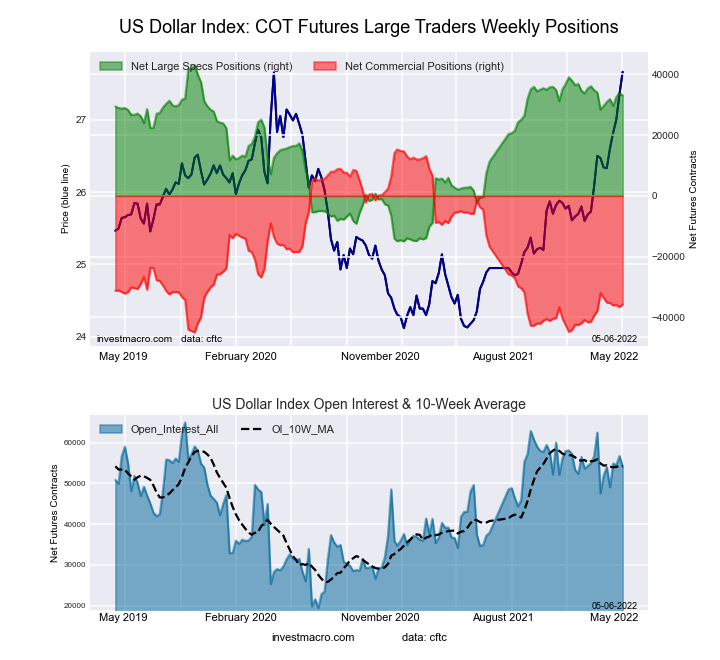
US Dollar Index Forex Futures COT ChartThe US Dollar Index large speculator standing this week came in at a net position of 33,071 contracts in the data reported through Tuesday. This was a weekly lowering of -808 contracts from the previous week which had a total of 33,879 net contracts.

This week’s current strength score (the trader positioning range over the past three years, measured from 0 to 100) shows the speculators are currently Bullish-Extreme with a score of 82.8 percent. The commercials are Bearish-Extreme with a score of 15.3 percent and the small traders (not shown in chart) are Bearish with a score of 45.1 percent.

US DOLLAR INDEX StatisticsSPECULATORSCOMMERCIALSSMALL TRADERS
– Percent of Open Interest Longs:85.52.79.8
– Percent of Open Interest Shorts:24.468.65.0
– Net Position:33,071-35,6842,613
– Gross Longs:46,2641,4395,296
– Gross Shorts:13,19337,1232,683
– Long to Short Ratio:3.5 to 10.0 to 12.0 to 1
NET POSITION TREND:
– Strength Index Score (3 Year Range Pct):82.815.345.1
– Strength Index Reading (3 Year Range):Bullish-ExtremeBearish-ExtremeBearish
NET POSITION MOVEMENT INDEX:
– 6-Week Change in Strength Index:5.9-3.6-13.9


Euro Currency Futures:

Euro Currency Futures COT ChartThe Euro Currency large speculator standing this week came in at a net position of -6,378 contracts in the data reported through Tuesday. This was a weekly lowering of -28,579 contracts from the previous week which had a total of 22,201 net contracts.

This week’s current strength score (the trader positioning range over the past three years, measured from 0 to 100) shows the speculators are currently Bearish with a score of 33.0 percent. The commercials are Bullish with a score of 69.0 percent and the small traders (not shown in chart) are Bearish with a score of 25.7 percent.

EURO Currency StatisticsSPECULATORSCOMMERCIALSSMALL TRADERS
– Percent of Open Interest Longs:30.055.112.7
– Percent of Open Interest Shorts:30.958.78.2
– Net Position:-6,378-24,58630,964
– Gross Longs:208,449383,22288,267
– Gross Shorts:214,827407,80857,303
– Long to Short Ratio:1.0 to 10.9 to 11.5 to 1
NET POSITION TREND:
– Strength Index Score (3 Year Range Pct):33.069.025.7
– Strength Index Reading (3 Year Range):BearishBullishBearish
NET POSITION MOVEMENT INDEX:
– 6-Week Change in Strength Index:-9.36.213.9


British Pound Sterling Futures:

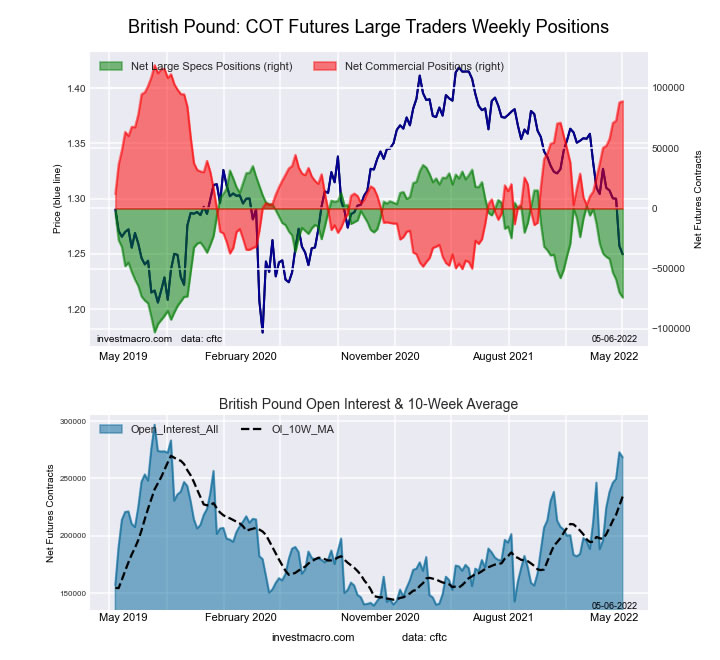
The British Pound Sterling large speculator standing this week came in at a net position of -73,813 contracts in the data reported through Tuesday. This was a weekly decline of -4,192 contracts from the previous week which had a total of -69,621 net contracts.

This week’s current strength score (the trader positioning range over the past three years, measured from 0 to 100) shows the speculators are currently Bearish with a score of 20.8 percent. The commercials are Bullish-Extreme with a score of 82.3 percent and the small traders (not shown in chart) are Bearish with a score of 24.1 percent.

BRITISH POUND StatisticsSPECULATORSCOMMERCIALSSMALL TRADERS
– Percent of Open Interest Longs:12.577.77.7
– Percent of Open Interest Shorts:40.044.613.3
– Net Position:-73,81389,026-15,213
– Gross Longs:33,536208,75420,590
– Gross Shorts:107,349119,72835,803
– Long to Short Ratio:0.3 to 11.7 to 10.6 to 1
NET POSITION TREND:
– Strength Index Score (3 Year Range Pct):20.882.324.1
– Strength Index Reading (3 Year Range):BearishBullish-ExtremeBearish
NET POSITION MOVEMENT INDEX:
– 6-Week Change in Strength Index:-26.322.8-4.3


Japanese Yen Futures:

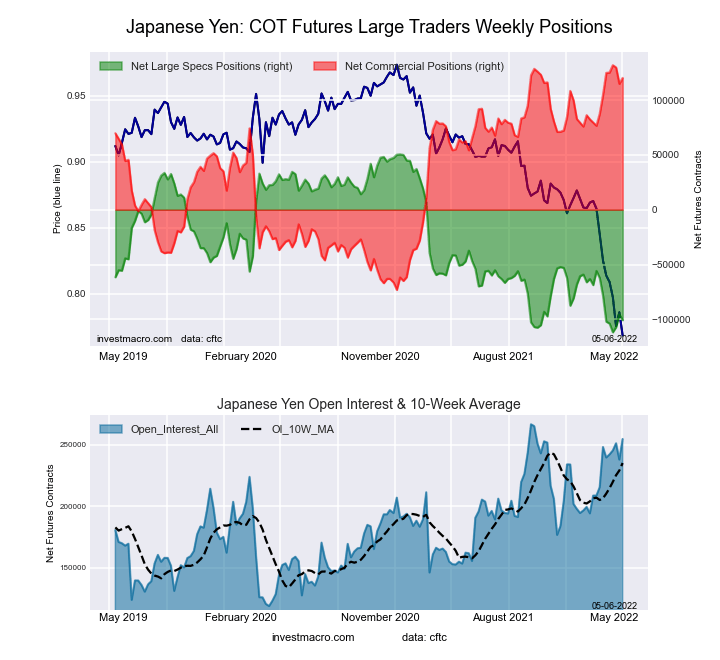
Japanese Yen Forex Futures COT ChartThe Japanese Yen large speculator standing this week came in at a net position of -100,794 contracts in the data reported through Tuesday. This was a weekly lowering of -5,259 contracts from the previous week which had a total of -95,535 net contracts.

This week’s current strength score (the trader positioning range over the past three years, measured from 0 to 100) shows the speculators are currently Bearish-Extreme with a score of 6.8 percent. The commercials are Bullish-Extreme with a score of 94.3 percent and the small traders (not shown in chart) are Bearish-Extreme with a score of 13.9 percent.

JAPANESE YEN StatisticsSPECULATORSCOMMERCIALSSMALL TRADERS
– Percent of Open Interest Longs:7.384.67.1
– Percent of Open Interest Shorts:46.837.414.7
– Net Position:-100,794120,264-19,470
– Gross Longs:18,585215,56318,007
– Gross Shorts:119,37995,29937,477
– Long to Short Ratio:0.2 to 12.3 to 10.5 to 1
NET POSITION TREND:
– Strength Index Score (3 Year Range Pct):6.894.313.9
– Strength Index Reading (3 Year Range):Bearish-ExtremeBullish-ExtremeBearish-Extreme
NET POSITION MOVEMENT INDEX:
– 6-Week Change in Strength Index:-13.77.513.9


Swiss Franc Futures:

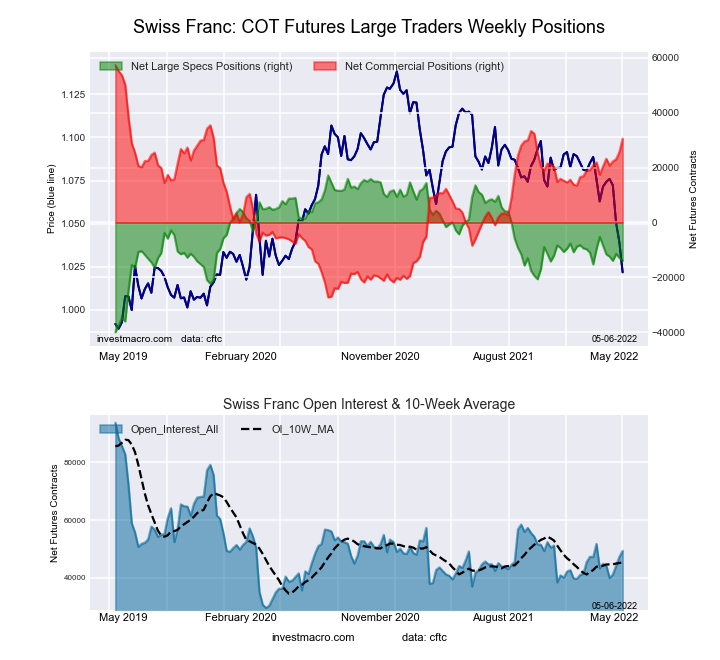
Swiss Franc Forex Futures COT ChartThe Swiss Franc large speculator standing this week came in at a net position of -13,907 contracts in the data reported through Tuesday. This was a weekly decline of -1,038 contracts from the previous week which had a total of -12,869 net contracts.

This week’s current strength score (the trader positioning range over the past three years, measured from 0 to 100) shows the speculators are currently Bearish with a score of 45.7 percent. The commercials are Bullish with a score of 68.3 percent and the small traders (not shown in chart) are Bearish-Extreme with a score of 7.3 percent.

SWISS FRANC StatisticsSPECULATORSCOMMERCIALSSMALL TRADERS
– Percent of Open Interest Longs:8.875.815.0
– Percent of Open Interest Shorts:37.013.948.7
– Net Position:-13,90730,542-16,635
– Gross Longs:4,35737,4297,397
– Gross Shorts:18,2646,88724,032
– Long to Short Ratio:0.2 to 15.4 to 10.3 to 1
NET POSITION TREND:
– Strength Index Score (3 Year Range Pct):45.768.37.3
– Strength Index Reading (3 Year Range):BearishBullishBearish-Extreme
NET POSITION MOVEMENT INDEX:
– 6-Week Change in Strength Index:-9.611.9-14.5


Canadian Dollar Futures:

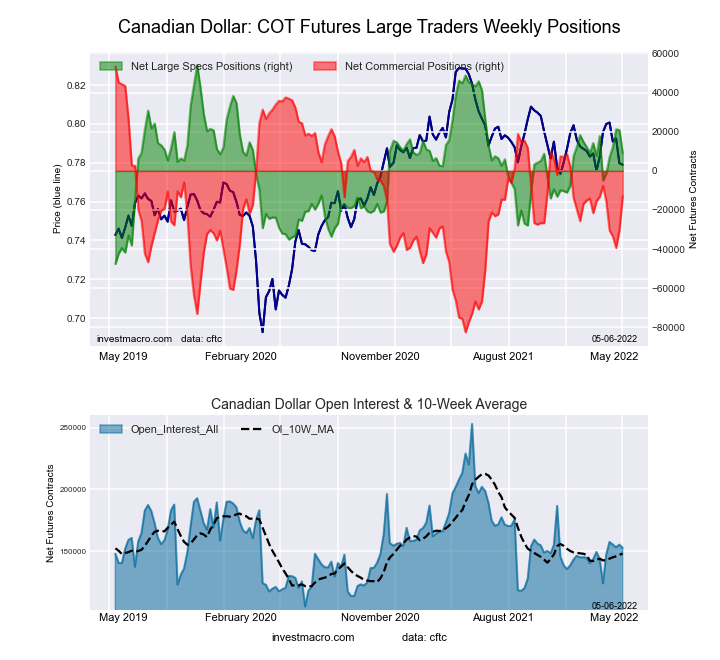
Canadian Dollar Forex Futures COT ChartThe Canadian Dollar large speculator standing this week came in at a net position of 9,029 contracts in the data reported through Tuesday. This was a weekly decrease of -11,852 contracts from the previous week which had a total of 20,881 net contracts.

This week’s current strength score (the trader positioning range over the past three years, measured from 0 to 100) shows the speculators are currently Bullish with a score of 55.7 percent. The commercials are Bullish with a score of 51.2 percent and the small traders (not shown in chart) are Bearish with a score of 37.6 percent.

CANADIAN DOLLAR StatisticsSPECULATORSCOMMERCIALSSMALL TRADERS
– Percent of Open Interest Longs:29.247.521.0
– Percent of Open Interest Shorts:23.356.018.4
– Net Position:9,029-12,9593,930
– Gross Longs:44,67072,62932,093
– Gross Shorts:35,64185,58828,163
– Long to Short Ratio:1.3 to 10.8 to 11.1 to 1
NET POSITION TREND:
– Strength Index Score (3 Year Range Pct):55.751.237.6
– Strength Index Reading (3 Year Range):BullishBullishBearish
NET POSITION MOVEMENT INDEX:
– 6-Week Change in Strength Index:13.8-4.0-17.1


Australian Dollar Futures:

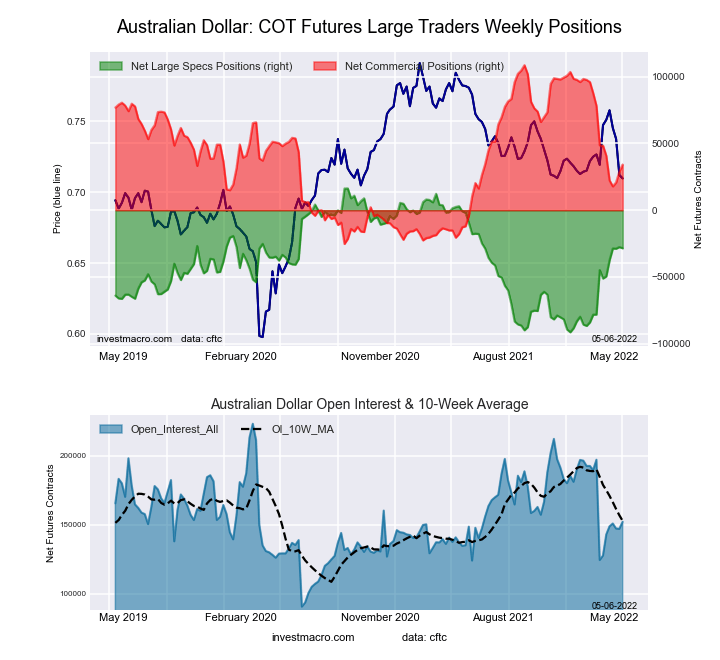
Australian Dollar Forex Futures COT ChartThe Australian Dollar large speculator standing this week came in at a net position of -28,516 contracts in the data reported through Tuesday. This was a weekly decrease of -865 contracts from the previous week which had a total of -27,651 net contracts.

This week’s current strength score (the trader positioning range over the past three years, measured from 0 to 100) shows the speculators are currently Bullish with a score of 58.4 percent. The commercials are Bearish with a score of 44.4 percent and the small traders (not shown in chart) are Bearish with a score of 38.5 percent.

AUSTRALIAN DOLLAR StatisticsSPECULATORSCOMMERCIALSSMALL TRADERS
– Percent of Open Interest Longs:30.952.614.0
– Percent of Open Interest Shorts:49.630.217.8
– Net Position:-28,51634,225-5,709
– Gross Longs:46,99580,14721,330
– Gross Shorts:75,51145,92227,039
– Long to Short Ratio:0.6 to 11.7 to 10.8 to 1
NET POSITION TREND:
– Strength Index Score (3 Year Range Pct):58.444.438.5
– Strength Index Reading (3 Year Range):BullishBearishBearish
NET POSITION MOVEMENT INDEX:
– 6-Week Change in Strength Index:21.0-10.6-20.8


New Zealand Dollar Futures:

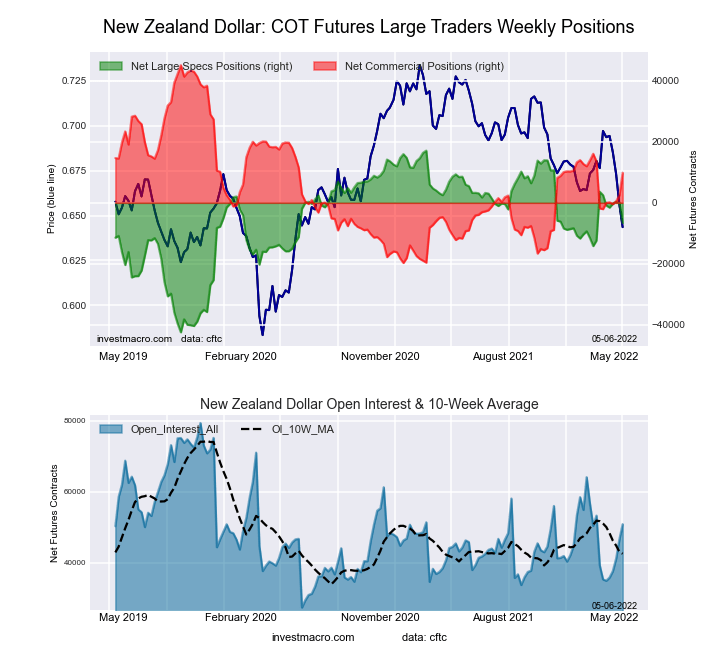
New Zealand Dollar Forex Futures COT ChartThe New Zealand Dollar large speculator standing this week came in at a net position of -6,610 contracts in the data reported through Tuesday. This was a weekly decrease of -6,676 contracts from the previous week which had a total of 66 net contracts.

This week’s current strength score (the trader positioning range over the past three years, measured from 0 to 100) shows the speculators are currently Bullish with a score of 60.2 percent. The commercials are Bearish with a score of 45.6 percent and the small traders (not shown in chart) are Bearish-Extreme with a score of 14.4 percent.

NEW ZEALAND DOLLAR StatisticsSPECULATORSCOMMERCIALSSMALL TRADERS
– Percent of Open Interest Longs:34.360.64.8
– Percent of Open Interest Shorts:47.341.111.2
– Net Position:-6,6109,879-3,269
– Gross Longs:17,42730,7892,423
– Gross Shorts:24,03720,9105,692
– Long to Short Ratio:0.7 to 11.5 to 10.4 to 1
NET POSITION TREND:
– Strength Index Score (3 Year Range Pct):60.245.614.4
– Strength Index Reading (3 Year Range):BullishBearishBearish-Extreme
NET POSITION MOVEMENT INDEX:
– 6-Week Change in Strength Index:-15.318.4-32.3


Mexican Peso Futures:

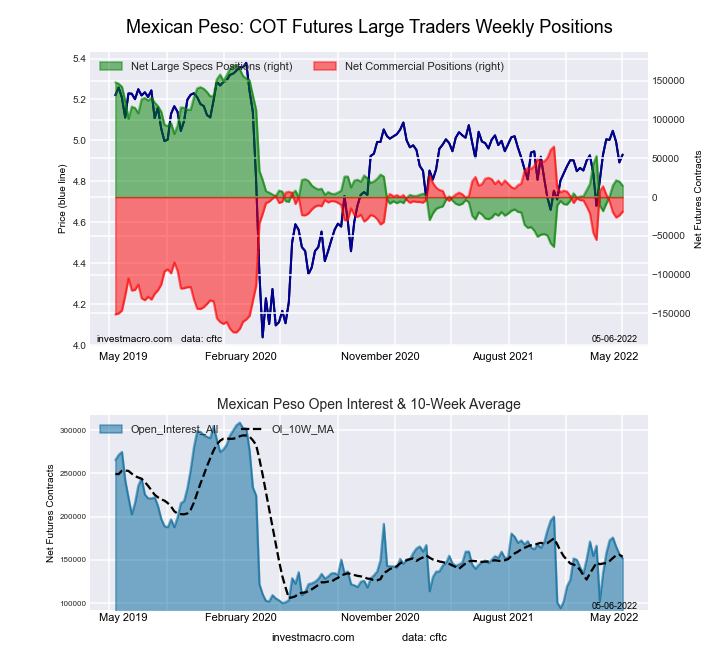
Mexican Peso Futures COT ChartThe Mexican Peso large speculator standing this week came in at a net position of 14,623 contracts in the data reported through Tuesday. This was a weekly reduction of -5,503 contracts from the previous week which had a total of 20,126 net contracts.

This week’s current strength score (the trader positioning range over the past three years, measured from 0 to 100) shows the speculators are currently Bearish with a score of 33.6 percent. The commercials are Bullish with a score of 65.1 percent and the small traders (not shown in chart) are Bullish with a score of 59.7 percent.

MEXICAN PESO StatisticsSPECULATORSCOMMERCIALSSMALL TRADERS
– Percent of Open Interest Longs:42.052.34.5
– Percent of Open Interest Shorts:32.464.51.9
– Net Position:14,623-18,5523,929
– Gross Longs:63,86079,3946,771
– Gross Shorts:49,23797,9462,842
– Long to Short Ratio:1.3 to 10.8 to 12.4 to 1
NET POSITION TREND:
– Strength Index Score (3 Year Range Pct):33.665.159.7
– Strength Index Reading (3 Year Range):BearishBullishBullish
NET POSITION MOVEMENT INDEX:
– 6-Week Change in Strength Index:13.9-13.5-0.9


Brazilian Real Futures:

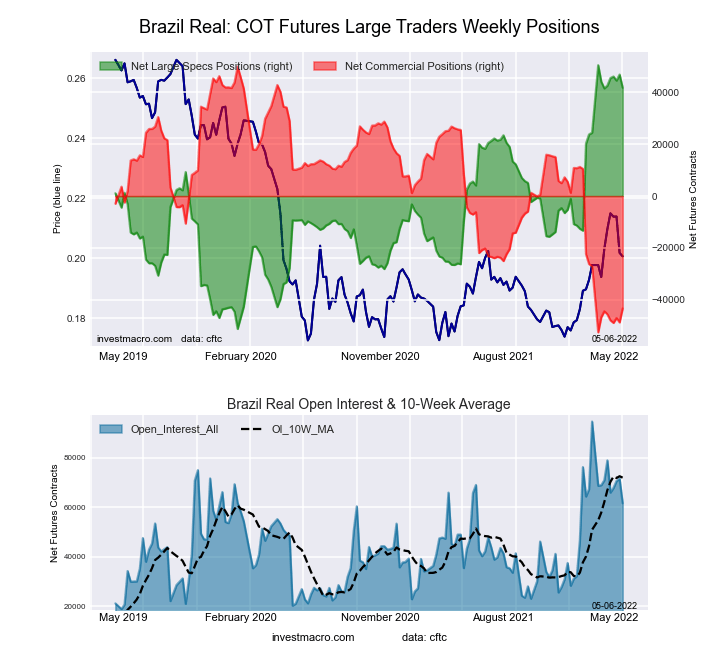
Brazil Real Futures COT ChartThe Brazilian Real large speculator standing this week came in at a net position of 41,788 contracts in the data reported through Tuesday. This was a weekly lowering of -5,096 contracts from the previous week which had a total of 46,884 net contracts.

This week’s current strength score (the trader positioning range over the past three years, measured from 0 to 100) shows the speculators are currently Bullish-Extreme with a score of 91.4 percent. The commercials are Bearish-Extreme with a score of 9.0 percent and the small traders (not shown in chart) are Bullish-Extreme with a score of 83.3 percent.

BRAZIL REAL StatisticsSPECULATORSCOMMERCIALSSMALL TRADERS
– Percent of Open Interest Longs:81.213.55.3
– Percent of Open Interest Shorts:13.383.92.8
– Net Position:41,788-43,3711,583
– Gross Longs:49,9918,2803,278
– Gross Shorts:8,20351,6511,695
– Long to Short Ratio:6.1 to 10.2 to 11.9 to 1
NET POSITION TREND:
– Strength Index Score (3 Year Range Pct):91.49.083.3
– Strength Index Reading (3 Year Range):Bullish-ExtremeBearish-ExtremeBullish-Extreme
NET POSITION MOVEMENT INDEX:
– 6-Week Change in Strength Index:0.21.1-15.4


Bitcoin Futures:

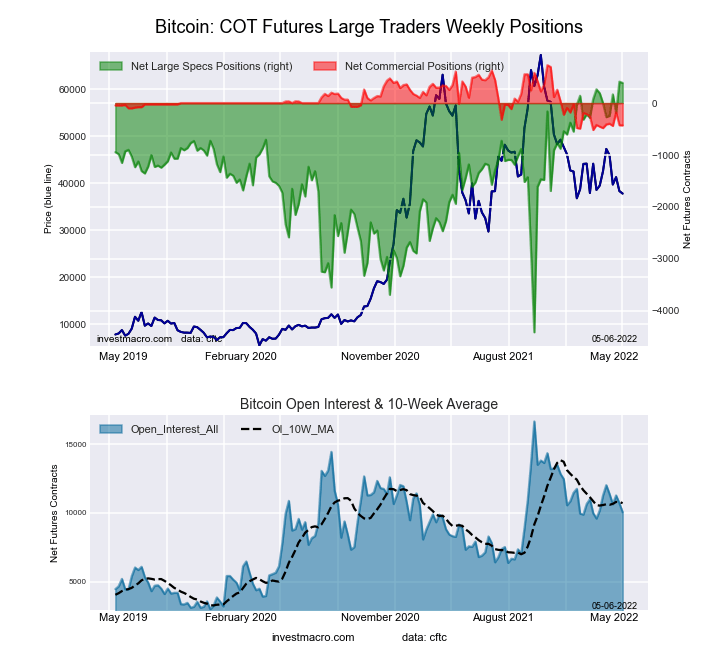
Bitcoin Crypto Futures COT ChartThe Bitcoin large speculator standing this week came in at a net position of 388 contracts in the data reported through Tuesday. This was a weekly decrease of -24 contracts from the previous week which had a total of 412 net contracts.

This week’s current strength score (the trader positioning range over the past three years, measured from 0 to 100) shows the speculators are currently Bullish-Extreme with a score of 99.5 percent. The commercials are Bearish-Extreme with a score of 7.1 percent and the small traders (not shown in chart) are Bearish-Extreme with a score of 13.9 percent.

BITCOIN StatisticsSPECULATORSCOMMERCIALSSMALL TRADERS
– Percent of Open Interest Longs:80.83.08.6
– Percent of Open Interest Shorts:76.97.28.2
– Net Position:388-42941
– Gross Longs:8,121298867
– Gross Shorts:7,733727826
– Long to Short Ratio:1.1 to 10.4 to 11.0 to 1
NET POSITION TREND:
– Strength Index Score (3 Year Range Pct):99.57.113.9
– Strength Index Reading (3 Year Range):Bullish-ExtremeBearish-ExtremeBearish-Extreme
NET POSITION MOVEMENT INDEX:
– 6-Week Change in Strength Index:8.04.2-10.0


Article By InvestMacroReceive our weekly COT Reports by Email

*COT Report: The COT data, released weekly to the public each Friday, is updated through the most recent Tuesday (data is 3 days old) and shows a quick view of how large speculators or non-commercials (for-profit traders) were positioned in the futures markets.

The CFTC categorizes trader positions according to commercial hedgers (traders who use futures contracts for hedging as part of the business), non-commercials (large traders who speculate to realize trading profits) and nonreportable traders (usually small traders/speculators) as well as their open interest (contracts open in the market at time of reporting).See CFTC criteria here.

Interest Rates: The Warning That Few Wanted to Heed

Here’s an update on this “hugely dangerous bet”

By Elliott Wave International

Back in mid-2020, a common sentiment toward interest rates was that they would stay historically low for the foreseeable future.

Indeed, in July of that year, no less than the Bank of Canada governor said (BNN Bloomberg):

‘Interest rates will be low for a long time’: Macklem

The next month, in August 2020, a Wall Street Journal headline used more dramatic language than “foreseeable future”:

Low Rates Forever!

In the same month and year, one chief investment officer also used the word “forever” in regard to low rates by saying, “We are moving from low for longer to low forever.”

The reason the mainstream was SO convinced was simple: 2020 was the first year of the pandemic, and it was widely believed that low rates would have to stay “forever” to “stimulate the economy.”

So, the July 2020 Elliott Wave Financial Forecast, a monthly publication which offers analysis of major U.S. financial markets, was going squarely against the prevailing sentiment toward interest rates when it showed this chart and said:

The declining line in blue on this chart is the Bloomberg Barclays U.S. Aggregate Corporate Bond Yield, which is at a record low 2.15%. The rising line in red is the Bloomberg Barclays U.S. Aggregate Corporate Duration, which is at a record high 8.6. Bond duration is a measure of how sensitive prices are to a move in interest rates. … Bond investors are now making a hugely dangerous bet that interest rates will stay low forever.

Fast forward to the April 2022 Elliott Wave Financial Forecast. Here’s a chart which shows you what has happened since that July 2020 analysis:

The chart updates both corporate yields and corporate durations. Corporate yields declined slightly further, to an all-time low at 1.74% on December 31, 2020, but they have since surged to 3.76%, more than doubling.

So much for the “low forever” sentiment.

Indeed, on April 14, a Bloomberg headline said:

Corporate Bond Rout is So Severe History Books Need a Revision

And, relatedly, on May 2, a CNBC headline noted:

10-year Treasury yield tops 3% for first time since 2018

And, given the Fed has historically followed the market, another CNBC headline — this one from May 4 — is not surprising:

Fed raises rates by half a percentage point — the biggest hike in two decades — to fight inflation

Now is the time to learn what Elliott wave analysis reveals about what to expect next for bond yields (or interest rates).

If you’re new to Elliott wave analysis, or need to freshen up on your knowledge, the ideal book to read is Frost & Prechter’s Elliott Wave Principle: Key to Market Behavior.

Here’s a quote from this Wall Street classic:

Although it is the best forecasting tool in existence, the Wave Principle is not primarily a forecasting tool; it is a detailed description of how markets behave. Nevertheless, that description does impart an immense amount of knowledge about the market’s position within the behavioral continuum and therefore about its probable ensuing path. The primary value of the Wave Principle is that it provides a context for market analysis. This context provides both a basis for disciplined thinking and a perspective on the market’s general position and outlook. At times, its accuracy in identifying, and even anticipating, changes in direction is almost unbelievable.

Here’s the good news: You can access the online version of the book for free once you become a Club EWI member.

Club EWI is the world’s largest Elliott wave educational community and members enjoy complimentary access to a wealth of Elliott wave educational resources, including Elliott Wave Principle: Key to Market Behavior. Club EWI is free to join and you can benefit from all of the free educational resources (videos and articles on financial markets and investing) without any obligation whatsoever.

Just follow this link to get started: Elliott Wave Principle: Key to Market Behavior — free and instant access.

This article was syndicated by Elliott Wave International and was originally published under the headline Interest Rates: The Warning That Few Wanted to Heed. EWI is the world’s largest market forecasting firm. Its staff of full-time analysts led by Chartered Market Technician Robert Prechter provides 24-hour-a-day market analysis to institutional and private investors around the world.

Copper Speculator bets fall to 2-year low as China lockdowns dent demand

By InvestMacro | COT | Data Tables | COT Leaders | Downloads | COT Newsletter

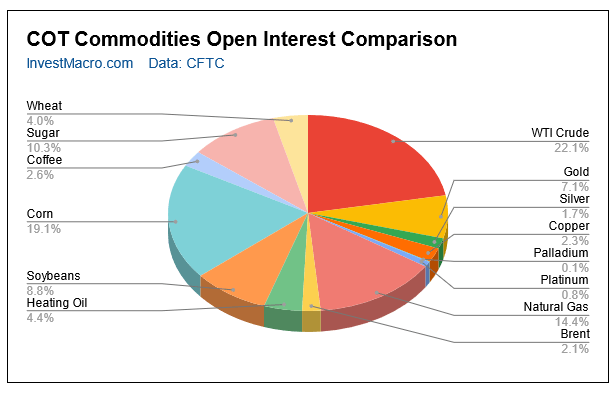
COT_Commodities_OI

Here are the latest charts and statistics for the Commitment of Traders (COT) data published by the Commodities Futures Trading Commission (CFTC).

The latest COT data is updated through Tuesday May 3rd 2022 and shows a quick view of how large traders (for-profit speculators and commercial entities) were positioned in the futures markets.

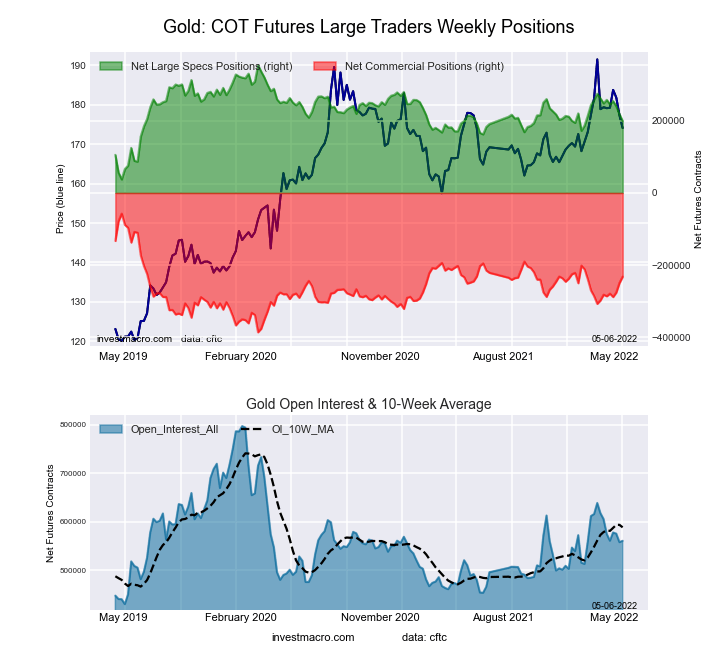
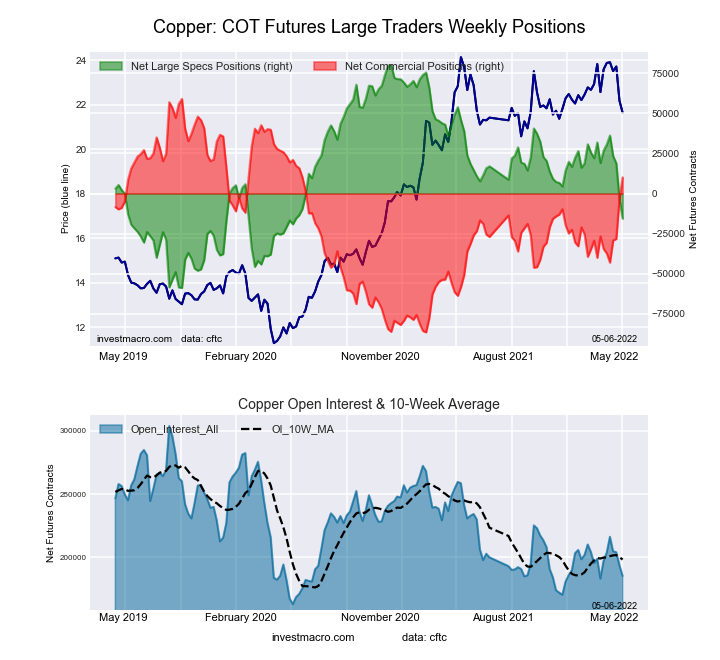
Highlighting the COT metals data is the recent decline in the Copper futures bets. The speculative net position in the Copper futures has fallen for two consecutive weeks and by a total of -19,408 contracts over that time-frame. This weakness has dropped the current standing for Copper net positions into a bearish position for a second straight week. Last week was the first time Copper has been in a bearish position since June 2nd of 2020, a span of ninety-nine weeks. This week’s further decline in speculator bets brings the current net standing (-15,623 contracts) to the lowest level in two years, dating back to May 5th of 2020.

Weighing heavily on the Copper sentiment is the shut downs in China due to Covid-19 outbreaks, particularly in Shanghai and Beijing. China is among the largest producers of Copper in the world and is the largest consumer of Copper in the world with the red metal being used in numerous manufacturing processes, industries and electronics being produced in the country. Any prolonged slowdown in China economic activity will have an outsized effect on the current demand for Copper.

The Copper price has pulled back recently with declines in each of the last four weeks that has taken approximately 10 percent off the futures price. Copper has been on a torrid bullish run that started in March 2020 when the pandemic burst open globally. Since the lows in March of 2020, Copper’s price rose by over 100 percent and now currently trades around the $4.25 per pound futures level.

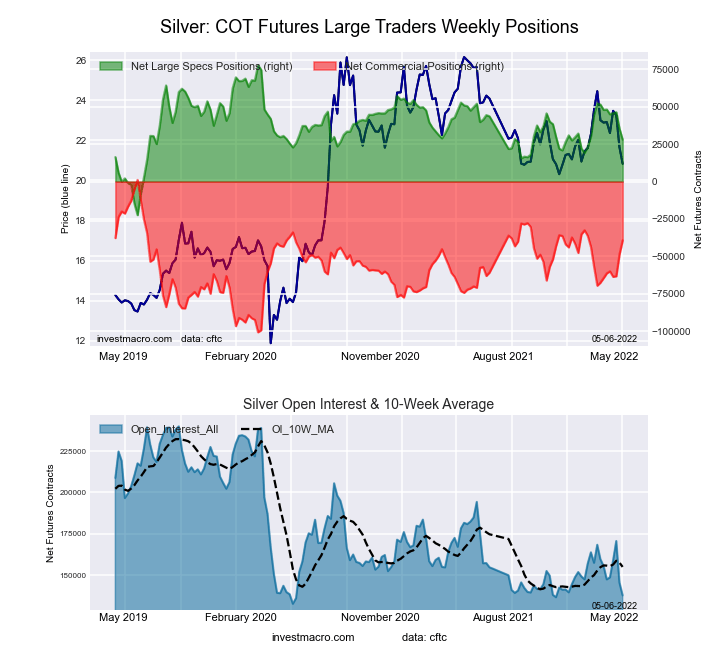
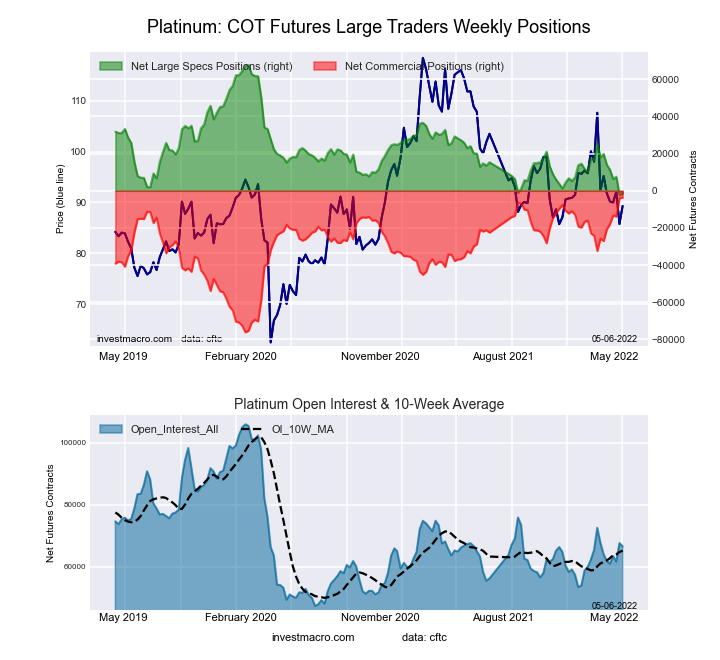
The only metals market we cover with higher speculator bets this week was Platinum (+816 contracts) while the markets with lower spec bets were Silver (-7,338 contracts), Gold (-18,856 contracts), Copper (-11,838 contracts) and Palladium (-245 contracts).


COT_Commodities

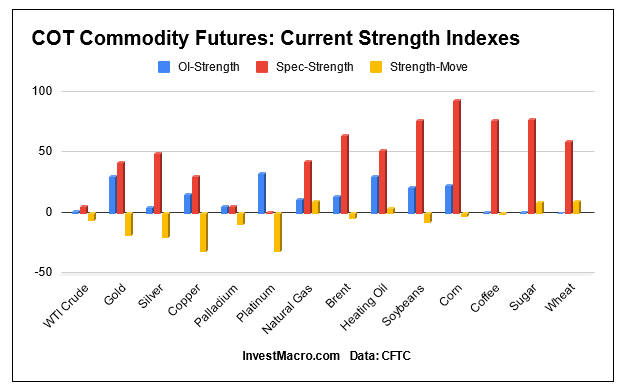
Speculator strength standings for each Commodity where strength index is current net position compared to past three years, above 80 is bullish extreme, below 20 is bearish extreme OI Strength = Current Open Interest level compared to last 3 years range Spec Strength = Current Net Speculator level compared to last 3 years range Strength Move = Six week change of Spec Strength


Data Snapshot of Commodity Market Traders | Columns Legend
May-03-2022OIOI-IndexSpec-NetSpec-IndexCom-NetCOM-IndexSmalls-NetSmalls-Index
WTI Crude1,751,5642321,7016-366,2139444,51278
Gold560,44131199,16842-231,8525532,68457
Silver137,692528,06850-39,3176011,2498
Copper185,25516-15,6233110,080665,54357
Palladium7,6386-2,75262,4559029761
Platinum66,54533-1,5411-3,6671005,20835
Natural Gas1,138,31912-117,7064372,8615444,84592
Brent168,12814-27,3186526,014371,30427
Heating Oil349,618316,45552-32,4343725,97988
Soybeans700,85622190,40277-165,35327-25,04929
Corn1,513,88023501,86594-451,2108-50,65514
Coffee206,337140,69777-43,007282,3105
Sugar818,6271201,59278-236,3942334,80251
Wheat319,233020,01260-14,22530-5,78782


Gold Comex Futures:

Gold Futures COT ChartThe Gold Comex Futures large speculator standing this week was a net position of 199,168 contracts in the data reported through Tuesday. This was a weekly reduction of -18,856 contracts from the previous week which had a total of 218,024 net contracts.

This week’s current strength score (the trader positioning range over the past three years, measured from 0 to 100) shows the speculators are currently Bearish with a score of 42.1 percent. The commercials are Bullish with a score of 55.4 percent and the small traders (not shown in chart) are Bullish with a score of 57.0 percent.

Gold Futures StatisticsSPECULATORSCOMMERCIALSSMALL TRADERS
– Percent of Open Interest Longs:52.423.39.1
– Percent of Open Interest Shorts:16.864.73.3
– Net Position:199,168-231,85232,684
– Gross Longs:293,439130,79551,270
– Gross Shorts:94,271362,64718,586
– Long to Short Ratio:3.1 to 10.4 to 12.8 to 1
NET POSITION TREND:
– Strength Index Score (3 Year Range Pct):42.155.457.0
– Strength Index Reading (3 Year Range):BearishBullishBullish
NET POSITION MOVEMENT INDEX:
– 6-Week Change in Strength Index:-18.317.9-2.5


Silver Comex Futures:

Silver Futures COT ChartThe Silver Comex Futures large speculator standing this week was a net position of 28,068 contracts in the data reported through Tuesday. This was a weekly decrease of -7,338 contracts from the previous week which had a total of 35,406 net contracts.

This week’s current strength score (the trader positioning range over the past three years, measured from 0 to 100) shows the speculators are currently Bullish with a score of 50.3 percent. The commercials are Bullish with a score of 60.3 percent and the small traders (not shown in chart) are Bearish-Extreme with a score of 8.4 percent.

Silver Futures StatisticsSPECULATORSCOMMERCIALSSMALL TRADERS
– Percent of Open Interest Longs:41.236.417.3
– Percent of Open Interest Shorts:20.865.09.2
– Net Position:28,068-39,31711,249
– Gross Longs:56,76450,18423,860
– Gross Shorts:28,69689,50112,611
– Long to Short Ratio:2.0 to 10.6 to 11.9 to 1
NET POSITION TREND:
– Strength Index Score (3 Year Range Pct):50.360.38.4
– Strength Index Reading (3 Year Range):BullishBullishBearish-Extreme
NET POSITION MOVEMENT INDEX:
– 6-Week Change in Strength Index:-19.824.8-31.2


Copper Grade #1 Futures:

Copper Futures COT ChartThe Copper Grade #1 Futures large speculator standing this week was a net position of -15,623 contracts in the data reported through Tuesday. This was a weekly reduction of -11,838 contracts from the previous week which had a total of -3,785 net contracts.

This week’s current strength score (the trader positioning range over the past three years, measured from 0 to 100) shows the speculators are currently Bearish with a score of 31.1 percent. The commercials are Bullish with a score of 66.4 percent and the small traders (not shown in chart) are Bullish with a score of 57.3 percent.

Copper Futures StatisticsSPECULATORSCOMMERCIALSSMALL TRADERS
– Percent of Open Interest Longs:35.446.79.7
– Percent of Open Interest Shorts:43.841.26.7
– Net Position:-15,62310,0805,543
– Gross Longs:65,59086,45818,009
– Gross Shorts:81,21376,37812,466
– Long to Short Ratio:0.8 to 11.1 to 11.4 to 1
NET POSITION TREND:
– Strength Index Score (3 Year Range Pct):31.166.457.3
– Strength Index Reading (3 Year Range):BearishBullishBullish
NET POSITION MOVEMENT INDEX:
– 6-Week Change in Strength Index:-30.630.7-13.0


Platinum Futures:

Platinum Futures COT ChartThe Platinum Futures large speculator standing this week was a net position of -1,541 contracts in the data reported through Tuesday. This was a weekly gain of 816 contracts from the previous week which had a total of -2,357 net contracts.

This week’s current strength score (the trader positioning range over the past three years, measured from 0 to 100) shows the speculators are currently Bearish-Extreme with a score of 1.2 percent. The commercials are Bullish-Extreme with a score of 100.0 percent and the small traders (not shown in chart) are Bearish with a score of 34.6 percent.

Platinum Futures StatisticsSPECULATORSCOMMERCIALSSMALL TRADERS
– Percent of Open Interest Longs:44.438.813.5
– Percent of Open Interest Shorts:46.744.35.6
– Net Position:-1,541-3,6675,208
– Gross Longs:29,51625,8308,956
– Gross Shorts:31,05729,4973,748
– Long to Short Ratio:1.0 to 10.9 to 12.4 to 1
NET POSITION TREND:
– Strength Index Score (3 Year Range Pct):1.2100.034.6
– Strength Index Reading (3 Year Range):Bearish-ExtremeBullish-ExtremeBearish
NET POSITION MOVEMENT INDEX:
– 6-Week Change in Strength Index:-30.532.3-28.3


Palladium Futures:

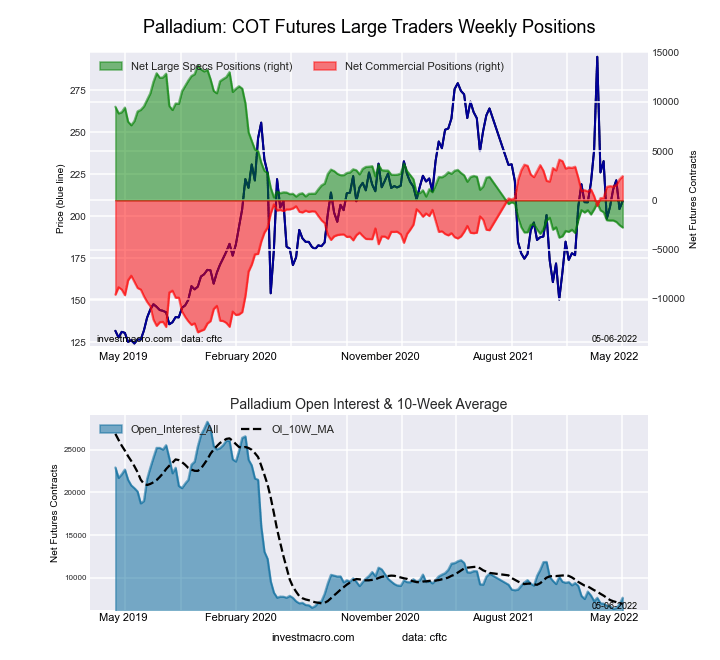
Palladium Futures COT ChartThe Palladium Futures large speculator standing this week was a net position of -2,752 contracts in the data reported through Tuesday. This was a weekly lowering of -245 contracts from the previous week which had a total of -2,507 net contracts.

This week’s current strength score (the trader positioning range over the past three years, measured from 0 to 100) shows the speculators are currently Bearish-Extreme with a score of 5.8 percent. The commercials are Bullish-Extreme with a score of 90.5 percent and the small traders (not shown in chart) are Bullish with a score of 61.1 percent.

Palladium Futures StatisticsSPECULATORSCOMMERCIALSSMALL TRADERS
– Percent of Open Interest Longs:12.759.816.9
– Percent of Open Interest Shorts:48.827.713.0
– Net Position:-2,7522,455297
– Gross Longs:9734,5671,290
– Gross Shorts:3,7252,112993
– Long to Short Ratio:0.3 to 12.2 to 11.3 to 1
NET POSITION TREND:
– Strength Index Score (3 Year Range Pct):5.890.561.1
– Strength Index Reading (3 Year Range):Bearish-ExtremeBullish-ExtremeBullish
NET POSITION MOVEMENT INDEX:
– 6-Week Change in Strength Index:-8.812.7-38.9


Article By InvestMacroReceive our weekly COT Reports by Email

*COT Report: The COT data, released weekly to the public each Friday, is updated through the most recent Tuesday (data is 3 days old) and shows a quick view of how large speculators or non-commercials (for-profit traders) were positioned in the futures markets.

The CFTC categorizes trader positions according to commercial hedgers (traders who use futures contracts for hedging as part of the business), non-commercials (large traders who speculate to realize trading profits) and nonreportable traders (usually small traders/speculators) as well as their open interest (contracts open in the market at time of reporting).See CFTC criteria here.

COT Futures: This Week’s Energy Markets Charts

By InvestMacro | COT | Data Tables | COT Leaders | Downloads | COT Newsletter

COT_Commodities_OI

Here are the latest charts and statistics for the Commitment of Traders (COT) data published by the Commodities Futures Trading Commission (CFTC).

The latest COT data is updated through Tuesday May 3rd 2022 and shows a quick view of how large traders (for-profit speculators and commercial entities) were positioned in the futures markets.

The markets with higher speculator bets this week were WTI Crude Oil (5,638 contracts) and Brent Crude Oil (11,213 contracts) while the markets with lower speculator bets this week were Natural Gas (-326 contracts), Heating Oil (-9,228 contracts), Gasoline (-860 contracts) and the Bloomberg Commodity Index (-2,138 contracts).


Data Snapshot of Commodity Market Traders | Columns Legend
May-03-2022OIOI-IndexSpec-NetSpec-IndexCom-NetCOM-IndexSmalls-NetSmalls-Index
WTI Crude1,751,5642321,7016-366,2139444,51278
Gold560,44131199,16842-231,8525532,68457
Silver137,692528,06850-39,3176011,2498
Copper185,25516-15,6233110,080665,54357
Palladium7,6386-2,75262,4559029761
Platinum66,54533-1,5411-3,6671005,20835
Natural Gas1,138,31912-117,7064372,8615444,84592
Brent168,12814-27,3186526,014371,30427
Heating Oil349,618316,45552-32,4343725,97988
Soybeans700,85622190,40277-165,35327-25,04929
Corn1,513,88023501,86594-451,2108-50,65514
Coffee206,337140,69777-43,007282,3105
Sugar818,6271201,59278-236,3942334,80251
Wheat319,233020,01260-14,22530-5,78782


WTI Crude Oil Futures:

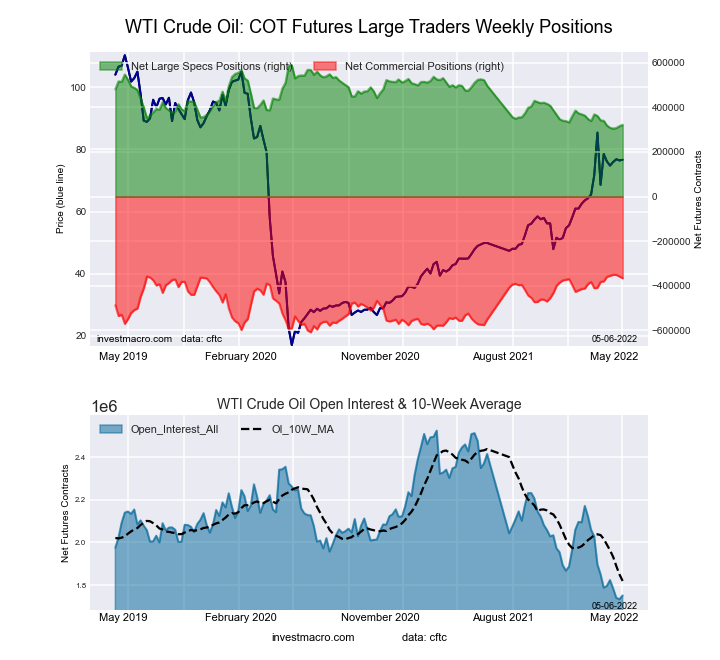
WTI Crude Oil Futures COT ChartThe WTI Crude Oil Futures large speculator standing this week reached a net position of 321,701 contracts in the data reported through Tuesday. This was a weekly gain of 5,638 contracts from the previous week which had a total of 316,063 net contracts.

This week’s current strength score (the trader positioning range over the past three years, measured from 0 to 100) shows the speculators are currently Bearish-Extreme with a score of 5.9 percent. The commercials are Bullish-Extreme with a score of 93.9 percent and the small traders (not shown in chart) are Bullish with a score of 77.7 percent.

WTI Crude Oil Futures StatisticsSPECULATORSCOMMERCIALSSMALL TRADERS
– Percent of Open Interest Longs:24.035.45.2
– Percent of Open Interest Shorts:5.656.32.6
– Net Position:321,701-366,21344,512
– Gross Longs:419,692620,32790,371
– Gross Shorts:97,991986,54045,859
– Long to Short Ratio:4.3 to 10.6 to 12.0 to 1
NET POSITION TREND:
– Strength Index Score (3 Year Range Pct):5.993.977.7
– Strength Index Reading (3 Year Range):Bearish-ExtremeBullish-ExtremeBullish
NET POSITION MOVEMENT INDEX:
– 6-Week Change in Strength Index:-6.45.46.2


Brent Crude Oil Futures:

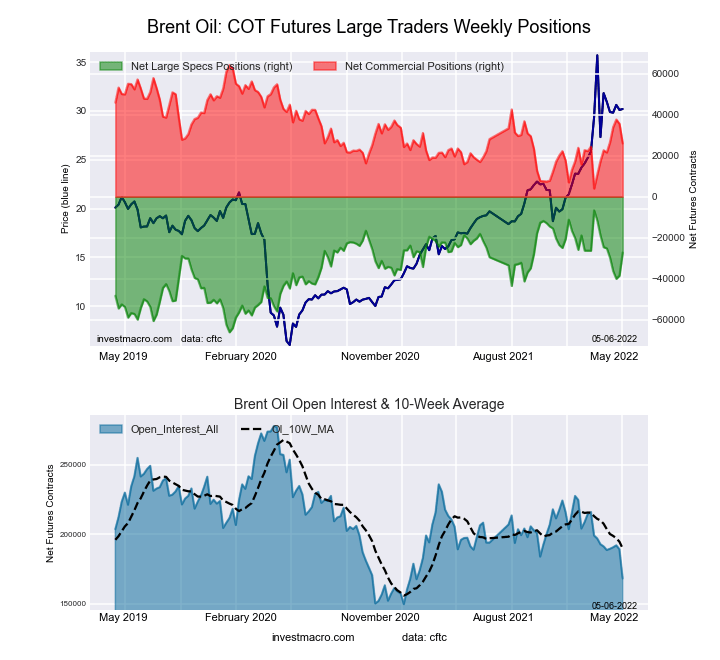
Brent Last Day Crude Oil Futures COT ChartThe Brent Crude Oil Futures large speculator standing this week reached a net position of -27,318 contracts in the data reported through Tuesday. This was a weekly increase of 11,213 contracts from the previous week which had a total of -38,531 net contracts.

This week’s current strength score (the trader positioning range over the past three years, measured from 0 to 100) shows the speculators are currently Bullish with a score of 65.4 percent. The commercials are Bearish with a score of 36.6 percent and the small traders (not shown in chart) are Bearish with a score of 26.9 percent.

Brent Crude Oil Futures StatisticsSPECULATORSCOMMERCIALSSMALL TRADERS
– Percent of Open Interest Longs:20.646.74.1
– Percent of Open Interest Shorts:36.931.23.3
– Net Position:-27,31826,0141,304
– Gross Longs:34,68578,4916,840
– Gross Shorts:62,00352,4775,536
– Long to Short Ratio:0.6 to 11.5 to 11.2 to 1
NET POSITION TREND:
– Strength Index Score (3 Year Range Pct):65.436.626.9
– Strength Index Reading (3 Year Range):BullishBearishBearish
NET POSITION MOVEMENT INDEX:
– 6-Week Change in Strength Index:-4.55.6-9.8


Natural Gas Futures:

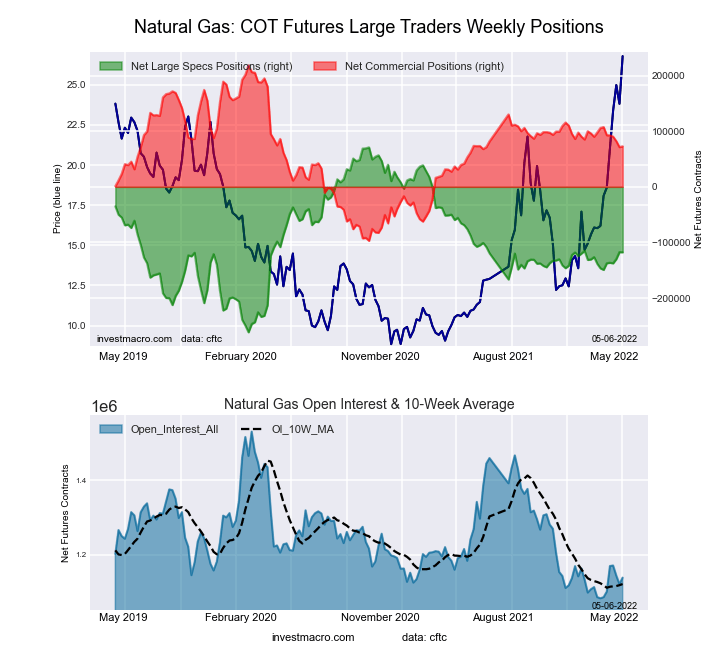
Natural Gas Futures COT ChartThe Natural Gas Futures large speculator standing this week reached a net position of -117,706 contracts in the data reported through Tuesday. This was a weekly reduction of -326 contracts from the previous week which had a total of -117,380 net contracts.

This week’s current strength score (the trader positioning range over the past three years, measured from 0 to 100) shows the speculators are currently Bearish with a score of 43.3 percent. The commercials are Bullish with a score of 53.8 percent and the small traders (not shown in chart) are Bullish-Extreme with a score of 92.3 percent.

Natural Gas Futures StatisticsSPECULATORSCOMMERCIALSSMALL TRADERS
– Percent of Open Interest Longs:21.738.96.4
– Percent of Open Interest Shorts:32.032.52.5
– Net Position:-117,70672,86144,845
– Gross Longs:247,092442,60472,900
– Gross Shorts:364,798369,74328,055
– Long to Short Ratio:0.7 to 11.2 to 12.6 to 1
NET POSITION TREND:
– Strength Index Score (3 Year Range Pct):43.353.892.3
– Strength Index Reading (3 Year Range):BearishBullishBullish-Extreme
NET POSITION MOVEMENT INDEX:
– 6-Week Change in Strength Index:9.5-11.07.5


Gasoline Blendstock Futures:

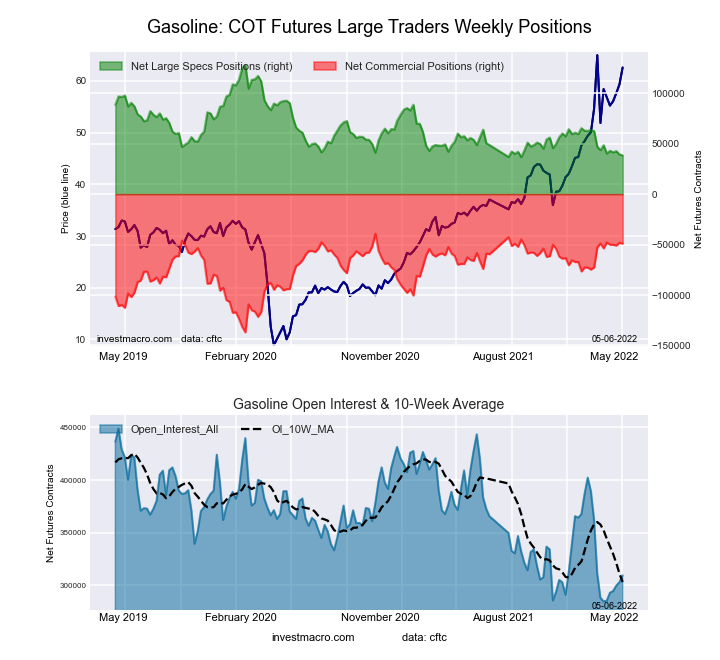
RBOB Gasoline Energy Futures COT ChartThe Gasoline Blendstock Futures large speculator standing this week reached a net position of 38,381 contracts in the data reported through Tuesday. This was a weekly decline of -860 contracts from the previous week which had a total of 39,241 net contracts.

This week’s current strength score (the trader positioning range over the past three years, measured from 0 to 100) shows the speculators are currently Bearish-Extreme with a score of 9.2 percent. The commercials are Bullish-Extreme with a score of 88.0 percent and the small traders (not shown in chart) are Bullish-Extreme with a score of 83.4 percent.

Nasdaq Mini Futures StatisticsSPECULATORSCOMMERCIALSSMALL TRADERS
– Percent of Open Interest Longs:25.552.17.3
– Percent of Open Interest Shorts:13.168.03.9
– Net Position:38,381-48,99110,610
– Gross Longs:79,017161,24722,690
– Gross Shorts:40,636210,23812,080
– Long to Short Ratio:1.9 to 10.8 to 11.9 to 1
NET POSITION TREND:
– Strength Index Score (3 Year Range Pct):9.288.083.4
– Strength Index Reading (3 Year Range):Bearish-ExtremeBullish-ExtremeBullish-Extreme
NET POSITION MOVEMENT INDEX:
– 6-Week Change in Strength Index:-10.24.735.3


#2 Heating Oil NY-Harbor Futures:

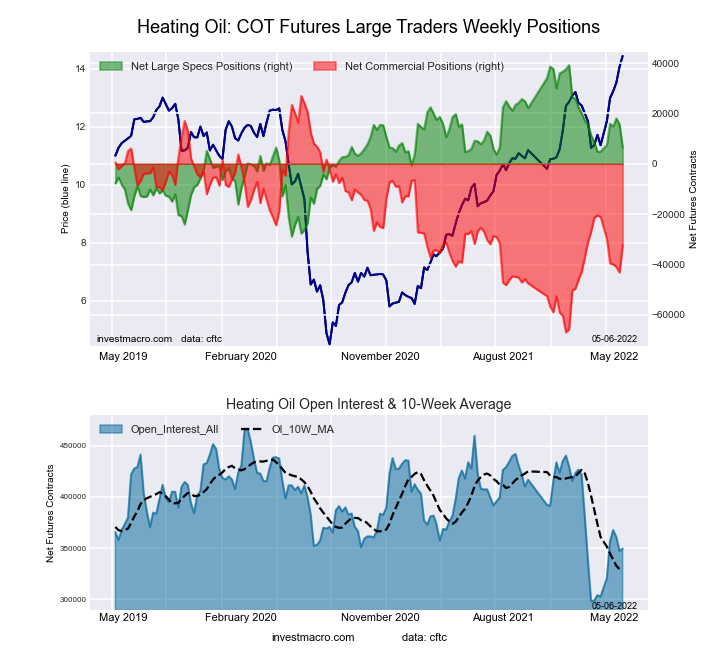
NY Harbor Heating Oil Energy Futures COT ChartThe #2 Heating Oil NY-Harbor Futures large speculator standing this week reached a net position of 6,455 contracts in the data reported through Tuesday. This was a weekly fall of -9,228 contracts from the previous week which had a total of 15,683 net contracts.

This week’s current strength score (the trader positioning range over the past three years, measured from 0 to 100) shows the speculators are currently Bullish with a score of 51.9 percent. The commercials are Bearish with a score of 36.7 percent and the small traders (not shown in chart) are Bullish-Extreme with a score of 88.4 percent.

Heating Oil Futures StatisticsSPECULATORSCOMMERCIALSSMALL TRADERS
– Percent of Open Interest Longs:17.050.814.4
– Percent of Open Interest Shorts:15.160.16.9
– Net Position:6,455-32,43425,979
– Gross Longs:59,340177,62650,210
– Gross Shorts:52,885210,06024,231
– Long to Short Ratio:1.1 to 10.8 to 12.1 to 1
NET POSITION TREND:
– Strength Index Score (3 Year Range Pct):51.936.788.4
– Strength Index Reading (3 Year Range):BullishBearishBullish-Extreme
NET POSITION MOVEMENT INDEX:
– 6-Week Change in Strength Index:4.2-10.323.6


Bloomberg Commodity Index Futures:

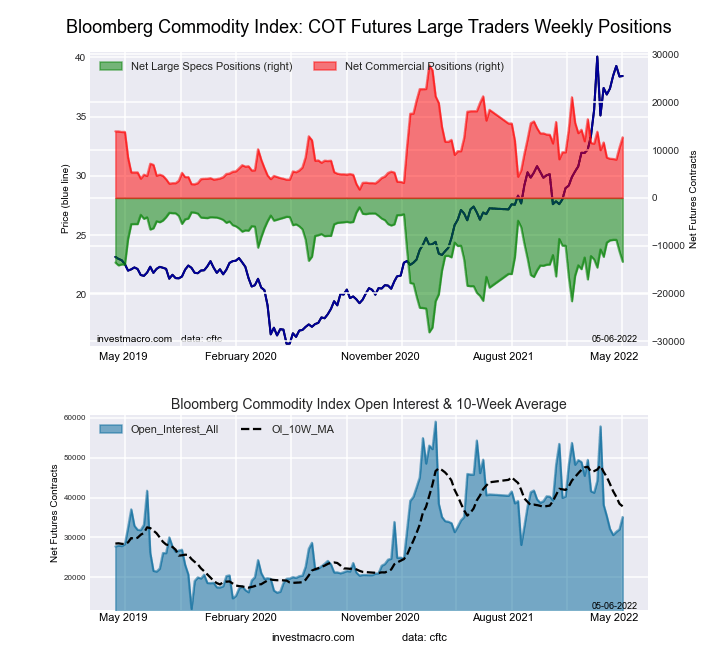
Bloomberg Commodity Index Futures COT ChartThe Bloomberg Commodity Index Futures large speculator standing this week reached a net position of -13,354 contracts in the data reported through Tuesday. This was a weekly fall of -2,138 contracts from the previous week which had a total of -11,216 net contracts.

This week’s current strength score (the trader positioning range over the past three years, measured from 0 to 100) shows the speculators are currently Bullish with a score of 56.4 percent. The commercials are Bearish with a score of 42.0 percent and the small traders (not shown in chart) are Bearish with a score of 44.0 percent.

Bloomberg Index Futures StatisticsSPECULATORSCOMMERCIALSSMALL TRADERS
– Percent of Open Interest Longs:58.236.02.1
– Percent of Open Interest Shorts:96.20.00.2
– Net Position:-13,35412,665689
– Gross Longs:20,45812,665743
– Gross Shorts:33,812054
– Long to Short Ratio:0.6 to 1inf to 113.8 to 1
NET POSITION TREND:
– Strength Index Score (3 Year Range Pct):56.442.044.0
– Strength Index Reading (3 Year Range):BullishBearishBearish
NET POSITION MOVEMENT INDEX:
– 6-Week Change in Strength Index:-4.04.1-1.5


Article By InvestMacroReceive our weekly COT Reports by Email

*COT Report: The COT data, released weekly to the public each Friday, is updated through the most recent Tuesday (data is 3 days old) and shows a quick view of how large speculators or non-commercials (for-profit traders) were positioned in the futures markets.

The CFTC categorizes trader positions according to commercial hedgers (traders who use futures contracts for hedging as part of the business), non-commercials (large traders who speculate to realize trading profits) and nonreportable traders (usually small traders/speculators) as well as their open interest (contracts open in the market at time of reporting).See CFTC criteria here.