
By InvestMacro
Here are the latest charts and statistics for the Commitment of Traders (COT) reports data published by the Commodities Futures Trading Commission (CFTC).
The latest COT data is updated through Tuesday January 17th and shows a quick view of how large traders (for-profit speculators and commercial entities) were positioned in the futures markets.
Weekly Speculator Changes led by Corn & Soybeans
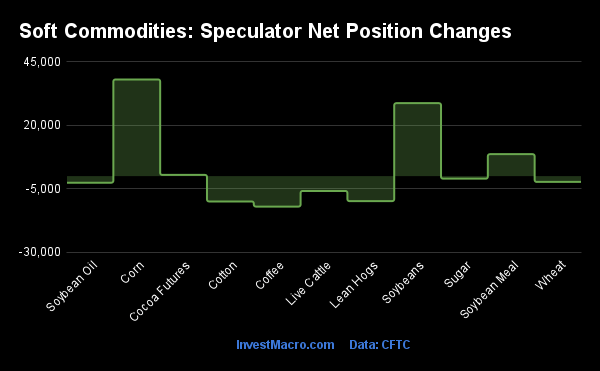
The COT soft commodities markets speculator bets were lower this week as four out of the eleven softs markets we cover had higher positioning while the other seven markets had lower speculator contracts.
Leading the gains for the softs markets was Corn (38,078 contracts) with Soybeans (28,737 contracts), Soybean Meal (8,640 contracts) and Cocoa (477 contracts) also showing positive weeks.
The markets with the declines in speculator bets this week were Coffee (-12,006 contracts), Lean Hogs (-9,862 contracts), Cotton (-9,991 contracts), Sugar (-1,015 contracts), Wheat (-2,298 contracts), Soybean Oil (-2,604 contracts) and Live Cattle (-5,851 contracts) also registering lower bets on the week.
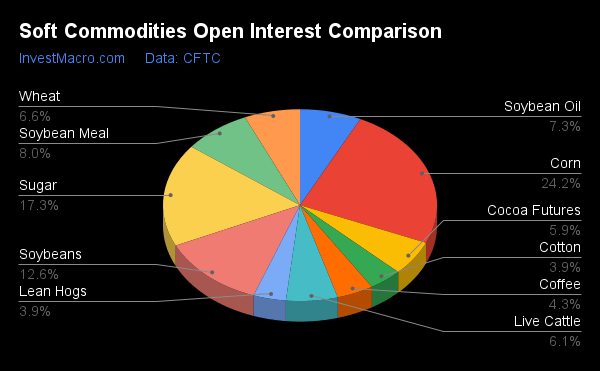
Highlighting the COT soft commodities data this week is the continued declines in the Wheat speculator positioning. The large speculator bets for Wheat fell this week for a second consecutive week and for the twelfth time in the past fifteen weeks. Speculators bets have now pushed the overall net position standing for Wheat (currently at -42,014 contracts) to the most bearish level in the past 192 weeks, dating back to May 14th of 2019.
Wheat prices have been under pressure as well with prices trading at near the lowest levels since 2021. Helping to keep Wheat sentiment and prices down have been better than expected plantings and supply of Wheat in the USA and globally.
| Jan-17-2023 | OI | OI-Index | Spec-Net | Spec-Index | Com-Net | COM-Index | Smalls-Net | Smalls-Index |
|---|---|---|---|---|---|---|---|---|
| WTI Crude | 1,613,466 | 19 | 239,218 | 9 | -255,599 | 92 | 16,381 | 26 |
| Gold | 491,818 | 22 | 153,240 | 34 | -175,913 | 65 | 22,673 | 37 |
| Silver | 131,862 | 9 | 31,468 | 49 | -45,367 | 52 | 13,899 | 40 |
| Copper | 201,455 | 42 | 16,238 | 49 | -22,695 | 49 | 6,457 | 63 |
| Palladium | 8,799 | 16 | -2,751 | 12 | 2,902 | 86 | -151 | 33 |
| Platinum | 71,144 | 41 | 23,544 | 41 | -28,913 | 59 | 5,369 | 40 |
| Natural Gas | 1,082,458 | 24 | -177,219 | 25 | 146,418 | 77 | 30,801 | 53 |
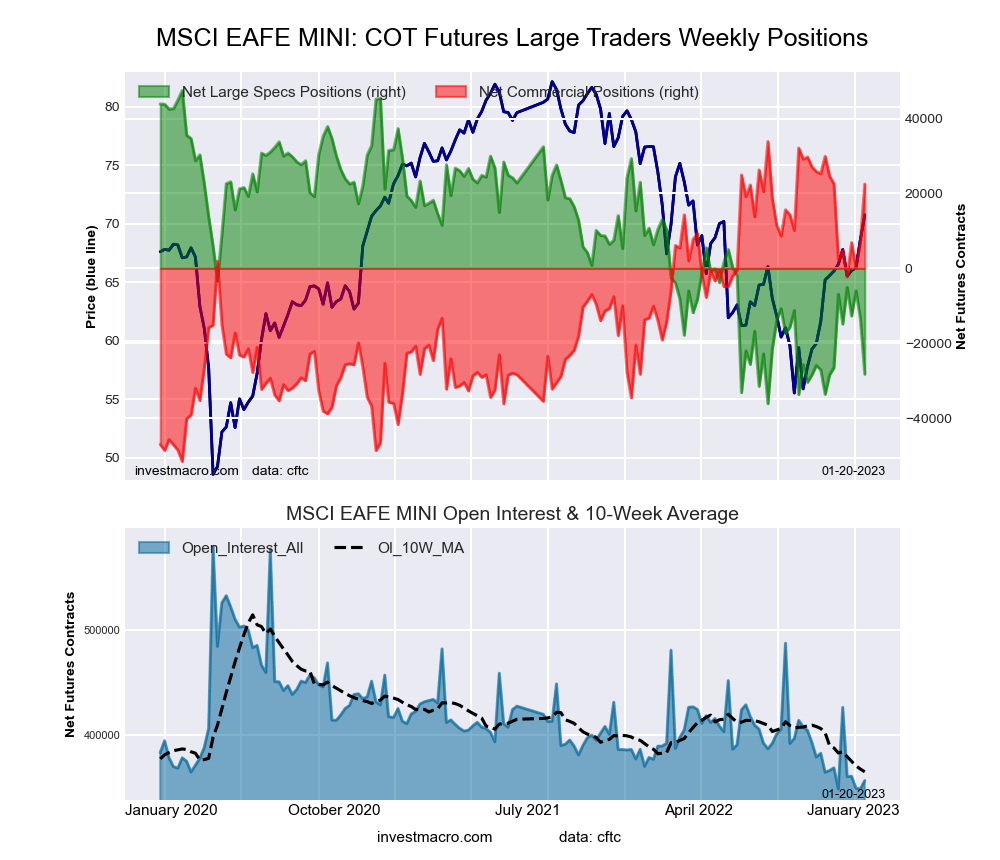
| Brent | 147,172 | 9 | -25,980 | 62 | 23,414 | 37 | 2,566 | 44 |
| Heating Oil | 269,911 | 24 | 18,506 | 70 | -40,612 | 28 | 22,106 | 75 |
| Soybeans | 651,328 | 17 | 169,065 | 64 | -130,790 | 48 | -38,275 | 6 |
| Corn | 1,251,033 | 8 | 271,873 | 65 | -213,798 | 41 | -58,075 | 11 |
| Coffee | 224,829 | 31 | -26,745 | 0 | 24,251 | 100 | 2,494 | 34 |
| Sugar | 898,526 | 37 | 186,698 | 58 | -233,144 | 36 | 46,446 | 65 |
| Wheat | 340,830 | 23 | -42,014 | 0 | 45,261 | 100 | -3,247 | 94 |
Strength Scores led by Soybean Meal & Live Cattle
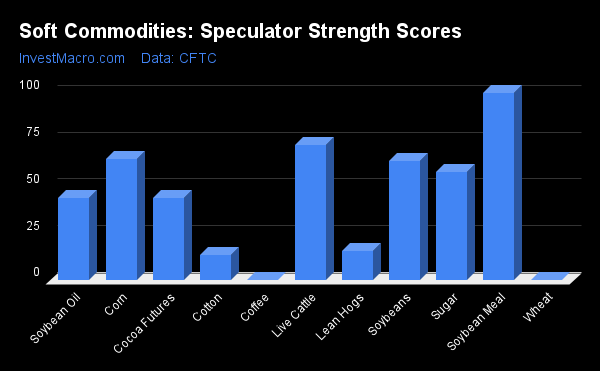
COT Strength Scores (a normalized measure of Speculator positions over a 3-Year range, from 0 to 100 where above 80 is Extreme-Bullish and below 20 is Extreme-Bearish) showed that Soybean Meal (100 percent) and Live Cattle (72 percent) lead the softs markets this week. Corn (65 percent), Soybeans (64 percent) and Sugar (58 percent) come in as the next highest in the weekly strength scores.
On the downside, Wheat (0 percent), Coffee (0 percent), Cotton (13 percent) and the Lean Hogs (16 percent) come in at the lowest strength levels currently and are all in Extreme-Bearish territory (below 20 percent).
Strength Statistics:
Corn (64.8 percent) vs Corn previous week (59.9 percent)
Sugar (58.1 percent) vs Sugar previous week (58.5 percent)
Coffee (0.0 percent) vs Coffee previous week (12.3 percent)
Soybeans (63.9 percent) vs Soybeans previous week (54.7 percent)
Soybean Oil (43.8 percent) vs Soybean Oil previous week (45.6 percent)
Soybean Meal (100.0 percent) vs Soybean Meal previous week (96.0 percent)
Live Cattle (72.3 percent) vs Live Cattle previous week (79.7 percent)
Lean Hogs (15.8 percent) vs Lean Hogs previous week (27.7 percent)
Cotton (13.3 percent) vs Cotton previous week (20.9 percent)
Cocoa (44.2 percent) vs Cocoa previous week (43.8 percent)
Wheat (0.0 percent) vs Wheat previous week (2.2 percent)
Soybeans & Live Cattle top the 6-Week Strength Trends
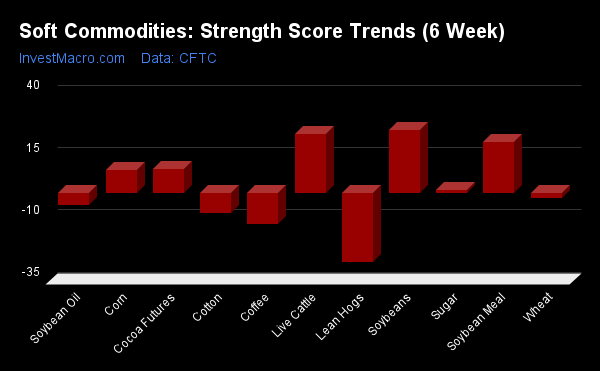
COT Strength Score Trends (or move index, calculates the 6-week changes in strength scores) showed that Soybeans (25 percent) and Live Cattle (24 percent) lead the past six weeks trends for soft commodities. Soybean Meal (20 percent), Cocoa (10 percent) and Corn (9 percent) are the next highest positive movers in the latest trends data.
Lean Hogs (-28 percent) leads the downside trend scores currently with Coffee (-12 percent), Cotton (-8 percent) and Soybean Oil (-5 percent) following next with lower trend scores.
Strength Trend Statistics:
Corn (9.4 percent) vs Corn previous week (-4.7 percent)
Sugar (1.2 percent) vs Sugar previous week (3.0 percent)
Coffee (-12.4 percent) vs Coffee previous week (-0.1 percent)
Soybeans (25.4 percent) vs Soybeans previous week (17.0 percent)
Soybean Oil (-4.7 percent) vs Soybean Oil previous week (-28.7 percent)
Soybean Meal (20.5 percent) vs Soybean Meal previous week (25.7 percent)
Live Cattle (23.7 percent) vs Live Cattle previous week (32.5 percent)
Lean Hogs (-27.8 percent) vs Lean Hogs previous week (-11.8 percent)
Cotton (-8.2 percent) vs Cotton previous week (1.0 percent)
Cocoa (9.6 percent) vs Cocoa previous week (17.3 percent)
Wheat (-2.0 percent) vs Wheat previous week (-6.2 percent)
Individual Soft Commodities Markets:
CORN Futures:
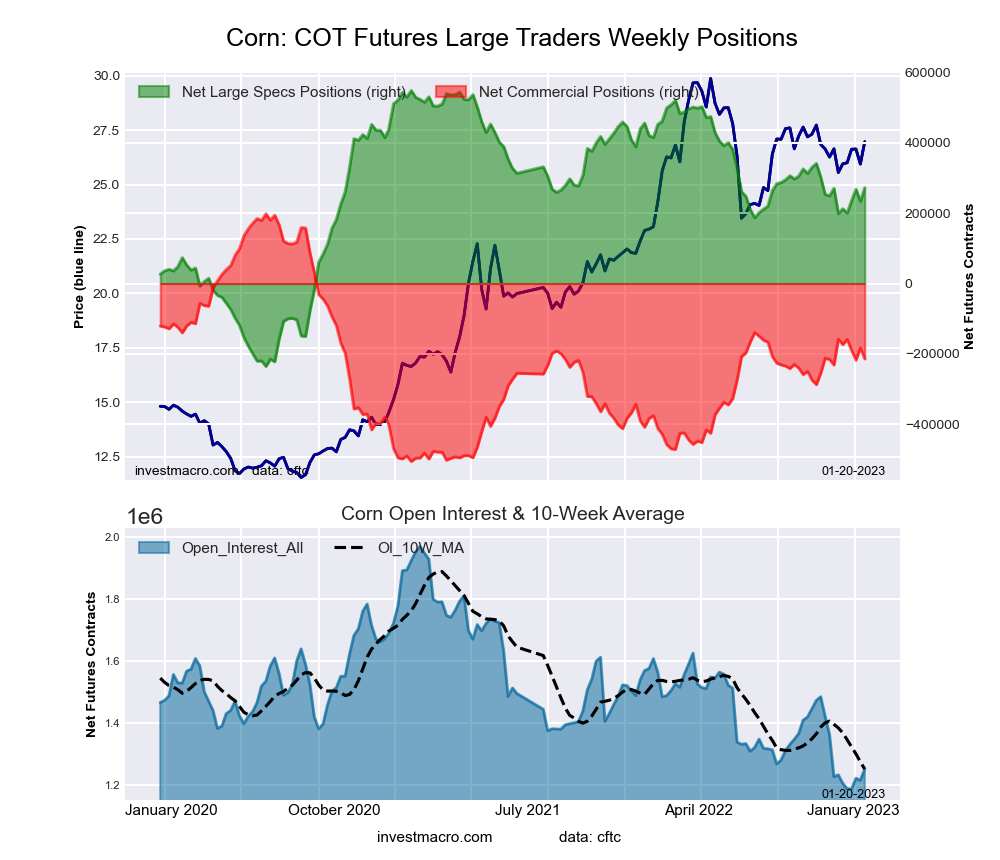 The CORN large speculator standing this week resulted in a net position of 271,873 contracts in the data reported through Tuesday. This was a weekly boost of 38,078 contracts from the previous week which had a total of 233,795 net contracts.
This week’s current strength score (the trader positioning range over the past three years, measured from 0 to 100) shows the speculators are currently Bullish with a score of 64.8 percent. The commercials are Bearish with a score of 41.5 percent and the small traders (not shown in chart) are Bearish-Extreme with a score of 11.4 percent.
| CORN Futures Statistics | SPECULATORS | COMMERCIALS | SMALL TRADERS |
| – Percent of Open Interest Longs: | 30.1 | 44.7 | 9.5 |
| – Percent of Open Interest Shorts: | 8.4 | 61.7 | 14.1 |
| – Net Position: | 271,873 | -213,798 | -58,075 |
| – Gross Longs: | 376,732 | 558,706 | 118,719 |
| – Gross Shorts: | 104,859 | 772,504 | 176,794 |
| – Long to Short Ratio: | 3.6 to 1 | 0.7 to 1 | 0.7 to 1 |
| NET POSITION TREND: | |||
| – Strength Index Score (3 Year Range Pct): | 64.8 | 41.5 | 11.4 |
| – Strength Index Reading (3 Year Range): | Bullish | Bearish | Bearish-Extreme |
| NET POSITION MOVEMENT INDEX: | |||
| – 6-Week Change in Strength Index: | 9.4 | -8.0 | -11.7 |
SUGAR Futures:
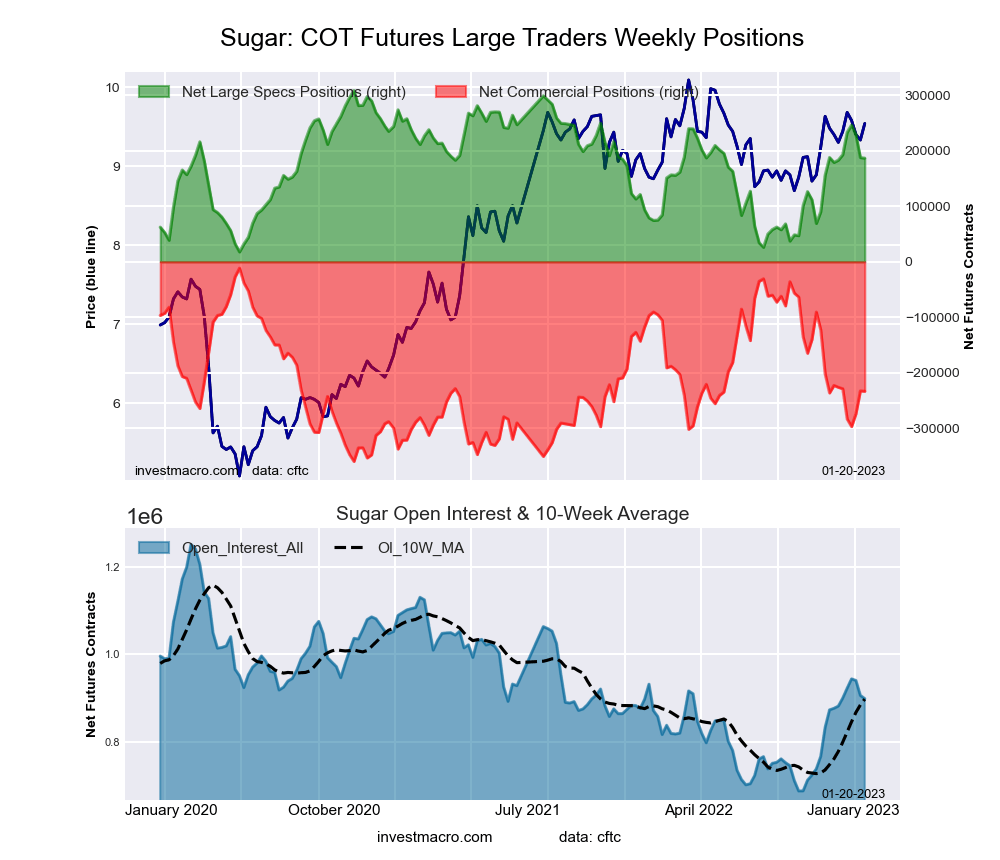 The SUGAR large speculator standing this week resulted in a net position of 186,698 contracts in the data reported through Tuesday. This was a weekly decrease of -1,015 contracts from the previous week which had a total of 187,713 net contracts.
This week’s current strength score (the trader positioning range over the past three years, measured from 0 to 100) shows the speculators are currently Bullish with a score of 58.1 percent. The commercials are Bearish with a score of 36.3 percent and the small traders (not shown in chart) are Bullish with a score of 65.3 percent.
| SUGAR Futures Statistics | SPECULATORS | COMMERCIALS | SMALL TRADERS |
| – Percent of Open Interest Longs: | 30.5 | 43.1 | 10.2 |
| – Percent of Open Interest Shorts: | 9.7 | 69.0 | 5.0 |
| – Net Position: | 186,698 | -233,144 | 46,446 |
| – Gross Longs: | 273,666 | 387,186 | 91,248 |
| – Gross Shorts: | 86,968 | 620,330 | 44,802 |
| – Long to Short Ratio: | 3.1 to 1 | 0.6 to 1 | 2.0 to 1 |
| NET POSITION TREND: | |||
| – Strength Index Score (3 Year Range Pct): | 58.1 | 36.3 | 65.3 |
| – Strength Index Reading (3 Year Range): | Bullish | Bearish | Bullish |
| NET POSITION MOVEMENT INDEX: | |||
| – 6-Week Change in Strength Index: | 1.2 | -2.0 | 4.3 |
COFFEE Futures:
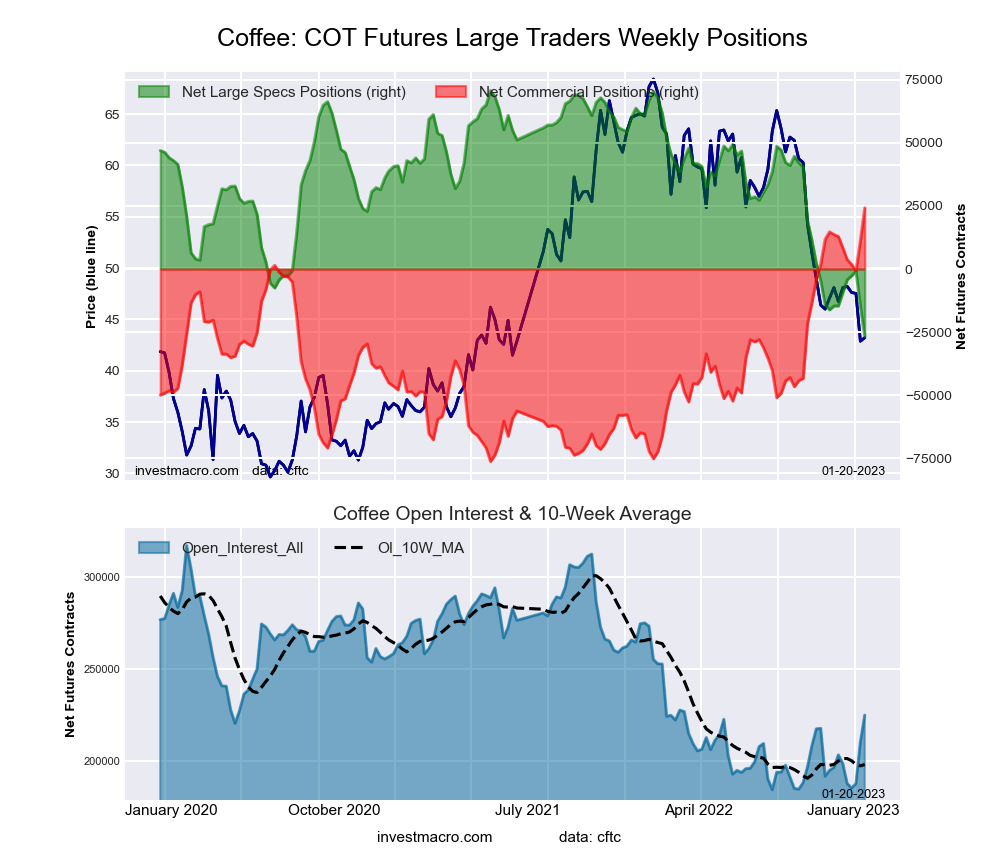 The COFFEE large speculator standing this week resulted in a net position of -26,745 contracts in the data reported through Tuesday. This was a weekly decrease of -12,006 contracts from the previous week which had a total of -14,739 net contracts.
This week’s current strength score (the trader positioning range over the past three years, measured from 0 to 100) shows the speculators are currently Bearish-Extreme with a score of 0.0 percent. The commercials are Bullish-Extreme with a score of 100.0 percent and the small traders (not shown in chart) are Bearish with a score of 34.1 percent.
| COFFEE Futures Statistics | SPECULATORS | COMMERCIALS | SMALL TRADERS |
| – Percent of Open Interest Longs: | 19.9 | 55.0 | 4.8 |
| – Percent of Open Interest Shorts: | 31.8 | 44.2 | 3.7 |
| – Net Position: | -26,745 | 24,251 | 2,494 |
| – Gross Longs: | 44,803 | 123,565 | 10,878 |
| – Gross Shorts: | 71,548 | 99,314 | 8,384 |
| – Long to Short Ratio: | 0.6 to 1 | 1.2 to 1 | 1.3 to 1 |
| NET POSITION TREND: | |||
| – Strength Index Score (3 Year Range Pct): | 0.0 | 100.0 | 34.1 |
| – Strength Index Reading (3 Year Range): | Bearish-Extreme | Bullish-Extreme | Bearish |
| NET POSITION MOVEMENT INDEX: | |||
| – 6-Week Change in Strength Index: | -12.4 | 11.3 | 10.6 |
SOYBEANS Futures:
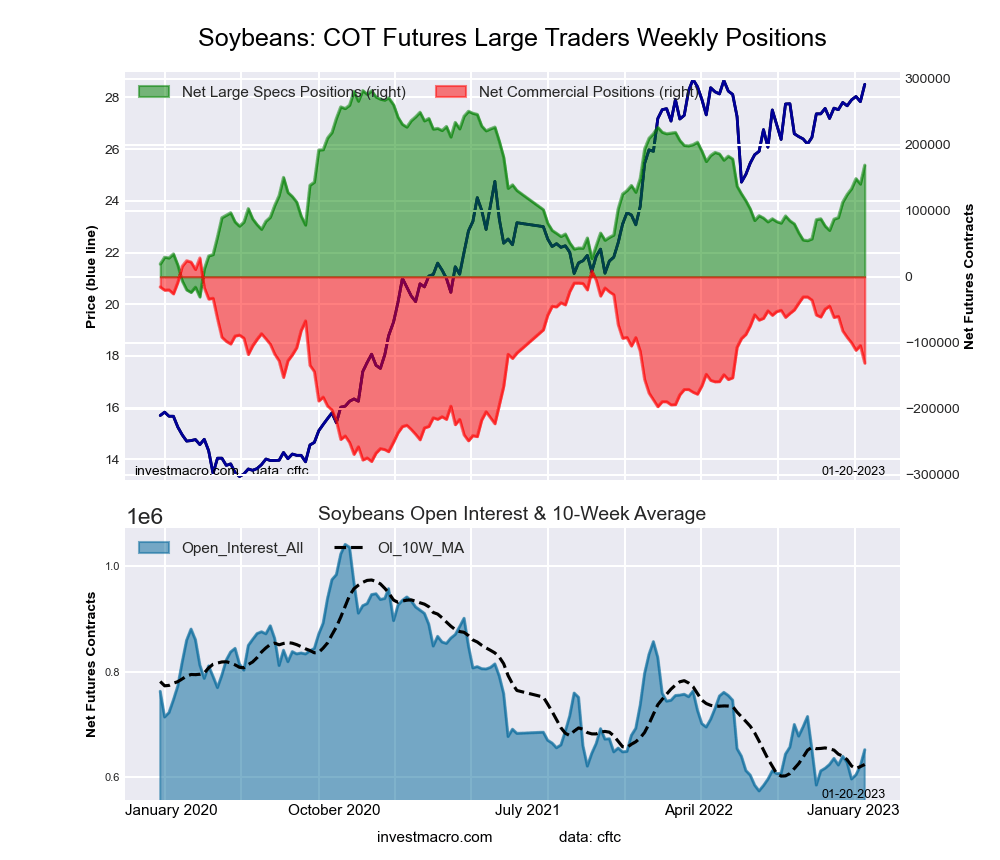 The SOYBEANS large speculator standing this week resulted in a net position of 169,065 contracts in the data reported through Tuesday. This was a weekly advance of 28,737 contracts from the previous week which had a total of 140,328 net contracts.
This week’s current strength score (the trader positioning range over the past three years, measured from 0 to 100) shows the speculators are currently Bullish with a score of 63.9 percent. The commercials are Bearish with a score of 48.3 percent and the small traders (not shown in chart) are Bearish-Extreme with a score of 6.3 percent.
| SOYBEANS Futures Statistics | SPECULATORS | COMMERCIALS | SMALL TRADERS |
| – Percent of Open Interest Longs: | 33.3 | 46.4 | 6.7 |
| – Percent of Open Interest Shorts: | 7.3 | 66.4 | 12.5 |
| – Net Position: | 169,065 | -130,790 | -38,275 |
| – Gross Longs: | 216,831 | 301,985 | 43,462 |
| – Gross Shorts: | 47,766 | 432,775 | 81,737 |
| – Long to Short Ratio: | 4.5 to 1 | 0.7 to 1 | 0.5 to 1 |
| NET POSITION TREND: | |||
| – Strength Index Score (3 Year Range Pct): | 63.9 | 48.3 | 6.3 |
| – Strength Index Reading (3 Year Range): | Bullish | Bearish | Bearish-Extreme |
| NET POSITION MOVEMENT INDEX: | |||
| – 6-Week Change in Strength Index: | 25.4 | -23.0 | -14.4 |
SOYBEAN OIL Futures:
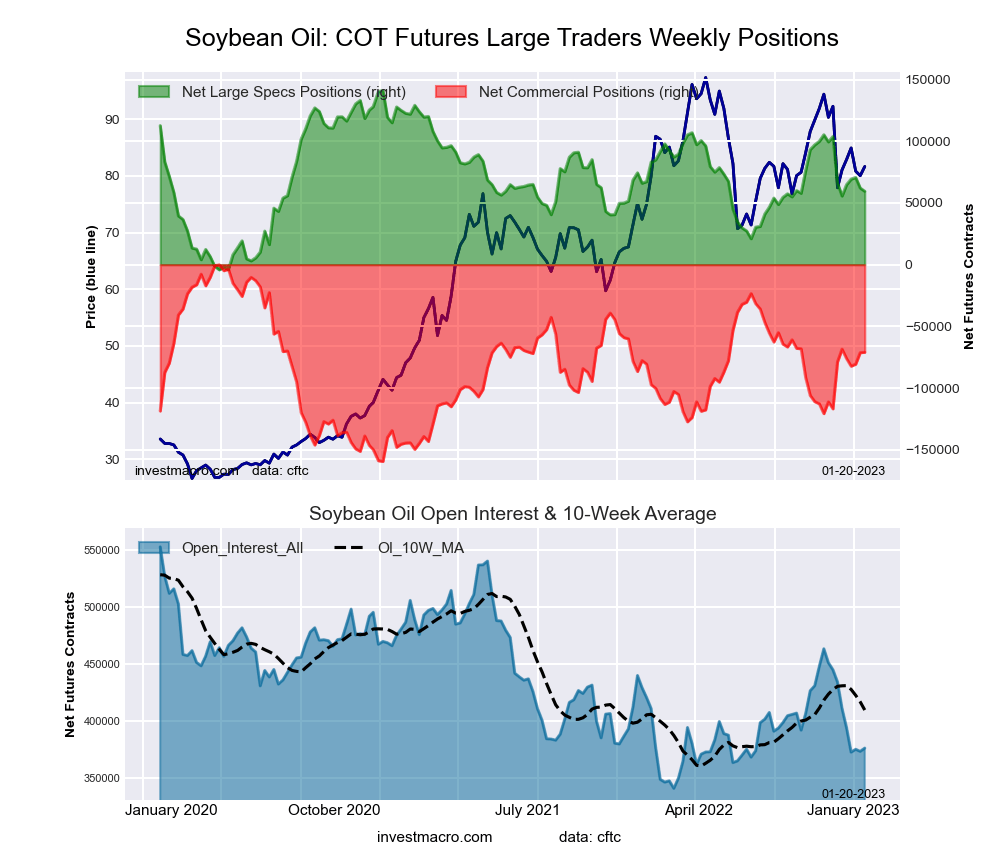 The SOYBEAN OIL large speculator standing this week resulted in a net position of 59,495 contracts in the data reported through Tuesday. This was a weekly decrease of -2,604 contracts from the previous week which had a total of 62,099 net contracts.
This week’s current strength score (the trader positioning range over the past three years, measured from 0 to 100) shows the speculators are currently Bearish with a score of 43.8 percent. The commercials are Bullish with a score of 55.5 percent and the small traders (not shown in chart) are Bullish with a score of 56.7 percent.
| SOYBEAN OIL Futures Statistics | SPECULATORS | COMMERCIALS | SMALL TRADERS |
| – Percent of Open Interest Longs: | 23.8 | 49.9 | 9.4 |
| – Percent of Open Interest Shorts: | 8.0 | 68.8 | 6.3 |
| – Net Position: | 59,495 | -71,077 | 11,582 |
| – Gross Longs: | 89,394 | 187,762 | 35,188 |
| – Gross Shorts: | 29,899 | 258,839 | 23,606 |
| – Long to Short Ratio: | 3.0 to 1 | 0.7 to 1 | 1.5 to 1 |
| NET POSITION TREND: | |||
| – Strength Index Score (3 Year Range Pct): | 43.8 | 55.5 | 56.7 |
| – Strength Index Reading (3 Year Range): | Bearish | Bullish | Bullish |
| NET POSITION MOVEMENT INDEX: | |||
| – 6-Week Change in Strength Index: | -4.7 | 4.9 | -3.6 |
SOYBEAN MEAL Futures:
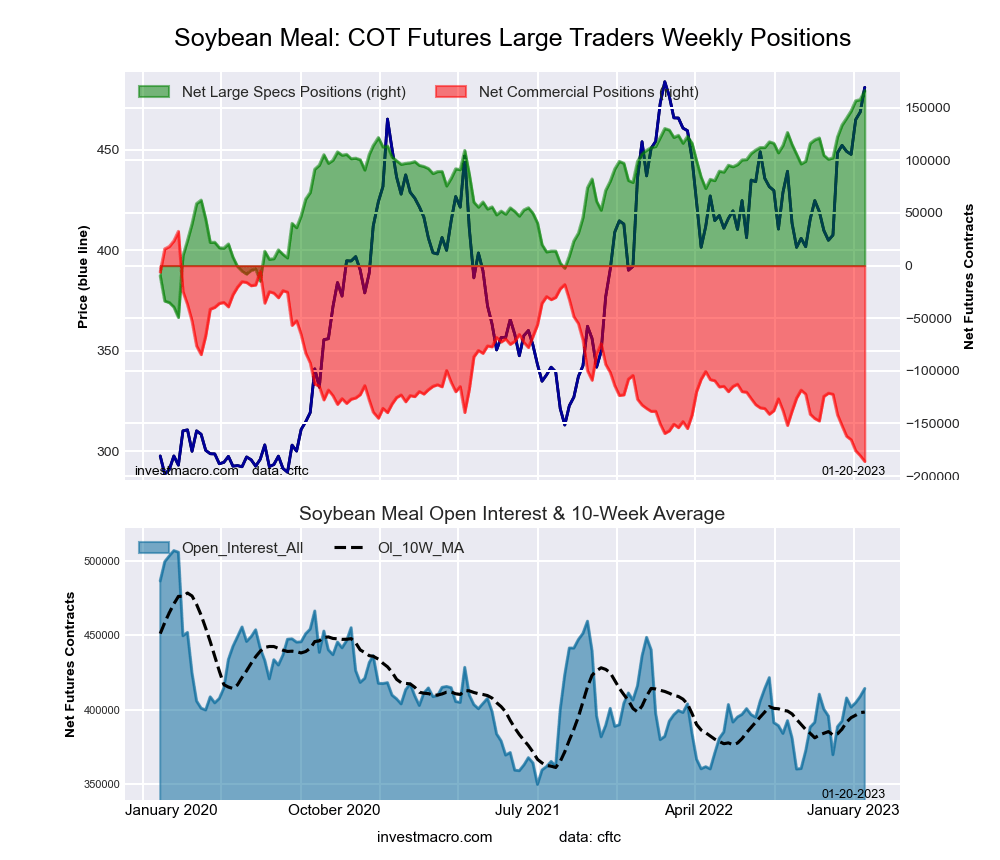 The SOYBEAN MEAL large speculator standing this week resulted in a net position of 166,350 contracts in the data reported through Tuesday. This was a weekly advance of 8,640 contracts from the previous week which had a total of 157,710 net contracts.
This week’s current strength score (the trader positioning range over the past three years, measured from 0 to 100) shows the speculators are currently Bullish-Extreme with a score of 100.0 percent. The commercials are Bearish-Extreme with a score of 0.0 percent and the small traders (not shown in chart) are Bearish with a score of 35.5 percent.
| SOYBEAN MEAL Futures Statistics | SPECULATORS | COMMERCIALS | SMALL TRADERS |
| – Percent of Open Interest Longs: | 43.7 | 30.1 | 11.5 |
| – Percent of Open Interest Shorts: | 3.6 | 75.0 | 6.7 |
| – Net Position: | 166,350 | -186,133 | 19,783 |
| – Gross Longs: | 181,071 | 124,549 | 47,680 |
| – Gross Shorts: | 14,721 | 310,682 | 27,897 |
| – Long to Short Ratio: | 12.3 to 1 | 0.4 to 1 | 1.7 to 1 |
| NET POSITION TREND: | |||
| – Strength Index Score (3 Year Range Pct): | 100.0 | 0.0 | 35.5 |
| – Strength Index Reading (3 Year Range): | Bullish-Extreme | Bearish-Extreme | Bearish |
| NET POSITION MOVEMENT INDEX: | |||
| – 6-Week Change in Strength Index: | 20.5 | -20.3 | 1.0 |
LIVE CATTLE Futures:
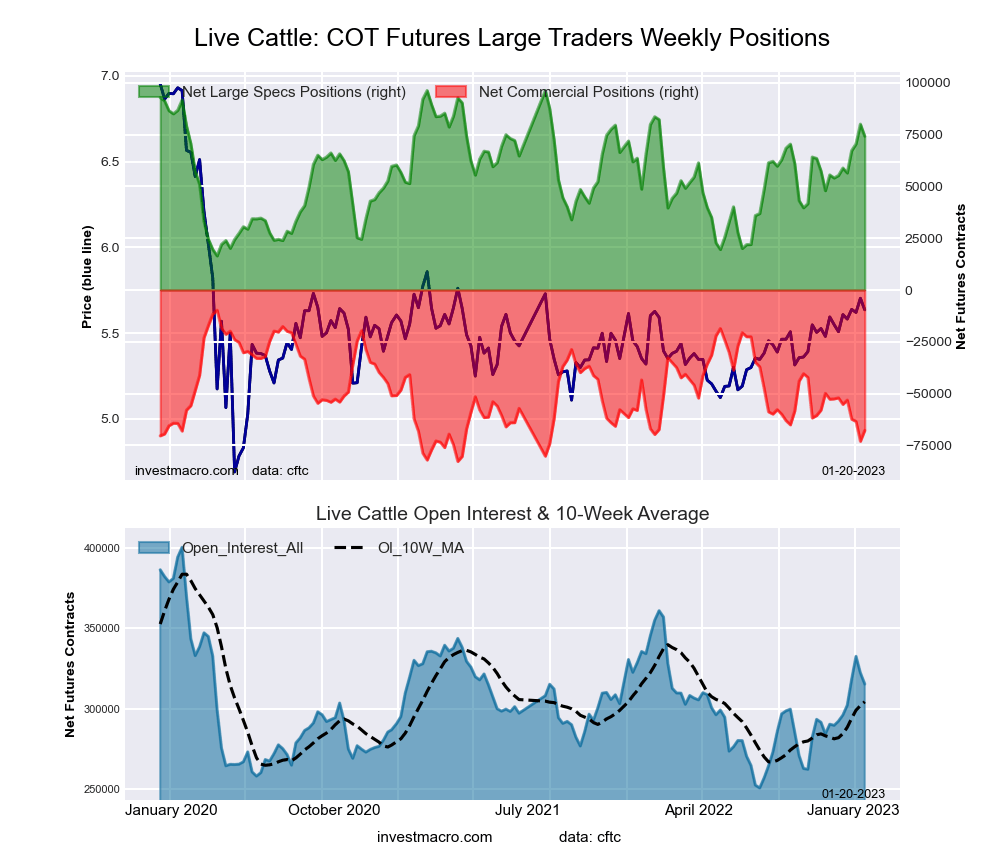 The LIVE CATTLE large speculator standing this week resulted in a net position of 74,143 contracts in the data reported through Tuesday. This was a weekly fall of -5,851 contracts from the previous week which had a total of 79,994 net contracts.
This week’s current strength score (the trader positioning range over the past three years, measured from 0 to 100) shows the speculators are currently Bullish with a score of 72.3 percent. The commercials are Bearish with a score of 20.5 percent and the small traders (not shown in chart) are Bullish with a score of 64.0 percent.
| LIVE CATTLE Futures Statistics | SPECULATORS | COMMERCIALS | SMALL TRADERS |
| – Percent of Open Interest Longs: | 40.2 | 30.1 | 10.4 |
| – Percent of Open Interest Shorts: | 16.7 | 51.6 | 12.5 |
| – Net Position: | 74,143 | -67,709 | -6,434 |
| – Gross Longs: | 126,737 | 95,035 | 32,866 |
| – Gross Shorts: | 52,594 | 162,744 | 39,300 |
| – Long to Short Ratio: | 2.4 to 1 | 0.6 to 1 | 0.8 to 1 |
| NET POSITION TREND: | |||
| – Strength Index Score (3 Year Range Pct): | 72.3 | 20.5 | 64.0 |
| – Strength Index Reading (3 Year Range): | Bullish | Bearish | Bullish |
| NET POSITION MOVEMENT INDEX: | |||
| – 6-Week Change in Strength Index: | 23.7 | -21.5 | -13.8 |
LEAN HOGS Futures:
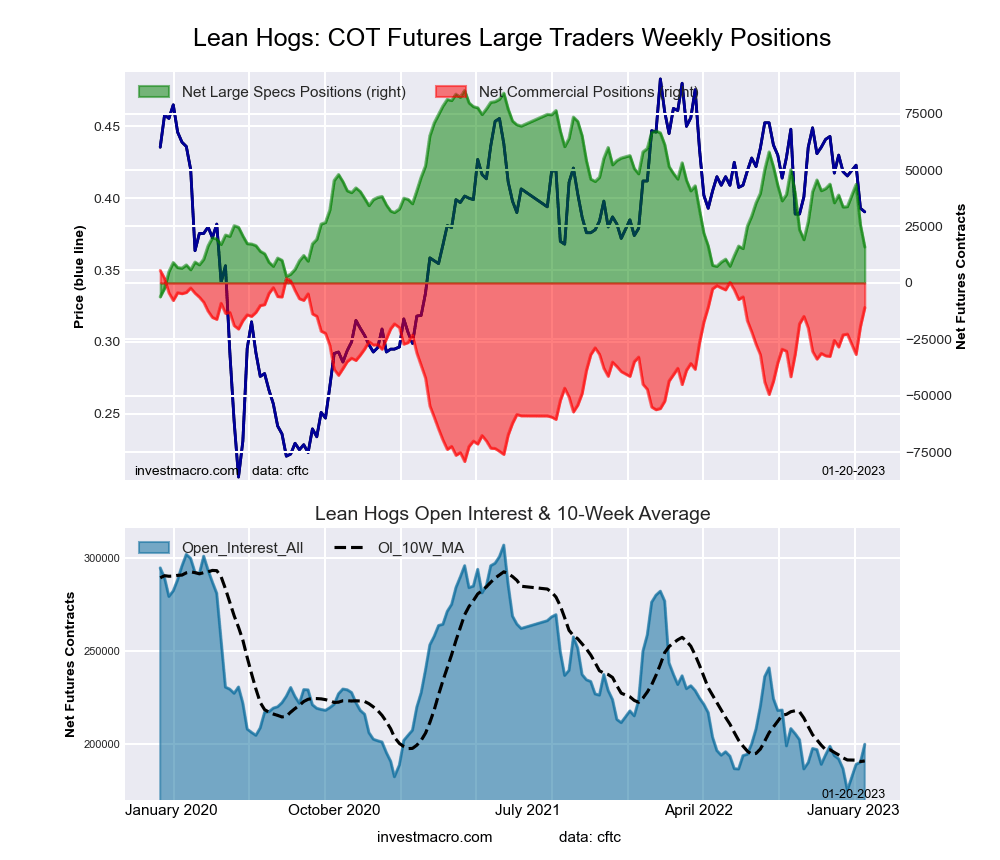 The LEAN HOGS large speculator standing this week resulted in a net position of 15,907 contracts in the data reported through Tuesday. This was a weekly lowering of -9,862 contracts from the previous week which had a total of 25,769 net contracts.
This week’s current strength score (the trader positioning range over the past three years, measured from 0 to 100) shows the speculators are currently Bearish-Extreme with a score of 15.8 percent. The commercials are Bullish-Extreme with a score of 84.2 percent and the small traders (not shown in chart) are Bullish-Extreme with a score of 80.7 percent.
| LEAN HOGS Futures Statistics | SPECULATORS | COMMERCIALS | SMALL TRADERS |
| – Percent of Open Interest Longs: | 31.6 | 37.5 | 10.6 |
| – Percent of Open Interest Shorts: | 23.6 | 43.0 | 13.1 |
| – Net Position: | 15,907 | -10,939 | -4,968 |
| – Gross Longs: | 63,073 | 74,842 | 21,157 |
| – Gross Shorts: | 47,166 | 85,781 | 26,125 |
| – Long to Short Ratio: | 1.3 to 1 | 0.9 to 1 | 0.8 to 1 |
| NET POSITION TREND: | |||
| – Strength Index Score (3 Year Range Pct): | 15.8 | 84.2 | 80.7 |
| – Strength Index Reading (3 Year Range): | Bearish-Extreme | Bullish-Extreme | Bullish-Extreme |
| NET POSITION MOVEMENT INDEX: | |||
| – 6-Week Change in Strength Index: | -27.8 | 21.6 | 32.8 |
COTTON Futures:
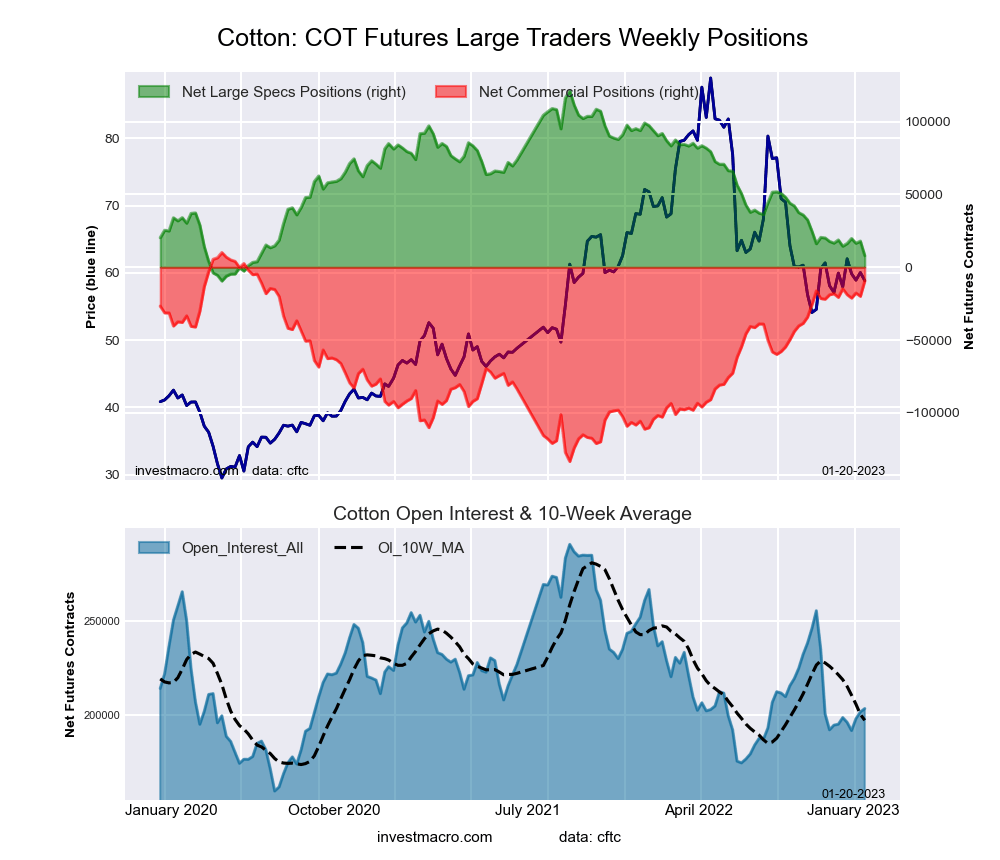 The COTTON large speculator standing this week resulted in a net position of 7,953 contracts in the data reported through Tuesday. This was a weekly decline of -9,991 contracts from the previous week which had a total of 17,944 net contracts.
This week’s current strength score (the trader positioning range over the past three years, measured from 0 to 100) shows the speculators are currently Bearish-Extreme with a score of 13.3 percent. The commercials are Bullish-Extreme with a score of 86.4 percent and the small traders (not shown in chart) are Bearish-Extreme with a score of 19.5 percent.
| COTTON Futures Statistics | SPECULATORS | COMMERCIALS | SMALL TRADERS |
| – Percent of Open Interest Longs: | 27.9 | 50.7 | 6.3 |
| – Percent of Open Interest Shorts: | 23.9 | 55.4 | 5.6 |
| – Net Position: | 7,953 | -9,382 | 1,429 |
| – Gross Longs: | 56,634 | 103,146 | 12,734 |
| – Gross Shorts: | 48,681 | 112,528 | 11,305 |
| – Long to Short Ratio: | 1.2 to 1 | 0.9 to 1 | 1.1 to 1 |
| NET POSITION TREND: | |||
| – Strength Index Score (3 Year Range Pct): | 13.3 | 86.4 | 19.5 |
| – Strength Index Reading (3 Year Range): | Bearish-Extreme | Bullish-Extreme | Bearish-Extreme |
| NET POSITION MOVEMENT INDEX: | |||
| – 6-Week Change in Strength Index: | -8.2 | 7.9 | -3.3 |
COCOA Futures:
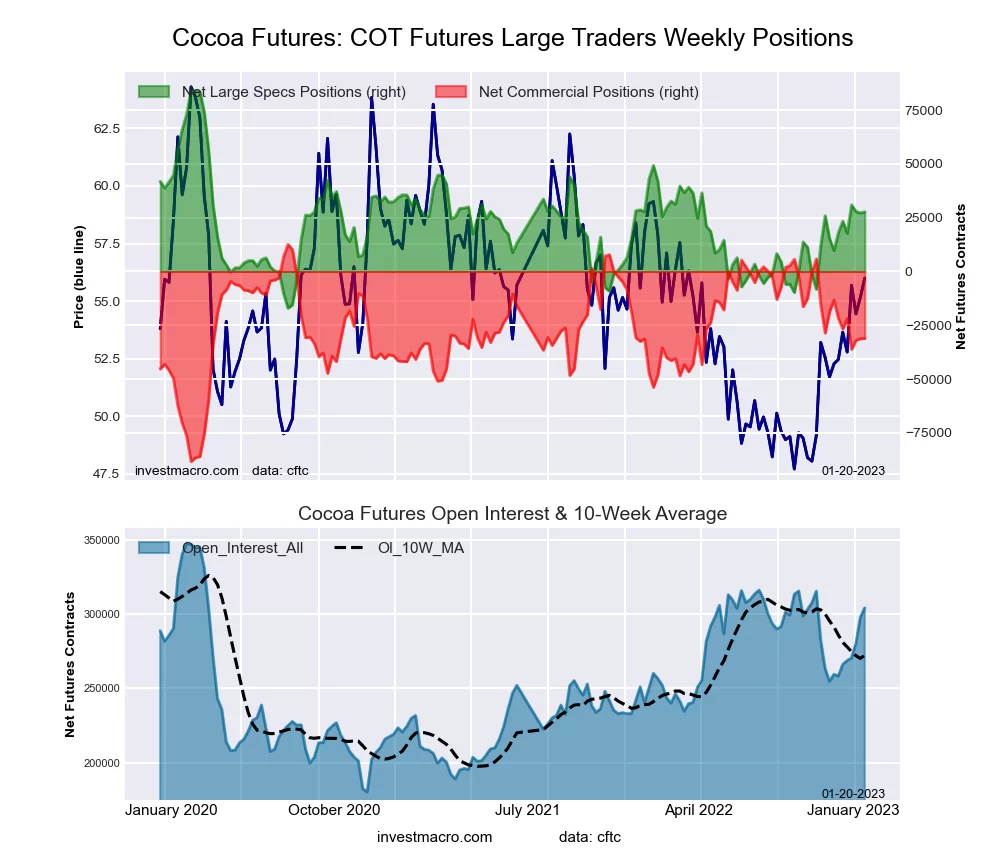 The COCOA large speculator standing this week resulted in a net position of 27,698 contracts in the data reported through Tuesday. This was a weekly lift of 477 contracts from the previous week which had a total of 27,221 net contracts.
This week’s current strength score (the trader positioning range over the past three years, measured from 0 to 100) shows the speculators are currently Bearish with a score of 44.2 percent. The commercials are Bullish with a score of 56.6 percent and the small traders (not shown in chart) are Bearish with a score of 31.1 percent.
| COCOA Futures Statistics | SPECULATORS | COMMERCIALS | SMALL TRADERS |
| – Percent of Open Interest Longs: | 31.9 | 45.5 | 4.3 |
| – Percent of Open Interest Shorts: | 22.8 | 55.8 | 3.1 |
| – Net Position: | 27,698 | -31,155 | 3,457 |
| – Gross Longs: | 97,065 | 138,394 | 13,026 |
| – Gross Shorts: | 69,367 | 169,549 | 9,569 |
| – Long to Short Ratio: | 1.4 to 1 | 0.8 to 1 | 1.4 to 1 |
| NET POSITION TREND: | |||
| – Strength Index Score (3 Year Range Pct): | 44.2 | 56.6 | 31.1 |
| – Strength Index Reading (3 Year Range): | Bearish | Bullish | Bearish |
| NET POSITION MOVEMENT INDEX: | |||
| – 6-Week Change in Strength Index: | 9.6 | -9.4 | -2.9 |
WHEAT Futures:
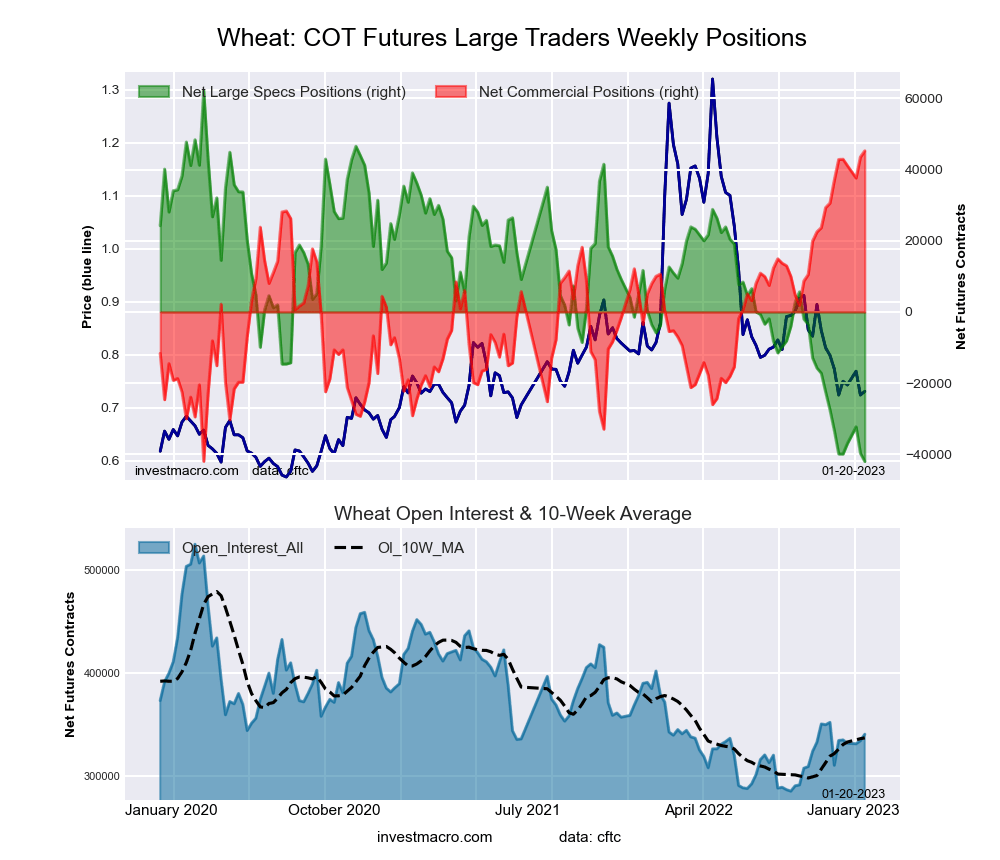 The WHEAT large speculator standing this week resulted in a net position of -42,014 contracts in the data reported through Tuesday. This was a weekly lowering of -2,298 contracts from the previous week which had a total of -39,716 net contracts.
This week’s current strength score (the trader positioning range over the past three years, measured from 0 to 100) shows the speculators are currently Bearish-Extreme with a score of 0.0 percent. The commercials are Bullish-Extreme with a score of 100.0 percent and the small traders (not shown in chart) are Bullish-Extreme with a score of 93.6 percent.
| WHEAT Futures Statistics | SPECULATORS | COMMERCIALS | SMALL TRADERS |
| – Percent of Open Interest Longs: | 25.4 | 41.6 | 9.7 |
| – Percent of Open Interest Shorts: | 37.7 | 28.4 | 10.6 |
| – Net Position: | -42,014 | 45,261 | -3,247 |
| – Gross Longs: | 86,569 | 141,956 | 32,942 |
| – Gross Shorts: | 128,583 | 96,695 | 36,189 |
| – Long to Short Ratio: | 0.7 to 1 | 1.5 to 1 | 0.9 to 1 |
| NET POSITION TREND: | |||
| – Strength Index Score (3 Year Range Pct): | 0.0 | 100.0 | 93.6 |
| – Strength Index Reading (3 Year Range): | Bearish-Extreme | Bullish-Extreme | Bullish-Extreme |
| NET POSITION MOVEMENT INDEX: | |||
| – 6-Week Change in Strength Index: | -2.0 | 2.8 | -1.7 |
Article By InvestMacro – Receive our weekly COT Newsletter
*COT Report: The COT data, released weekly to the public each Friday, is updated through the most recent Tuesday (data is 3 days old) and shows a quick view of how large speculators or non-commercials (for-profit traders) were positioned in the futures markets.
The CFTC categorizes trader positions according to commercial hedgers (traders who use futures contracts for hedging as part of the business), non-commercials (large traders who speculate to realize trading profits) and nonreportable traders (usually small traders/speculators) as well as their open interest (contracts open in the market at time of reporting). See CFTC criteria here.


