By InvestMacro
Here are the latest charts and statistics for the Commitment of Traders (COT) data published by the Commodities Futures Trading Commission (CFTC).
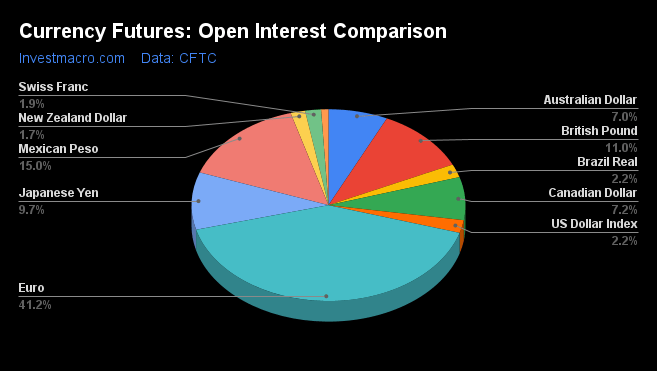
The latest COT data is updated through Tuesday January 17th and shows a quick view of how large market participants (for-profit speculators and commercial traders) were positioned in the futures markets. All currency positions are in direct relation to the US dollar where, for example, a bet for the euro is a bet that the euro will rise versus the dollar while a bet against the euro will be a bet that the euro will decline versus the dollar.
Weekly Speculator Changes led by Japanese Yen & British Pound
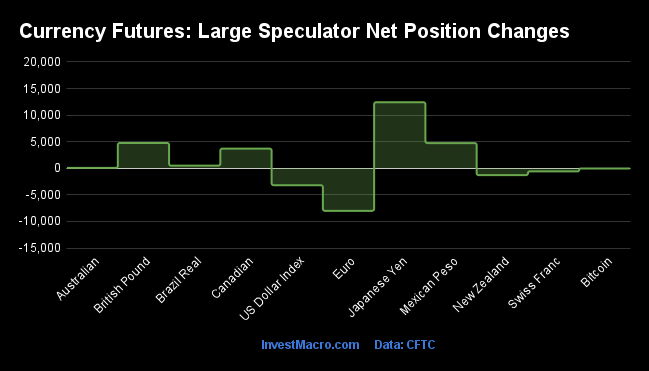
The COT currency market speculator bets were higher this week as six out of the eleven currency markets we cover had higher positioning while the other five markets had lower speculator contracts.
Leading the gains for the currency markets was the Japanese Yen (12,416 contracts) with the British Pound (4,759 contracts), Mexican Peso (4,742 contracts), Canadian Dollar (3,696 contracts) and the Australian Dollar (70 contracts) also showing positive weeks.
The currencies seeing declines in speculator bets on the week were the EuroFX (-7,998 contracts) with the US Dollar Index (-3,182 contracts), the New Zealand Dollar (-1,292 contracts), Bitcoin (-33 contracts) and the Swiss Franc (-571 contracts) also registering lower bets on the week.
Highlighting the COT currencies data is the recent declines in the US Dollar Index bullish speculator positioning. The large speculator bets for the US Dollar Index fell this week for a second straight week and for the third time out of the past five weeks. The speculator’s bullish position has almost fallen by half over the past five weeks going from a total of +25,778 contracts on December 13th to a total of +13,358 contracts this week. These declines have now pushed the Dollar Index to the least bullish level for speculators since July 20th of 2021, a span of 78 weeks.
Since riding a strong bullish wave to a 274-week high on June 14th of 2022 (at +45,010 contracts), the US Dollar Index speculator positioning has been in a slow but steady downtrend that continued this week.
The US Dollar Index futures price has also been in a downtrend after ascending to a multi-year peak in September at the 114.74 level. That marked the best price level for the Dollar Index since 2002 and was the start of the recent slide that has brought the Dollar Index to its current level of 101.78 (for an approximate loss of 11 percent). Since September, most of the major currencies have gained against the Dollar and have made some moderate recoveries after falling to multi-decade lows.
| Jan-17-2023 | OI | OI-Index | Spec-Net | Spec-Index | Com-Net | COM-Index | Smalls-Net | Smalls-Index |
|---|
| USD Index | 39,388 | 44 | 13,358 | 47 | -15,570 | 51 | 2,212 | 41 |
| EUR | 753,915 | 92 | 126,984 | 74 | -179,074 | 25 | 52,090 | 62 |
| GBP | 201,956 | 38 | -24,697 | 48 | 31,436 | 55 | -6,739 | 45 |
| JPY | 176,862 | 36 | -22,961 | 55 | 18,084 | 44 | 4,877 | 63 |
| CHF | 34,300 | 16 | -7,941 | 34 | 11,357 | 64 | -3,416 | 46 |
| CAD | 132,346 | 18 | -27,259 | 9 | 27,488 | 92 | -229 | 30 |
| AUD | 128,213 | 28 | -33,620 | 54 | 25,936 | 38 | 7,684 | 71 |
| NZD | 31,579 | 10 | 6,058 | 70 | -6,686 | 31 | 628 | 59 |
| MXN | 274,227 | 84 | -48,639 | 7 | 42,299 | 90 | 6,340 | 95 |
| RUB | 20,930 | 4 | 7,543 | 31 | -7,150 | 69 | -393 | 24 |
| BRL | 40,800 | 28 | 22,193 | 70 | -23,748 | 30 | 1,555 | 79 |
| Bitcoin | 15,885 | 83 | -627 | 66 | 337 | 0 | 290 | 20 |
Strength Scores led by EuroFX & New Zealand Dollar

COT Strength Scores (a normalized measure of Speculator positions over a 3-Year range, from 0 to 100 where above 80 is Extreme-Bullish and below 20 is Extreme-Bearish) showed that the EuroFX (74 percent) and the New Zealand Dollar (70 percent) lead the currency markets this week. The Brazilian Real (70 percent), Bitcoin (66 percent) and the Japanese Yen (55 percent) come in as the next highest in the weekly strength scores.
On the downside, the Mexican Peso (7 percent) and the Canadian Dollar (9 percent) come in at the lowest strength levels currently and are in Extreme-Bearish territory (below 20 percent). The next lowest strength scores are the Swiss Franc (34 percent) and the US Dollar Index (47 percent).
Strength Statistics:
US Dollar Index (47.2 percent) vs US Dollar Index previous week (52.5 percent)
EuroFX (74.0 percent) vs EuroFX previous week (76.4 percent)
British Pound Sterling (47.8 percent) vs British Pound Sterling previous week (43.7 percent)
Japanese Yen (54.7 percent) vs Japanese Yen previous week (47.1 percent)
Swiss Franc (33.6 percent) vs Swiss Franc previous week (35.1 percent)
Canadian Dollar (9.3 percent) vs Canadian Dollar previous week (4.9 percent)
Australian Dollar (53.7 percent) vs Australian Dollar previous week (53.6 percent)
New Zealand Dollar (70.4 percent) vs New Zealand Dollar previous week (73.9 percent)
Mexican Peso (6.6 percent) vs Mexican Peso previous week (4.6 percent)
Brazilian Real (69.7 percent) vs Brazilian Real previous week (69.2 percent)
Bitcoin (66.0 percent) vs Bitcoin previous week (66.6 percent)
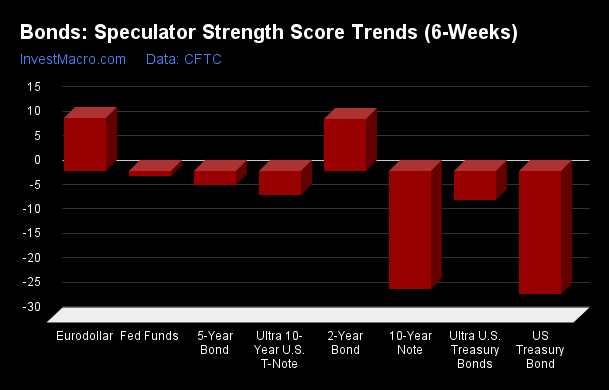
New Zealand Dollar & Japanese Yen top the 6-Week Strength Trends
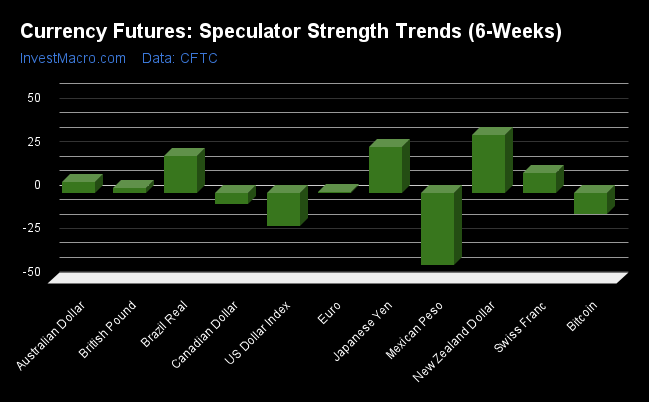
COT Strength Score Trends (or move index, calculates the 6-week changes in strength scores) showed that the New Zealand Dollar (34 percent) and the Japanese Yen (27 percent) lead the past six weeks trends for the currencies. The Brazilian Real (21 percent), the Swiss Franc (11 percent) and the Australian Dollar (6 percent) are the next highest positive movers in the latest trends data.
The Mexican Peso (-41 percent) leads the downside trend scores currently with the US Dollar Index (-19 percent), Bitcoin (-12 percent) and the Canadian Dollar (-6 percent) following next with lower trend scores.
Strength Trend Statistics:
US Dollar Index (-19.2 percent) vs US Dollar Index previous week (-13.9 percent)
EuroFX (0.6 percent) vs EuroFX previous week (3.9 percent)
British Pound Sterling (3.0 percent) vs British Pound Sterling previous week (6.1 percent)
Japanese Yen (26.5 percent) vs Japanese Yen previous week (19.7 percent)
Swiss Franc (11.3 percent) vs Swiss Franc previous week (18.2 percent)
Canadian Dollar (-6.2 percent) vs Canadian Dollar previous week (-17.7 percent)
Australian Dollar (6.4 percent) vs Australian Dollar previous week (10.1 percent)
New Zealand Dollar (33.6 percent) vs New Zealand Dollar previous week (33.2 percent)
Mexican Peso (-41.2 percent) vs Mexican Peso previous week (-50.9 percent)
Brazilian Real (21.4 percent) vs Brazilian Real previous week (15.1 percent)
Bitcoin (-12.1 percent) vs Bitcoin previous week (-16.0 percent)
Individual COT Forex Markets:
US Dollar Index Futures:
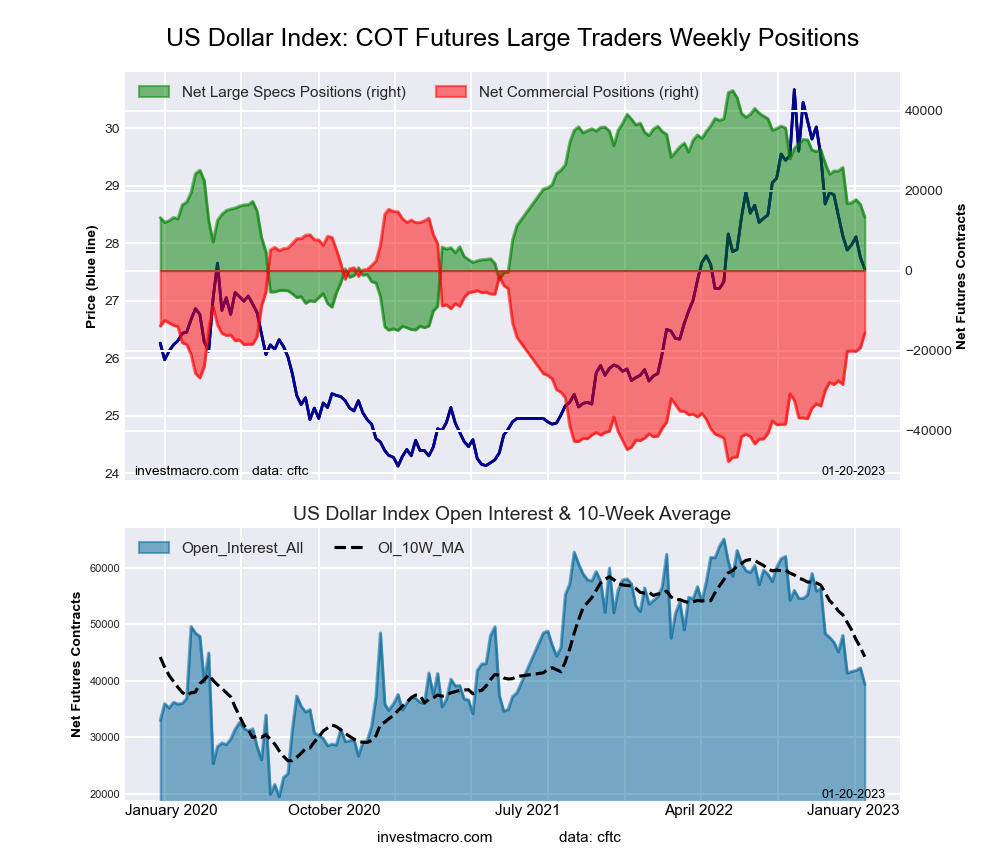 The US Dollar Index large speculator standing this week reached a net position of 13,358 contracts in the data reported through Tuesday. This was a weekly decline of -3,182 contracts from the previous week which had a total of 16,540 net contracts.
This week’s current strength score (the trader positioning range over the past three years, measured from 0 to 100) shows the speculators are currently Bearish with a score of 47.2 percent. The commercials are Bullish with a score of 51.0 percent and the small traders (not shown in chart) are Bearish with a score of 40.7 percent.
| US DOLLAR INDEX Statistics | SPECULATORS | COMMERCIALS | SMALL TRADERS |
| – Percent of Open Interest Longs: | 80.5 | 2.6 | 13.4 |
| – Percent of Open Interest Shorts: | 46.6 | 42.1 | 7.8 |
| – Net Position: | 13,358 | -15,570 | 2,212 |
| – Gross Longs: | 31,694 | 1,031 | 5,292 |
| – Gross Shorts: | 18,336 | 16,601 | 3,080 |
| – Long to Short Ratio: | 1.7 to 1 | 0.1 to 1 | 1.7 to 1 |
| NET POSITION TREND: | | | |
| – Strength Index Score (3 Year Range Pct): | 47.2 | 51.0 | 40.7 |
| – Strength Index Reading (3 Year Range): | Bearish | Bullish | Bearish |
| NET POSITION MOVEMENT INDEX: | | | |
| – 6-Week Change in Strength Index: | -19.2 | 19.0 | -4.8 |
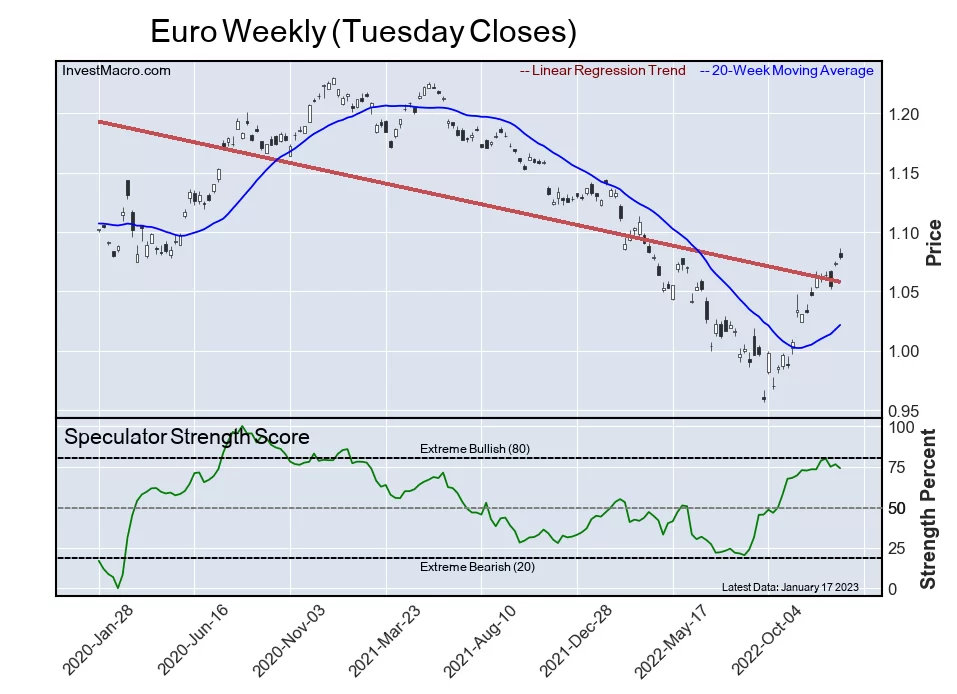
Euro Currency Futures:
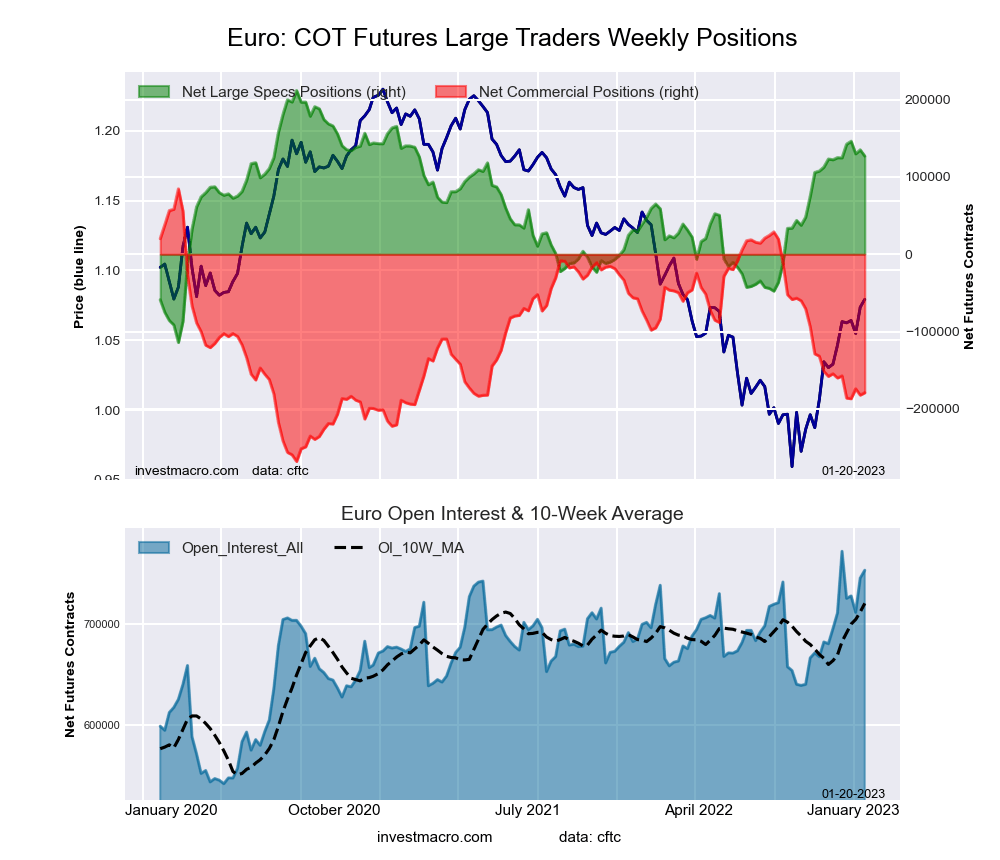 The Euro Currency large speculator standing this week reached a net position of 126,984 contracts in the data reported through Tuesday. This was a weekly reduction of -7,998 contracts from the previous week which had a total of 134,982 net contracts.
This week’s current strength score (the trader positioning range over the past three years, measured from 0 to 100) shows the speculators are currently Bullish with a score of 74.0 percent. The commercials are Bearish with a score of 25.2 percent and the small traders (not shown in chart) are Bullish with a score of 62.1 percent.
| EURO Currency Statistics | SPECULATORS | COMMERCIALS | SMALL TRADERS |
| – Percent of Open Interest Longs: | 30.3 | 55.2 | 12.5 |
| – Percent of Open Interest Shorts: | 13.4 | 79.0 | 5.6 |
| – Net Position: | 126,984 | -179,074 | 52,090 |
| – Gross Longs: | 228,279 | 416,510 | 94,476 |
| – Gross Shorts: | 101,295 | 595,584 | 42,386 |
| – Long to Short Ratio: | 2.3 to 1 | 0.7 to 1 | 2.2 to 1 |
| NET POSITION TREND: | | | |
| – Strength Index Score (3 Year Range Pct): | 74.0 | 25.2 | 62.1 |
| – Strength Index Reading (3 Year Range): | Bullish | Bearish | Bullish |
| NET POSITION MOVEMENT INDEX: | | | |
| – 6-Week Change in Strength Index: | 0.6 | -5.4 | 27.1 |
British Pound Sterling Futures:
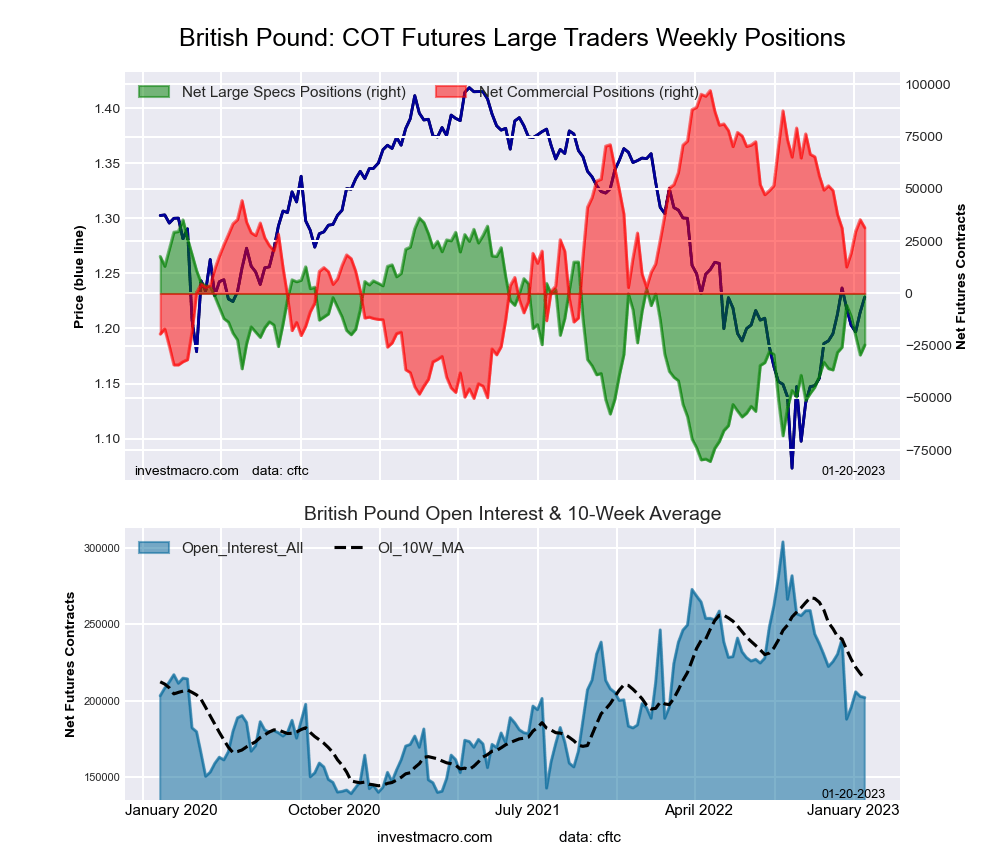 The British Pound Sterling large speculator standing this week reached a net position of -24,697 contracts in the data reported through Tuesday. This was a weekly advance of 4,759 contracts from the previous week which had a total of -29,456 net contracts.
This week’s current strength score (the trader positioning range over the past three years, measured from 0 to 100) shows the speculators are currently Bearish with a score of 47.8 percent. The commercials are Bullish with a score of 55.4 percent and the small traders (not shown in chart) are Bearish with a score of 44.8 percent.
| BRITISH POUND Statistics | SPECULATORS | COMMERCIALS | SMALL TRADERS |
| – Percent of Open Interest Longs: | 20.5 | 64.7 | 11.9 |
| – Percent of Open Interest Shorts: | 32.8 | 49.1 | 15.2 |
| – Net Position: | -24,697 | 31,436 | -6,739 |
| – Gross Longs: | 41,469 | 130,575 | 24,051 |
| – Gross Shorts: | 66,166 | 99,139 | 30,790 |
| – Long to Short Ratio: | 0.6 to 1 | 1.3 to 1 | 0.8 to 1 |
| NET POSITION TREND: | | | |
| – Strength Index Score (3 Year Range Pct): | 47.8 | 55.4 | 44.8 |
| – Strength Index Reading (3 Year Range): | Bearish | Bullish | Bearish |
| NET POSITION MOVEMENT INDEX: | | | |
| – 6-Week Change in Strength Index: | 3.0 | -4.3 | 5.6 |
Japanese Yen Futures:
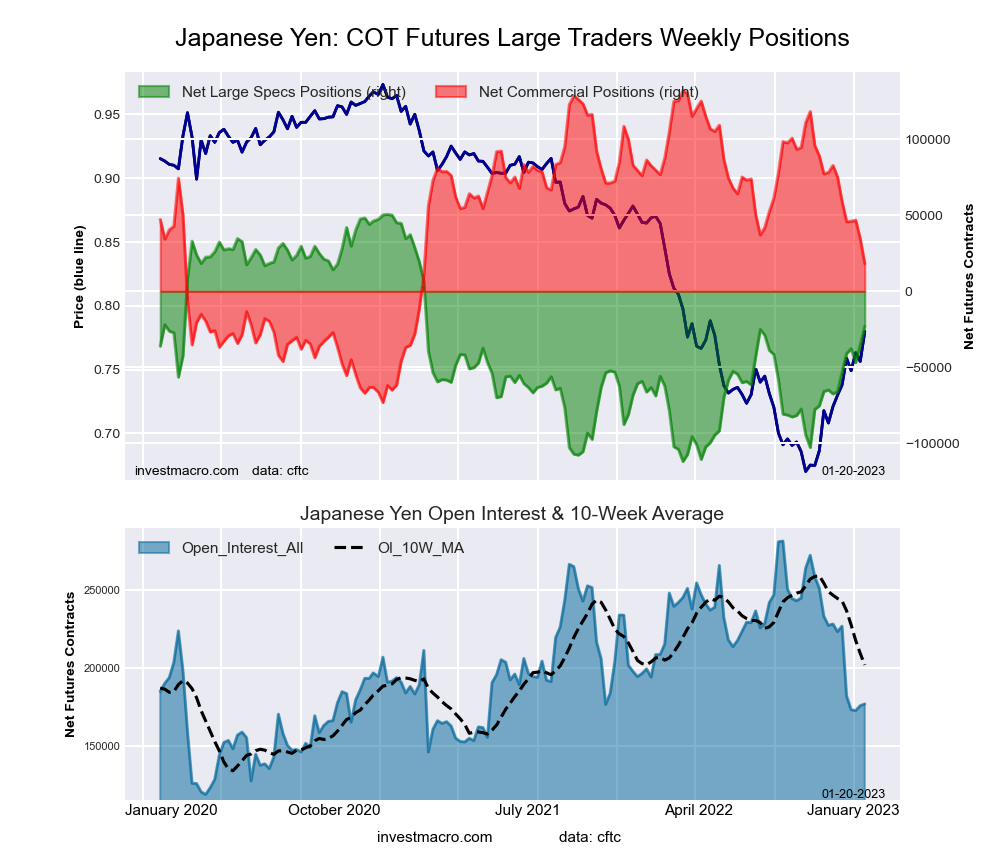 The Japanese Yen large speculator standing this week reached a net position of -22,961 contracts in the data reported through Tuesday. This was a weekly lift of 12,416 contracts from the previous week which had a total of -35,377 net contracts.
This week’s current strength score (the trader positioning range over the past three years, measured from 0 to 100) shows the speculators are currently Bullish with a score of 54.7 percent. The commercials are Bearish with a score of 44.5 percent and the small traders (not shown in chart) are Bullish with a score of 63.3 percent.
| JAPANESE YEN Statistics | SPECULATORS | COMMERCIALS | SMALL TRADERS |
| – Percent of Open Interest Longs: | 16.7 | 65.0 | 17.4 |
| – Percent of Open Interest Shorts: | 29.6 | 54.7 | 14.6 |
| – Net Position: | -22,961 | 18,084 | 4,877 |
| – Gross Longs: | 29,458 | 114,907 | 30,761 |
| – Gross Shorts: | 52,419 | 96,823 | 25,884 |
| – Long to Short Ratio: | 0.6 to 1 | 1.2 to 1 | 1.2 to 1 |
| NET POSITION TREND: | | | |
| – Strength Index Score (3 Year Range Pct): | 54.7 | 44.5 | 63.3 |
| – Strength Index Reading (3 Year Range): | Bullish | Bearish | Bullish |
| NET POSITION MOVEMENT INDEX: | | | |
| – 6-Week Change in Strength Index: | 26.5 | -27.9 | 28.6 |
Swiss Franc Futures:
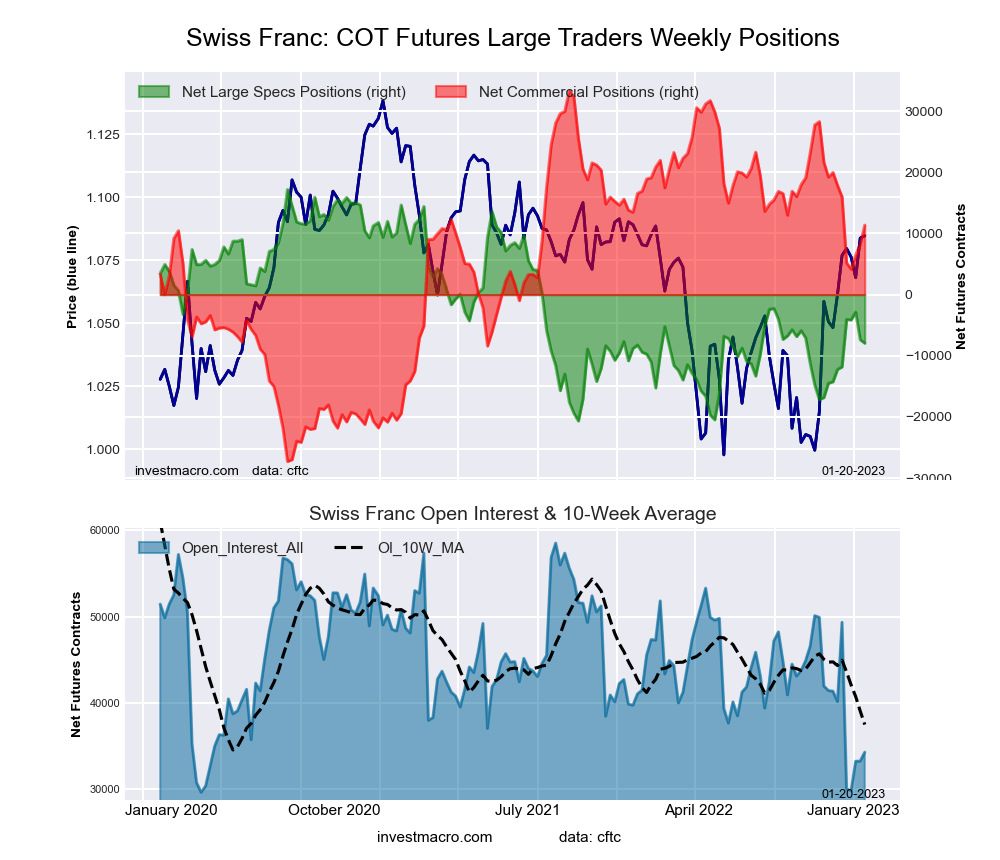 The Swiss Franc large speculator standing this week reached a net position of -7,941 contracts in the data reported through Tuesday. This was a weekly lowering of -571 contracts from the previous week which had a total of -7,370 net contracts.
This week’s current strength score (the trader positioning range over the past three years, measured from 0 to 100) shows the speculators are currently Bearish with a score of 33.6 percent. The commercials are Bullish with a score of 63.7 percent and the small traders (not shown in chart) are Bearish with a score of 46.0 percent.
| SWISS FRANC Statistics | SPECULATORS | COMMERCIALS | SMALL TRADERS |
| – Percent of Open Interest Longs: | 11.4 | 55.2 | 33.3 |
| – Percent of Open Interest Shorts: | 34.6 | 22.1 | 43.3 |
| – Net Position: | -7,941 | 11,357 | -3,416 |
| – Gross Longs: | 3,919 | 18,933 | 11,429 |
| – Gross Shorts: | 11,860 | 7,576 | 14,845 |
| – Long to Short Ratio: | 0.3 to 1 | 2.5 to 1 | 0.8 to 1 |
| NET POSITION TREND: | | | |
| – Strength Index Score (3 Year Range Pct): | 33.6 | 63.7 | 46.0 |
| – Strength Index Reading (3 Year Range): | Bearish | Bullish | Bearish |
| NET POSITION MOVEMENT INDEX: | | | |
| – 6-Week Change in Strength Index: | 11.3 | -10.7 | 7.5 |
Canadian Dollar Futures:
 The Canadian Dollar large speculator standing this week reached a net position of -27,259 contracts in the data reported through Tuesday. This was a weekly gain of 3,696 contracts from the previous week which had a total of -30,955 net contracts.
This week’s current strength score (the trader positioning range over the past three years, measured from 0 to 100) shows the speculators are currently Bearish-Extreme with a score of 9.3 percent. The commercials are Bullish-Extreme with a score of 91.6 percent and the small traders (not shown in chart) are Bearish with a score of 29.6 percent.
| CANADIAN DOLLAR Statistics | SPECULATORS | COMMERCIALS | SMALL TRADERS |
| – Percent of Open Interest Longs: | 15.8 | 57.0 | 24.3 |
| – Percent of Open Interest Shorts: | 36.4 | 36.2 | 24.5 |
| – Net Position: | -27,259 | 27,488 | -229 |
| – Gross Longs: | 20,897 | 75,387 | 32,211 |
| – Gross Shorts: | 48,156 | 47,899 | 32,440 |
| – Long to Short Ratio: | 0.4 to 1 | 1.6 to 1 | 1.0 to 1 |
| NET POSITION TREND: | | | |
| – Strength Index Score (3 Year Range Pct): | 9.3 | 91.6 | 29.6 |
| – Strength Index Reading (3 Year Range): | Bearish-Extreme | Bullish-Extreme | Bearish |
| NET POSITION MOVEMENT INDEX: | | | |
| – 6-Week Change in Strength Index: | -6.2 | 3.8 | 1.2 |
Australian Dollar Futures:
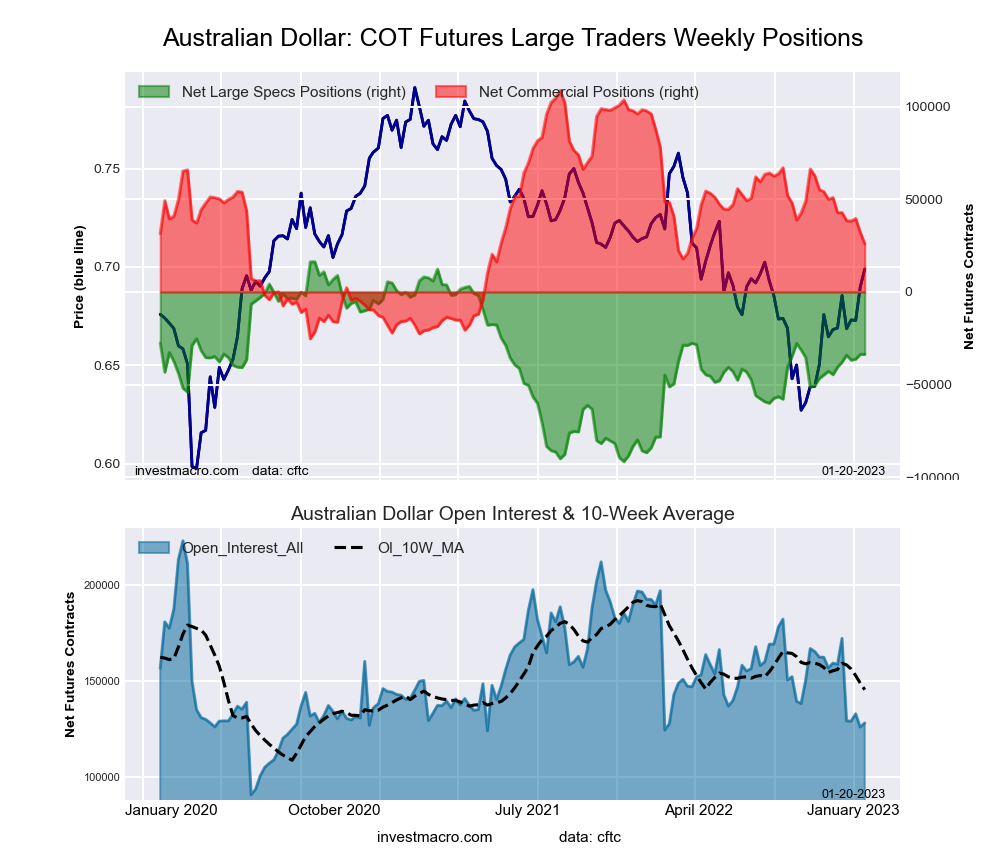 The Australian Dollar large speculator standing this week reached a net position of -33,620 contracts in the data reported through Tuesday. This was a weekly increase of 70 contracts from the previous week which had a total of -33,690 net contracts.
This week’s current strength score (the trader positioning range over the past three years, measured from 0 to 100) shows the speculators are currently Bullish with a score of 53.7 percent. The commercials are Bearish with a score of 38.2 percent and the small traders (not shown in chart) are Bullish with a score of 71.2 percent.
| AUSTRALIAN DOLLAR Statistics | SPECULATORS | COMMERCIALS | SMALL TRADERS |
| – Percent of Open Interest Longs: | 22.3 | 55.4 | 20.6 |
| – Percent of Open Interest Shorts: | 48.5 | 35.2 | 14.6 |
| – Net Position: | -33,620 | 25,936 | 7,684 |
| – Gross Longs: | 28,593 | 71,052 | 26,348 |
| – Gross Shorts: | 62,213 | 45,116 | 18,664 |
| – Long to Short Ratio: | 0.5 to 1 | 1.6 to 1 | 1.4 to 1 |
| NET POSITION TREND: | | | |
| – Strength Index Score (3 Year Range Pct): | 53.7 | 38.2 | 71.2 |
| – Strength Index Reading (3 Year Range): | Bullish | Bearish | Bullish |
| NET POSITION MOVEMENT INDEX: | | | |
| – 6-Week Change in Strength Index: | 6.4 | -12.6 | 24.2 |
New Zealand Dollar Futures:
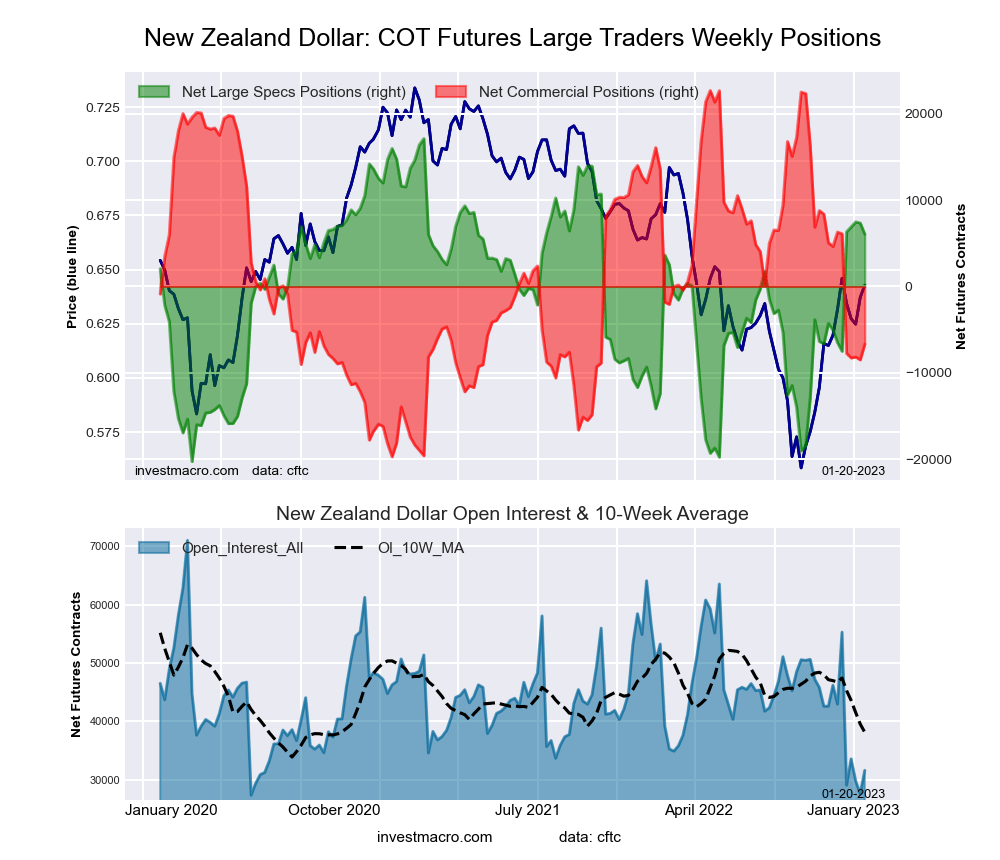 The New Zealand Dollar large speculator standing this week reached a net position of 6,058 contracts in the data reported through Tuesday. This was a weekly fall of -1,292 contracts from the previous week which had a total of 7,350 net contracts.
This week’s current strength score (the trader positioning range over the past three years, measured from 0 to 100) shows the speculators are currently Bullish with a score of 70.4 percent. The commercials are Bearish with a score of 30.7 percent and the small traders (not shown in chart) are Bullish with a score of 58.9 percent.
| NEW ZEALAND DOLLAR Statistics | SPECULATORS | COMMERCIALS | SMALL TRADERS |
| – Percent of Open Interest Longs: | 35.8 | 50.3 | 12.4 |
| – Percent of Open Interest Shorts: | 16.6 | 71.5 | 10.4 |
| – Net Position: | 6,058 | -6,686 | 628 |
| – Gross Longs: | 11,308 | 15,888 | 3,903 |
| – Gross Shorts: | 5,250 | 22,574 | 3,275 |
| – Long to Short Ratio: | 2.2 to 1 | 0.7 to 1 | 1.2 to 1 |
| NET POSITION TREND: | | | |
| – Strength Index Score (3 Year Range Pct): | 70.4 | 30.7 | 58.9 |
| – Strength Index Reading (3 Year Range): | Bullish | Bearish | Bullish |
| NET POSITION MOVEMENT INDEX: | | | |
| – 6-Week Change in Strength Index: | 33.6 | -30.6 | 5.0 |
Mexican Peso Futures:
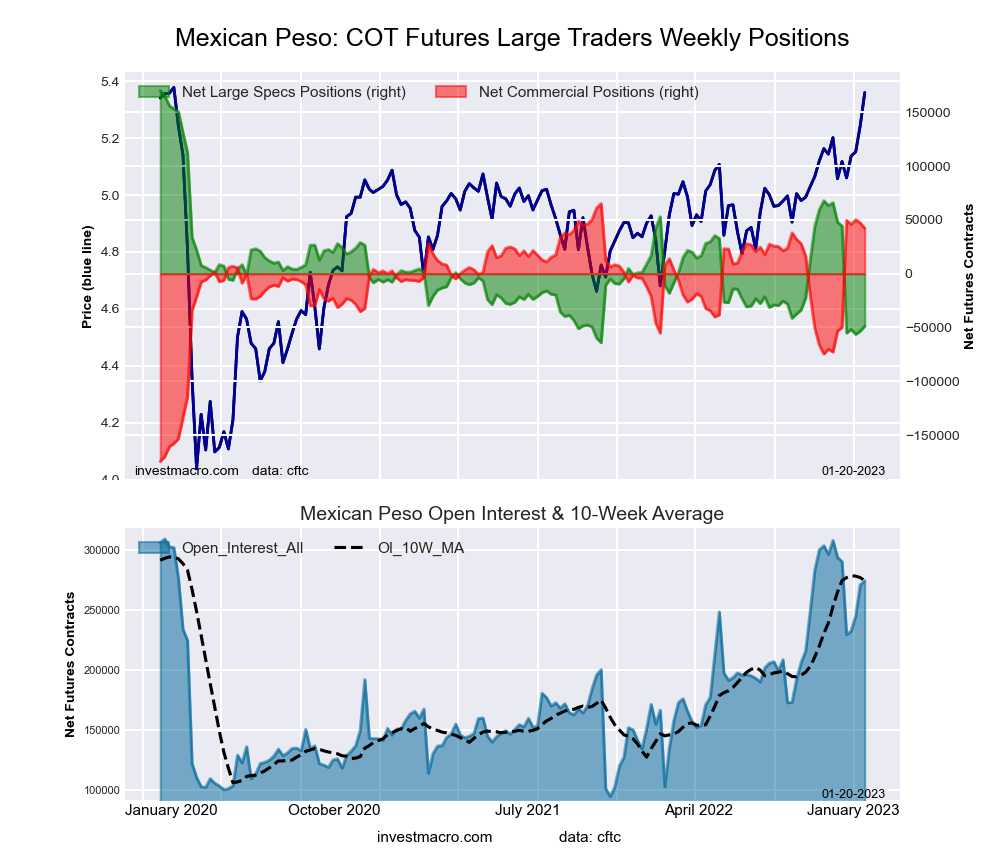 The Mexican Peso large speculator standing this week reached a net position of -48,639 contracts in the data reported through Tuesday. This was a weekly lift of 4,742 contracts from the previous week which had a total of -53,381 net contracts.
This week’s current strength score (the trader positioning range over the past three years, measured from 0 to 100) shows the speculators are currently Bearish-Extreme with a score of 6.6 percent. The commercials are Bullish-Extreme with a score of 90.4 percent and the small traders (not shown in chart) are Bullish-Extreme with a score of 94.9 percent.
| MEXICAN PESO Statistics | SPECULATORS | COMMERCIALS | SMALL TRADERS |
| – Percent of Open Interest Longs: | 54.9 | 41.5 | 3.2 |
| – Percent of Open Interest Shorts: | 72.6 | 26.1 | 0.9 |
| – Net Position: | -48,639 | 42,299 | 6,340 |
| – Gross Longs: | 150,543 | 113,924 | 8,681 |
| – Gross Shorts: | 199,182 | 71,625 | 2,341 |
| – Long to Short Ratio: | 0.8 to 1 | 1.6 to 1 | 3.7 to 1 |
| NET POSITION TREND: | | | |
| – Strength Index Score (3 Year Range Pct): | 6.6 | 90.4 | 94.9 |
| – Strength Index Reading (3 Year Range): | Bearish-Extreme | Bullish-Extreme | Bullish-Extreme |
| NET POSITION MOVEMENT INDEX: | | | |
| – 6-Week Change in Strength Index: | -41.2 | 39.9 | 5.4 |
Brazilian Real Futures:
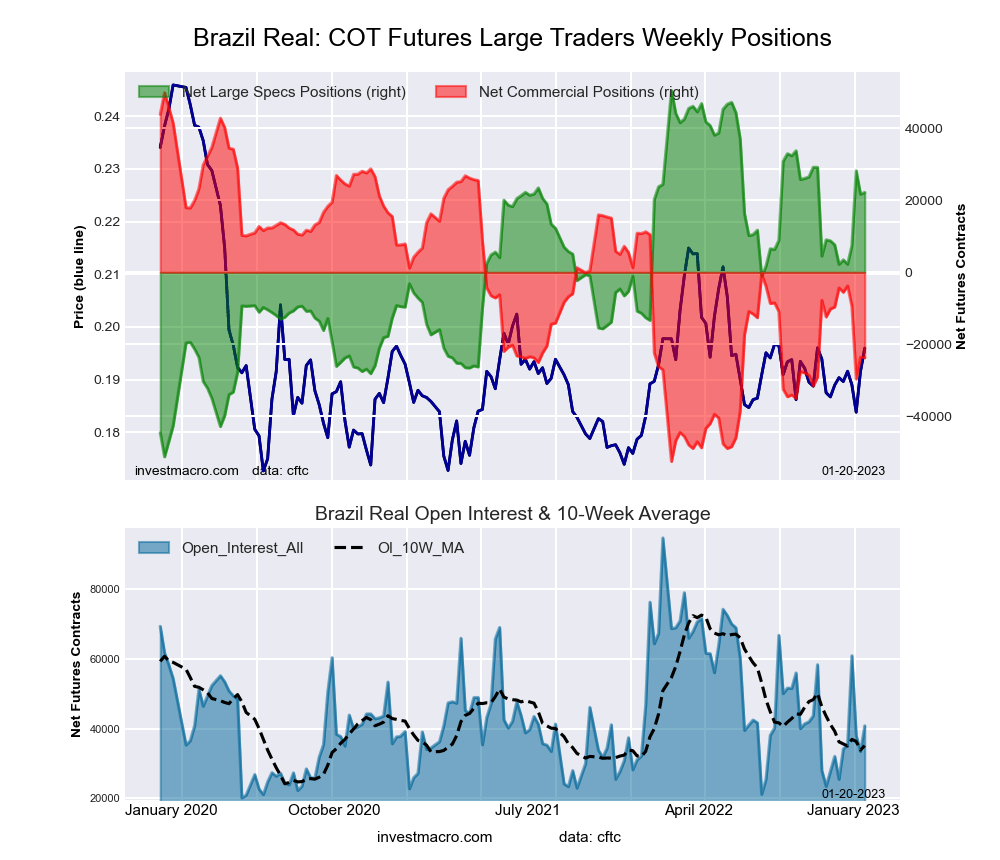 The Brazilian Real large speculator standing this week reached a net position of 22,193 contracts in the data reported through Tuesday. This was a weekly lift of 492 contracts from the previous week which had a total of 21,701 net contracts.
This week’s current strength score (the trader positioning range over the past three years, measured from 0 to 100) shows the speculators are currently Bullish with a score of 69.7 percent. The commercials are Bearish with a score of 30.2 percent and the small traders (not shown in chart) are Bullish with a score of 79.5 percent.
| BRAZIL REAL Statistics | SPECULATORS | COMMERCIALS | SMALL TRADERS |
| – Percent of Open Interest Longs: | 79.5 | 10.5 | 10.0 |
| – Percent of Open Interest Shorts: | 25.1 | 68.7 | 6.2 |
| – Net Position: | 22,193 | -23,748 | 1,555 |
| – Gross Longs: | 32,429 | 4,270 | 4,096 |
| – Gross Shorts: | 10,236 | 28,018 | 2,541 |
| – Long to Short Ratio: | 3.2 to 1 | 0.2 to 1 | 1.6 to 1 |
| NET POSITION TREND: | | | |
| – Strength Index Score (3 Year Range Pct): | 69.7 | 30.2 | 79.5 |
| – Strength Index Reading (3 Year Range): | Bullish | Bearish | Bullish |
| NET POSITION MOVEMENT INDEX: | | | |
| – 6-Week Change in Strength Index: | 21.4 | -20.4 | -6.4 |
Bitcoin Futures:
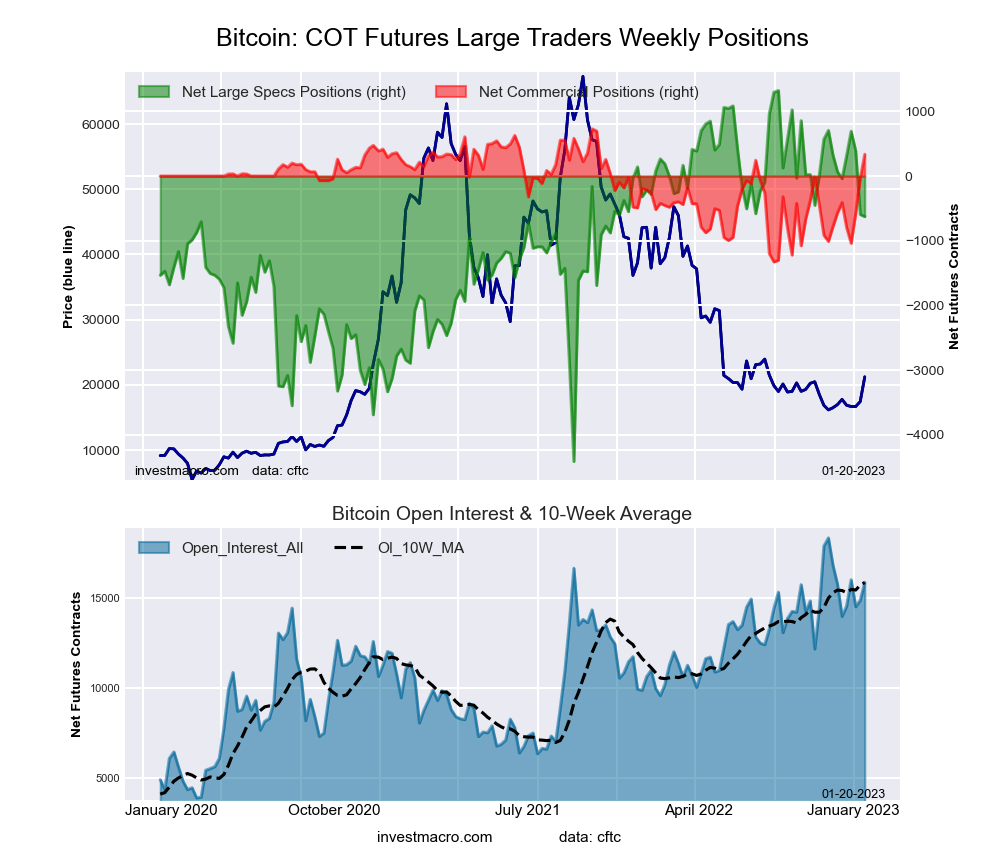 The Bitcoin large speculator standing this week reached a net position of -627 contracts in the data reported through Tuesday. This was a weekly reduction of -33 contracts from the previous week which had a total of -594 net contracts.
This week’s current strength score (the trader positioning range over the past three years, measured from 0 to 100) shows the speculators are currently Bullish with a score of 66.0 percent. The commercials are Bullish-Extreme with a score of 80.9 percent and the small traders (not shown in chart) are Bearish-Extreme with a score of 19.5 percent.
| BITCOIN Statistics | SPECULATORS | COMMERCIALS | SMALL TRADERS |
| – Percent of Open Interest Longs: | 78.4 | 6.0 | 9.1 |
| – Percent of Open Interest Shorts: | 82.4 | 3.9 | 7.2 |
| – Net Position: | -627 | 337 | 290 |
| – Gross Longs: | 12,456 | 951 | 1,440 |
| – Gross Shorts: | 13,083 | 614 | 1,150 |
| – Long to Short Ratio: | 1.0 to 1 | 1.5 to 1 | 1.3 to 1 |
| NET POSITION TREND: | | | |
| – Strength Index Score (3 Year Range Pct): | 66.0 | 80.9 | 19.5 |
| – Strength Index Reading (3 Year Range): | Bullish | Bullish-Extreme | Bearish-Extreme |
| NET POSITION MOVEMENT INDEX: | | | |
| – 6-Week Change in Strength Index: | -12.1 | 44.0 | -4.8 |
Article By InvestMacro – Receive our weekly COT Newsletter
*COT Report: The COT data, released weekly to the public each Friday, is updated through the most recent Tuesday (data is 3 days old) and shows a quick view of how large speculators or non-commercials (for-profit traders) were positioned in the futures markets.
The CFTC categorizes trader positions according to commercial hedgers (traders who use futures contracts for hedging as part of the business), non-commercials (large traders who speculate to realize trading profits) and nonreportable traders (usually small traders/speculators) as well as their open interest (contracts open in the market at time of reporting). See CFTC criteria here.


