Source: Michael Ballanger (1/30/23)
Michael Ballanger of GGM Advisory Inc. shares his thoughts on the S&P 500, the outlook of Gold and Silver, and specifically why he believes you should be interested in Norseman Silver Ltd.
In the mid-1980s, I got to know the late and very much renowned Canadian technical analyst Ian McAvity whose relationship with my boss (Jim Biddell) was forged years earlier in the 1960s when Ian and Jim were amongst the top squash players in Canada. In fact, Ian was a member of the Canadian Champion Doubles Squash team, ranked number one in North America for a time.
He also played exhibition matches against Pakistani-born North American professional champion Sharif Khan while showcasing the sport for South Afrikaan audiences shortly after the fall of apartheid rule. Above all else, Ian was not only a brilliant technical analyst and a pioneer in the use of logarithmic analysis to define trends but also a great storyteller with a wicked sense of humor.
I recall the time Ian put on a seminar at the old Holiday Inn in London, Ontario, and at the end of the presentation during the Q and A period, an elderly bespectacled gentleman got up and began to complain rather vociferously about the advice he was receiving from his stockbroker.
After waiting and listening for several very long moments with the stockbrokers in the audience shifting nervously in their chairs, Ian waited for the man to finish and then return to his seat, at which point Ian said, “When you came into this world, you had nothing. When you leave this world, you take nothing with you. So don’t hate your broker . . . he’s just doing God’s work.”
Between hysterical guffaws and indignant screams of outrage, it was the best comeback ever in the history of boring high finance, and the box of Kleenex I went through wiping the tears of laughter from my cheeks is now legend.
At which point Ian said, “When you came into this world, you had nothing. When you leave this world, you take nothing with you. So don’t hate your broker . . . he’s just doing God’s work.”
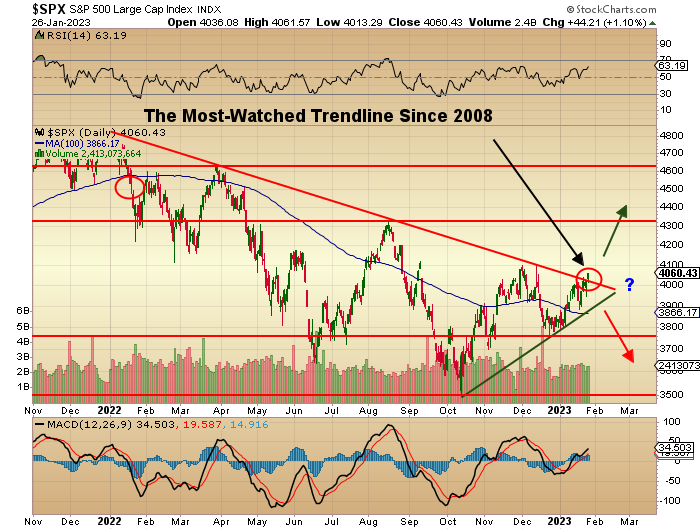
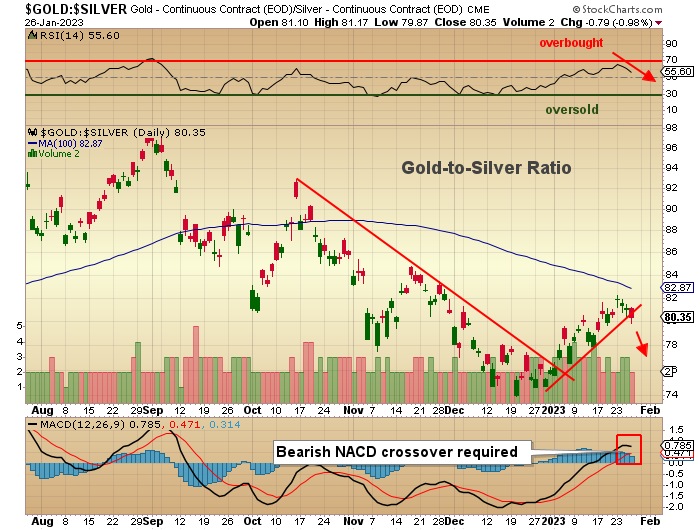
Please refrain from asking me why Ian McAvity suddenly popped into my mind as I sat down to write this weekly missive, but in case you do, the answer lies in the chart shown above that details arguably the most-watched, most-debated and most beaten-to-death technical pattern that has ever existed in the over-analyzed world of stock trading. So, I was wondering how my late friend Ian McAvity would have assessed it . . .
As I have written about for months now, I turned bullish in late September in what can only be described as an “ad hoc” decision. It was totally impulsive, based purely on the massive number of newly-arrived bears, each podcasting their breathless forecasts of stock market Armageddon sure to arrive in October of last year. It was also based on the sentiment numbers and hedge fund positioning (both at bearish extremes) but what sealed the deal for me was when a central bank that had been boasting loudly about its intention to normalize its balance sheet with huge bond sales suddenly did an abrupt one-eighty-degree turn.
When the Bank of England announced their purchase of some US$5 billion worth of 10-year “gilts” in order to alleviate domestic U.K. pension fund “stress,” a psychosomatic alarm bell went off inside me after which I immediately fired off an email alert to subscribers with the opinion that the Bank of England’s “pivot” was the call to arms for all of us to put away the bear clothes and start thinking about a year-end rally, which we got in spades.
The actual low for the S&P was a few trading days later on October 13th, but it was a great call based upon gut feel and had nothing whatsoever to do with the fine science of technical analysis.
S&P 500
That brings me to the topic of the current technical set-up for the S&P 500, which has the entire world focused on what the Twitterverse calls the “MOAT” — as in “Mother of All Trendlines.” We have everyone from thirty-something single moms doing kitchen table financial planning to seasoned CNBC commentators all weighing in on their analysis of this widely-trumpeted “rising wedge” formation that is “most surely” going to resolve itself to the downside and while the Citigroup panic-euphoria gauge has improved from “GREED” to “NEUTRAL,” I suspect that the consensus positioning is still bearish and that, according to Bob Farrell’s trading rule number nine, means that since so many experts all carry the same opinion, odds dictate an equal but opposite outcome.
With the wit and wisdom of Ian McAvity as my compass, this is what I surmised might be the probable outcome: (from Email Alert 2023-08)
“What I see happening by mid-February is the likelihood that Sam Bankman-Fried operating from the back room of his parents’ multi-million-dollar apartment in NYC, devises an algorithm that sends the S&P straight north of the ascending wedge, triggering an avalanche of “BUY” order from legion after legion of algobot traders, into which SBF shorts the entire volume surge sending the S&P southward and in full “failed-breakout” status. His coaches will be Elizabeth Holmes and the ghost of Bernie Madoff to ensure proper execution with zero prisoners taken.”
At the end of the day, only the market itself has any idea where it is going to wind up so technical analysis is simply just another tool.
My point in that veiled attempt at dark humor is that if there is one thing that Ian McAvity preached in his weekly “Deliberations” newsletter, was that at the end of the day, only the market itself has any idea where it is going to wind up so technical analysis is simply just another tool (like a few of the self-inflated podcasters I watch) with which to make investment/trading decisions.
I urge all of you attempting to use the resolution of the MOAT to park the current MSM obsession in the closet and let the “Two-day Close Rule” take effect before committing capital to the next “no-brainer” trade…
This past week I counted news releases from every junior developer/explorer in my 2023 GGMA Portfolio list as the consensus for 2023 is now tilting in the direction of the return of the commodities bull led by gold and silver but dominated by silver. It was almost as if every junior CEO/President were sent the advanced screening of Rick Rule’s appearance on Adam Taggert’s Wealtheon podcast, where the most-erudite stock peddler in world history (Rule) delivers a compellingly-verbose rendering of the commodities version of “In Flanders Field” punctuated with a “to those with failing hands we throw the torch — hold it high” dissertation on silver and why Rick is going to join Neil Armstrong in taking “one small step for a man, but one giant leap for my net worth statement” (i.e., “da moon”)
Gold and Silver
Moonshots notwithstanding, silver has lagged behind gold and copper since late December, and while it can be argued that silver was the standout leader from late September to late December, gold and copper are simply playing “catchup.” I disagree. Traders live in the “now,” and until silver can get to a new recovery high for the advance above US$24.77 (basis March silver), the entire metals complex is going to be vulnerable to another bear raid that serves to deflate not only spirits but also the P&L’s of thousands of short-term option and futures punters that are reading and singing off the Rick Rule hymn sheet.
Since those are the very people that will be buying the junior miners, explorers, and developers (all of which I own), I do not wish to see gold and copper actually “catch up” to silver because chances are by the time that happens, the rally will be punctuated with terminal violence (and cries of anguish).
Norseman Silver
I mentioned Allied Copper Corp. (CPR:TSX.V; CPRRF:OTCQB) last week, and since it popped 46.4% this week, prompting dozens upon dozens of emails requesting more of these “penny dreadful” names, I offer this week another one but for a vastly different reason. The name is Norseman Silver Ltd. (NOC:TSX.V; NOCSF:OTCQB), whose principal project is located in South America.
In my career, there have always been areas of the world where the risk premium is elevated either due to the absence of the Rule of Law, infrastructure deficiencies, or domestic politics. In recent years, populist movements around the globe have shifted the winds of foreign investment in many different directions and in some cases, surprisingly hostile from the most unexpected of countries.
Mexico was once the favorite playground for Canadian miners as it was part of the NAFTA accord, so the free trade statutes were always there to protect the foreign investor. That has now changed with the news that Fortuna Silver has had its San Jose mine in southern Oaxaca shuttered due to environmental concerns. Civil unrest and local community protests have shut down countless operations in Peru recently, and for Peru, where over 40% of national taxes are generated by miners, that is a striking development.
I have a dear friend from the U.S. Midwest whose uncles are all worldly entrepreneurs whose contacts monitor foreign investment flows as a means of practicing the “Follow the Money” school of due diligence. He tells me that there are absolutely massive investment dollars being channeled into three South American countries in the fourth quarter of 2022 and again in January of 2023, with Paraguay and Ecuador the two lesser recipients. However, the primary focus of these enormous capital investments is the one country least likely in the past to enjoy such good fortune — Argentina.
The reality is that when governments erect roadblocks to exploration and development, vast regions that contain potential district-scale mining camps fall into the category of “underexplored” and, therefore, by default, “underdeveloped,” and therein lies the opportunity.
When I think of Argentina, all I can recall is that it has a massive inflation problem (94% in 2022) and that it has tended historically to be decidedly anti-mining and anti-foreign in its treatment of investors.
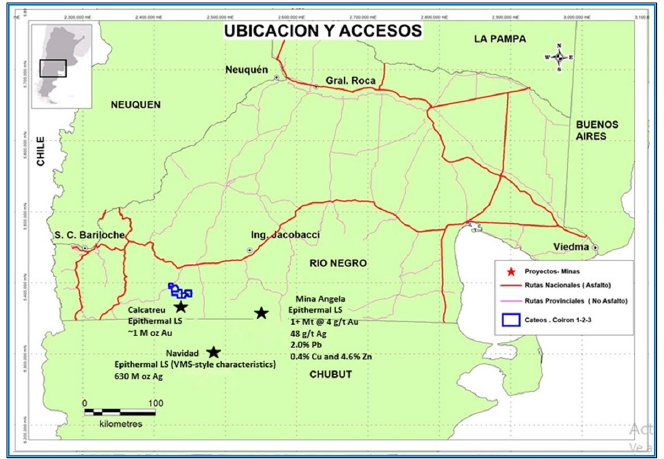
As an example, in 2009, Pan American Silver Corp. (PAAS:TSX; PAAS:NASDAQ) bought the Navidad Silver deposit through the acquisition of Aquiline for US$630 million, only to discover that the province of Chubut disallowed the use of cyanide in mining operations thus preventing commercial exploitation of one of the world’s largest and richest undeveloped silver deposits.
However, recent legislation began to move in the opposite direction, as “limited development” is now possible in 2023. The reality is that when governments erect roadblocks to exploration and development, vast regions that contain potential district-scale mining camps fall into the category of “underexplored” and, therefore, by default, “underdeveloped,” and therein lies the opportunity.
The Navidad silver deposit was discovered in a geological setting in Patagonia known as the “Gastre Fault” structural corridor, which also contains the Calcatreu Gold Mine. It is a vast region largely untapped, but if a foreign entity can enlist the right person or group to navigate the permitting waters successfully, they will have earned the “first mover advantage,” and that is exactly what Norseman silver has accomplished with their acquisition of the Taquetren Project, a land package of some 145,000 acres located in the Navidad-Calcatreu Mining District.
Gold Ridge
Of even greater importance is that the prospector-geologist and Argentinian national that discovered Navidad, Daniel Bussandri, is now Norseman’s country manager and is completely in charge of all operations, including exploration and permitting, for Taquetren. To have a local with a proven track record as a mine-finder at the helm is an asset that is hard to assess, but the one thing I know for sure is that the risk premium that one would normally assign has now been mitigated by the presence of Daniel Bussandri.
Press releases in 2022 have revealed mineralized outcrops of major copper-silver credits and some minor gold occurrences, but that last one from January 23rd was a game-changer.
Buy Norseman Silver.
It detailed the discovery of a 2 km long, 0.5 km wide mineralized vein structure where sub-crops yielded values as high as 12.2 g/t Au with this “Gold Ridge” zone lying within a larger 5 km long corridor hosting the Martha, Neta Nueva, Irma, and Veta Juan targets.
I have learned that the most recent sampling results at Gold Ridge are attracting the eyes and interest of more than a few of the consulting geologists, including 82-year-old crusty veteran geo Ron McMillan, who carries the reputation of being “unexcitable” about anything to do with early-stage exploration. Well, apparently, Mr. McMillan is “noticeably excited” about Gold Ridge, and given that it is located 20 km NW of Calcatreu and in the same mining district, I deem that as significant.
Norseman is completing a fast CA$750k funding in order to pay for the geophysical survey ordered last week, so with the existing CA$600,000 working capital position, the company is fully-funded to commence drilling once targets have been identified and permits received.
In sum, we have what might be a new gold discovery in a known gold-bearing region located in a largely-underexplored part of the world where for the first time in recent memory, large investment flows are suddenly and impressively showing up. We have a country manager with a proven track record and voluminous local relationships in order to facilitate the needs of the local politicians as he tries to capture the Navidad lightning in the junior exploration bottle once again. Remember, Navidad was sold for US$630 million.
At a CA$6.3m market cap, Norseman Silver Inc. appears ready to assume a dominant role in the Patagonia region as a first-mover with strong management at all levels and with a large land package in a mine-bearing region.
Buy Norseman Silver.
Michael Ballanger Disclaimer:
This letter makes no guarantee or warranty on the accuracy or completeness of the data provided. Nothing contained herein is intended or shall be deemed to be investment advice, implied or otherwise. This letter represents my views and replicates trades that I am making but nothing more than that. Always consult your registered advisor to assist you with your investments. I accept no liability for any loss arising from the use of the data contained on this letter. Options and junior mining stocks contain a high level of risk that may result in the loss of part or all invested capital and therefore are suitable for experienced and professional investors and traders only. One should be familiar with the risks involved in junior mining and options trading and we recommend consulting a financial adviser if you feel you do not understand the risks involved.
Disclosures:
1) Michael J. Ballanger: I, or members of my immediate household or family, own securities of the following companies mentioned in this article: All. I personally am, or members of my immediate household or family are, paid by the following companies mentioned in this article: My company, Bonaventure Explorations Ltd., has a consulting relationship with: None.
2) The following companies mentioned in this article are billboard sponsors of Streetwise Reports: None. Click here for important disclosures about sponsor fees. As of the date of this article, an affiliate of Streetwise Reports has a consulting relationship with: None. Please click here for more information.
3) Statements and opinions expressed are the opinions of the author and not of Streetwise Reports or its officers. The author is wholly responsible for the validity of the statements. The author was not paid by Streetwise Reports for this article. Streetwise Reports was not paid by the author to publish or syndicate this article. Streetwise Reports requires contributing authors to disclose any shareholdings in, or economic relationships with, companies that they write about. Streetwise Reports relies upon the authors to accurately provide this information and Streetwise Reports has no means of verifying its accuracy.
4) This article does not constitute investment advice. Each reader is encouraged to consult with his or her individual financial professional and any action a reader takes as a result of information presented here is his or her own responsibility. By opening this page, each reader accepts and agrees to Streetwise Reports’ terms of use and full legal disclaimer. This article is not a solicitation for investment. Streetwise Reports does not render general or specific investment advice and the information on Streetwise Reports should not be considered a recommendation to buy or sell any security. Streetwise Reports does not endorse or recommend the business, products, services or securities of any company mentioned on Streetwise Reports.
5) From time to time, Streetwise Reports LLC and its directors, officers, employees or members of their families, as well as persons interviewed for articles and interviews on the site, may have a long or short position in securities mentioned. Directors, officers, employees or members of their immediate families are prohibited from making purchases and/or sales of those securities in the open market or otherwise from the time of the decision to publish an article until three business days after the publication of the article. The foregoing prohibition does not apply to articles that in substance only restate previously published company releases.
As of the date of this article, officers and/or employees of Streetwise Reports LLC (including members of their household) own securities of Allied Copper Corp. and Norseman Silver Ltd., companies mentioned in this article.