
By InvestMacro
Here are the latest charts and statistics for the Commitment of Traders (COT) data published by the Commodities Futures Trading Commission (CFTC).
The latest COT data is updated through Tuesday October 31st and shows a quick view of how large traders (for-profit speculators and commercial entities) were positioned in the futures markets.
Weekly Speculator Changes led by Gold & Platinum
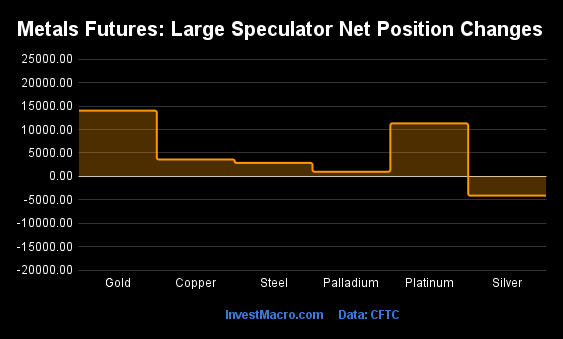
The COT metals markets speculator bets were higher this week as five out of the six metals markets we cover had higher positioning while only one market had lower speculator contracts.
Leading the gains for the metals was Gold (14,040 contracts) with Platinum (11,306 contracts), Copper (3,599 contracts), Steel (2,869 contracts) and Palladium (987 contracts) also coming along with positive weeks.
The market with a decline in speculator bets for the week was Silver with a decrease of -4,121 contracts on the week.
| Oct-31-2023 | OI | OI-Index | Spec-Net | Spec-Index | Com-Net | COM-Index | Smalls-Net | Smalls-Index |
|---|---|---|---|---|---|---|---|---|
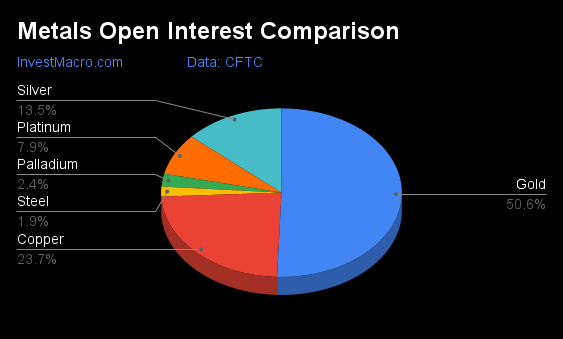
| Gold | 475,808 | 25 | 163,425 | 49 | -182,707 | 53 | 19,282 | 31 |
| Silver | 126,549 | 15 | 20,211 | 47 | -33,139 | 54 | 12,928 | 38 |
| Copper | 222,566 | 60 | -17,161 | 16 | 18,395 | 87 | -1,234 | 11 |
| Palladium | 22,943 | 100 | -10,253 | 8 | 10,163 | 92 | 90 | 47 |
| Platinum | 74,768 | 65 | 10,826 | 41 | -14,186 | 64 | 3,360 | 13 |
Strength Scores led by Steel & Gold
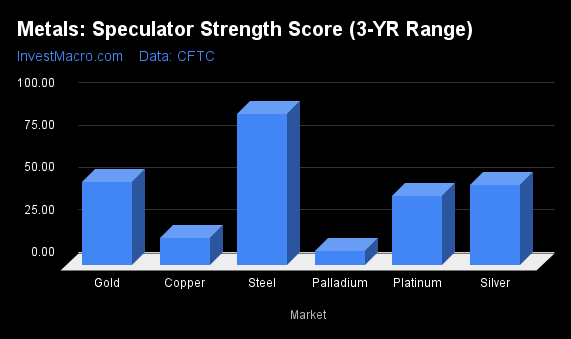
COT Strength Scores (a normalized measure of Speculator positions over a 3-Year range, from 0 to 100 where above 80 is Extreme-Bullish and below 20 is Extreme-Bearish) showed that Steel (89 percent) leads the metals markets this week. Gold (49 percent) comes in as the next highest in the weekly strength scores.
On the downside, Palladium (8.2 percent) and Copper (16 percent) are at the lowest strength levels currently and are in Extreme-Bearish territory (below 20 percent).
Strength Statistics:
Gold (49.0 percent) vs Gold previous week (42.8 percent)
Silver (47.1 percent) vs Silver previous week (53.0 percent)
Copper (16.0 percent) vs Copper previous week (12.9 percent)
Platinum (40.6 percent) vs Platinum previous week (14.5 percent)
Palladium (8.2 percent) vs Palladium previous week (1.7 percent)
Steel (89.3 percent) vs Palladium previous week (77.9 percent)
Gold & Steel top the 6-Week Strength Trends
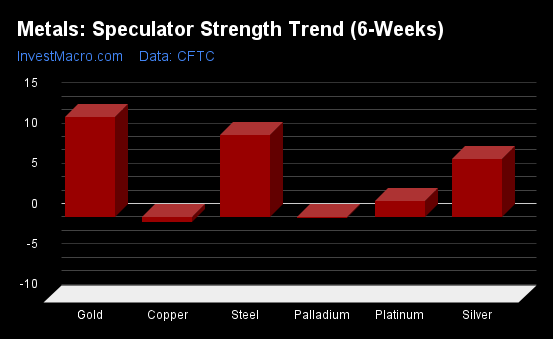
COT Strength Score Trends (or move index, calculates the 6-week changes in strength scores) showed that Gold (12 percent) and Steel (10 percent) lead the past six weeks trends for metals. Silver (7 percent) is the next highest positive mover in the latest trends data.
Copper (-1 percent) leads the downside trend scores currently.
Move Statistics:
Gold (12.4 percent) vs Gold previous week (11.2 percent)
Silver (7.1 percent) vs Silver previous week (9.0 percent)
Copper (-0.7 percent) vs Copper previous week (-7.3 percent)
Platinum (1.9 percent) vs Platinum previous week (-16.6 percent)
Palladium (-0.2 percent) vs Palladium previous week (-3.5 percent)
Steel (10.1 percent) vs Steel previous week (-1.7 percent)
Individual Markets:
Gold Comex Futures:
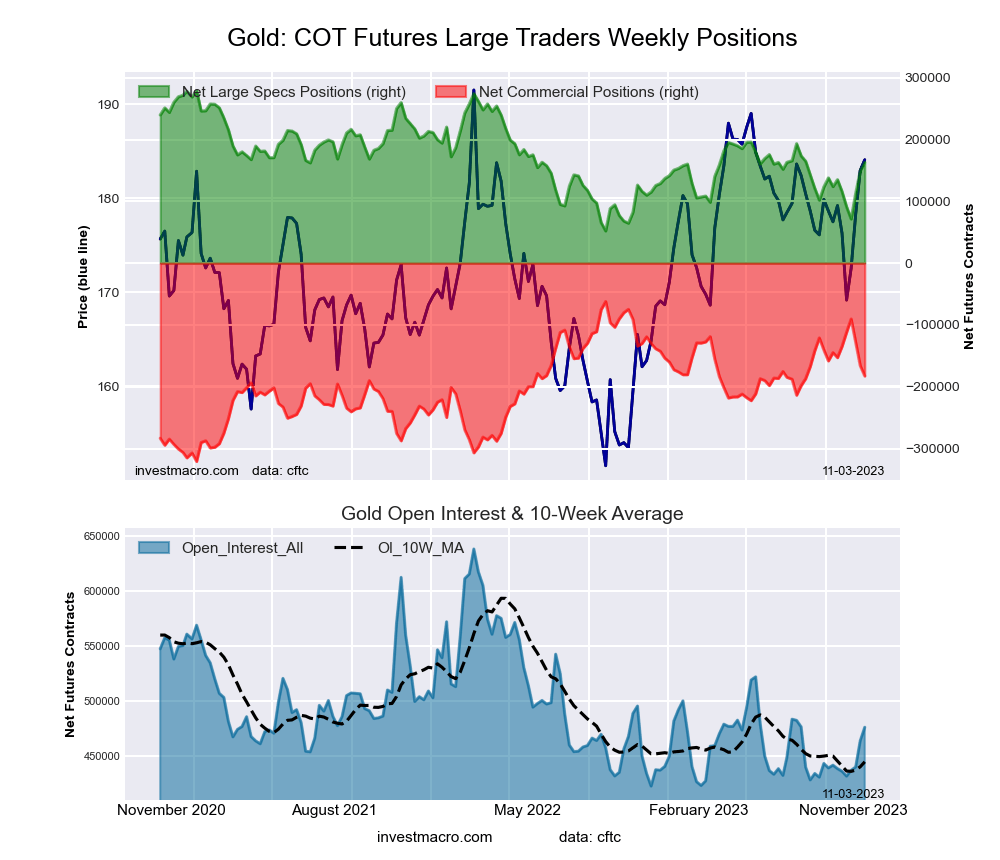 The Gold Comex Futures large speculator standing this week equaled a net position of 163,425 contracts in the data reported through Tuesday. This was a weekly rise of 14,040 contracts from the previous week which had a total of 149,385 net contracts.
This week’s current strength score (the trader positioning range over the past three years, measured from 0 to 100) shows the speculators are currently Bearish with a score of 49.0 percent. The commercials are Bullish with a score of 53.4 percent and the small traders (not shown in chart) are Bearish with a score of 31.2 percent.
Price Trend-Following Model: Strong Uptrend
Our weekly trend-following model classifies the current market price position as: Strong Uptrend. The current action for the model is considered to be: New Buy – Long Position.
| Gold Futures Statistics | SPECULATORS | COMMERCIALS | SMALL TRADERS |
| – Percent of Open Interest Longs: | 54.9 | 22.3 | 9.4 |
| – Percent of Open Interest Shorts: | 20.5 | 60.7 | 5.4 |
| – Net Position: | 163,425 | -182,707 | 19,282 |
| – Gross Longs: | 261,053 | 105,971 | 44,792 |
| – Gross Shorts: | 97,628 | 288,678 | 25,510 |
| – Long to Short Ratio: | 2.7 to 1 | 0.4 to 1 | 1.8 to 1 |
| NET POSITION TREND: | |||
| – Strength Index Score (3 Year Range Pct): | 49.0 | 53.4 | 31.2 |
| – Strength Index Reading (3 Year Range): | Bearish | Bullish | Bearish |
| NET POSITION MOVEMENT INDEX: | |||
| – 6-Week Change in Strength Index: | 12.4 | -11.5 | 4.2 |
Silver Comex Futures:
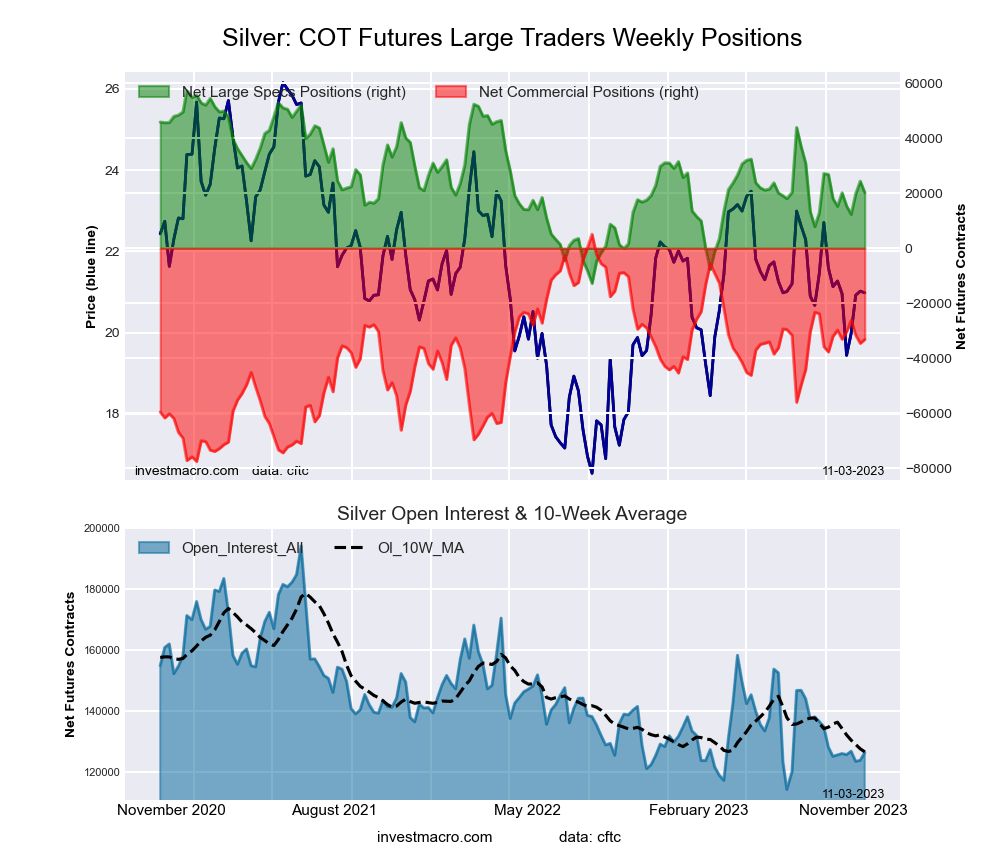 The Silver Comex Futures large speculator standing this week equaled a net position of 20,211 contracts in the data reported through Tuesday. This was a weekly reduction of -4,121 contracts from the previous week which had a total of 24,332 net contracts.
This week’s current strength score (the trader positioning range over the past three years, measured from 0 to 100) shows the speculators are currently Bearish with a score of 47.1 percent. The commercials are Bullish with a score of 53.7 percent and the small traders (not shown in chart) are Bearish with a score of 38.2 percent.
Price Trend-Following Model: Downtrend
Our weekly trend-following model classifies the current market price position as: Downtrend. The current action for the model is considered to be: Hold – Maintain Short Position.
| Silver Futures Statistics | SPECULATORS | COMMERCIALS | SMALL TRADERS |
| – Percent of Open Interest Longs: | 37.9 | 32.0 | 20.4 |
| – Percent of Open Interest Shorts: | 22.0 | 58.1 | 10.2 |
| – Net Position: | 20,211 | -33,139 | 12,928 |
| – Gross Longs: | 48,025 | 40,441 | 25,863 |
| – Gross Shorts: | 27,814 | 73,580 | 12,935 |
| – Long to Short Ratio: | 1.7 to 1 | 0.5 to 1 | 2.0 to 1 |
| NET POSITION TREND: | |||
| – Strength Index Score (3 Year Range Pct): | 47.1 | 53.7 | 38.2 |
| – Strength Index Reading (3 Year Range): | Bearish | Bullish | Bearish |
| NET POSITION MOVEMENT INDEX: | |||
| – 6-Week Change in Strength Index: | 7.1 | -4.1 | -9.1 |
Copper Grade #1 Futures:
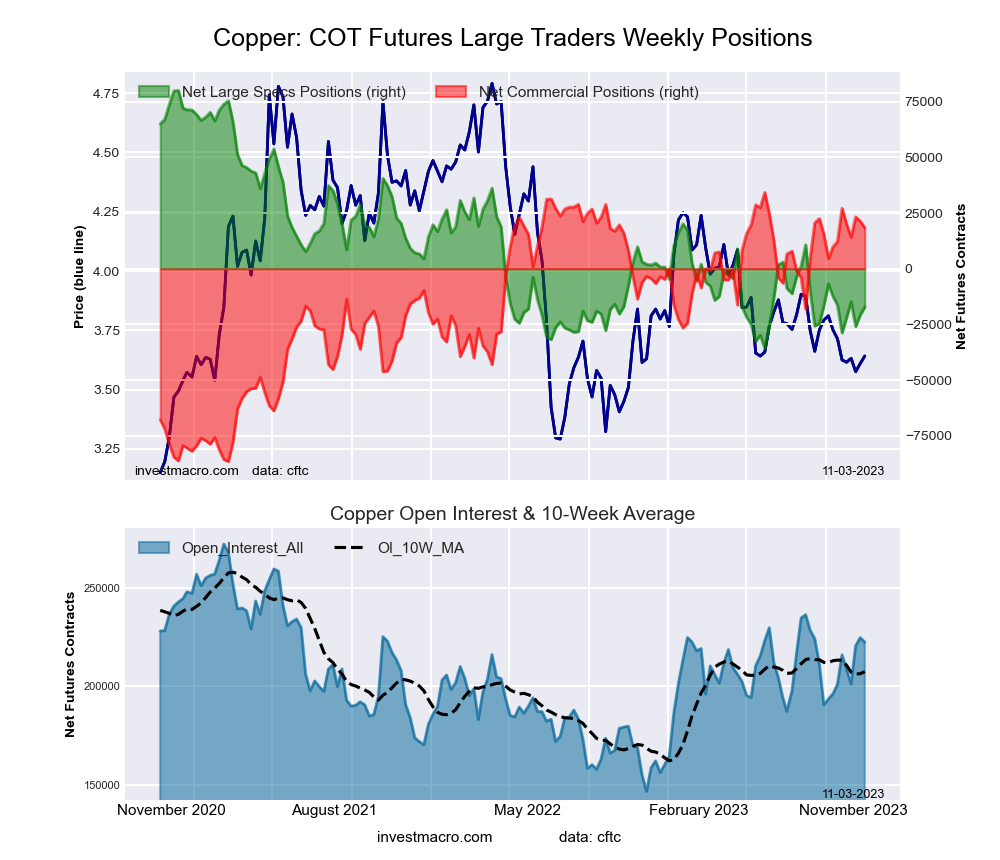 The Copper Grade #1 Futures large speculator standing this week equaled a net position of -17,161 contracts in the data reported through Tuesday. This was a weekly increase of 3,599 contracts from the previous week which had a total of -20,760 net contracts.
This week’s current strength score (the trader positioning range over the past three years, measured from 0 to 100) shows the speculators are currently Bearish-Extreme with a score of 16.0 percent. The commercials are Bullish-Extreme with a score of 86.9 percent and the small traders (not shown in chart) are Bearish-Extreme with a score of 10.7 percent.
Price Trend-Following Model: Downtrend
Our weekly trend-following model classifies the current market price position as: Downtrend. The current action for the model is considered to be: Hold – Maintain Short Position.
| Copper Futures Statistics | SPECULATORS | COMMERCIALS | SMALL TRADERS |
| – Percent of Open Interest Longs: | 31.4 | 36.4 | 6.6 |
| – Percent of Open Interest Shorts: | 39.1 | 28.1 | 7.2 |
| – Net Position: | -17,161 | 18,395 | -1,234 |
| – Gross Longs: | 69,909 | 81,000 | 14,745 |
| – Gross Shorts: | 87,070 | 62,605 | 15,979 |
| – Long to Short Ratio: | 0.8 to 1 | 1.3 to 1 | 0.9 to 1 |
| NET POSITION TREND: | |||
| – Strength Index Score (3 Year Range Pct): | 16.0 | 86.9 | 10.7 |
| – Strength Index Reading (3 Year Range): | Bearish-Extreme | Bullish-Extreme | Bearish-Extreme |
| NET POSITION MOVEMENT INDEX: | |||
| – 6-Week Change in Strength Index: | -0.7 | 5.0 | -32.9 |
Platinum Futures:
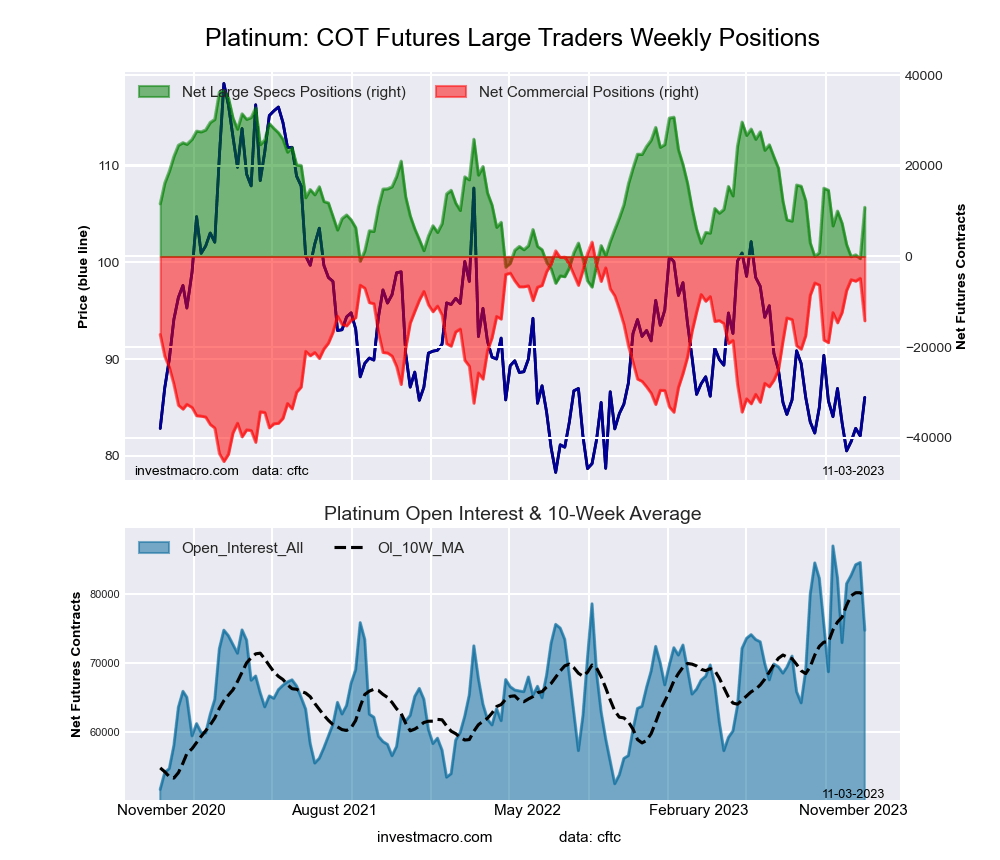 The Platinum Futures large speculator standing this week equaled a net position of 10,826 contracts in the data reported through Tuesday. This was a weekly boost of 11,306 contracts from the previous week which had a total of -480 net contracts.
This week’s current strength score (the trader positioning range over the past three years, measured from 0 to 100) shows the speculators are currently Bearish with a score of 40.6 percent. The commercials are Bullish with a score of 64.1 percent and the small traders (not shown in chart) are Bearish-Extreme with a score of 13.2 percent.
Price Trend-Following Model: Weak Downtrend (Possible Trend Change)
Our weekly trend-following model classifies the current market price position as: Weak Downtrend. The current action for the model is considered to be: Hold – Maintain Short Position.
| Platinum Futures Statistics | SPECULATORS | COMMERCIALS | SMALL TRADERS |
| – Percent of Open Interest Longs: | 59.2 | 22.6 | 9.6 |
| – Percent of Open Interest Shorts: | 44.8 | 41.6 | 5.1 |
| – Net Position: | 10,826 | -14,186 | 3,360 |
| – Gross Longs: | 44,291 | 16,925 | 7,145 |
| – Gross Shorts: | 33,465 | 31,111 | 3,785 |
| – Long to Short Ratio: | 1.3 to 1 | 0.5 to 1 | 1.9 to 1 |
| NET POSITION TREND: | |||
| – Strength Index Score (3 Year Range Pct): | 40.6 | 64.1 | 13.2 |
| – Strength Index Reading (3 Year Range): | Bearish | Bullish | Bearish-Extreme |
| NET POSITION MOVEMENT INDEX: | |||
| – 6-Week Change in Strength Index: | 1.9 | 0.9 | -17.0 |
Palladium Futures:
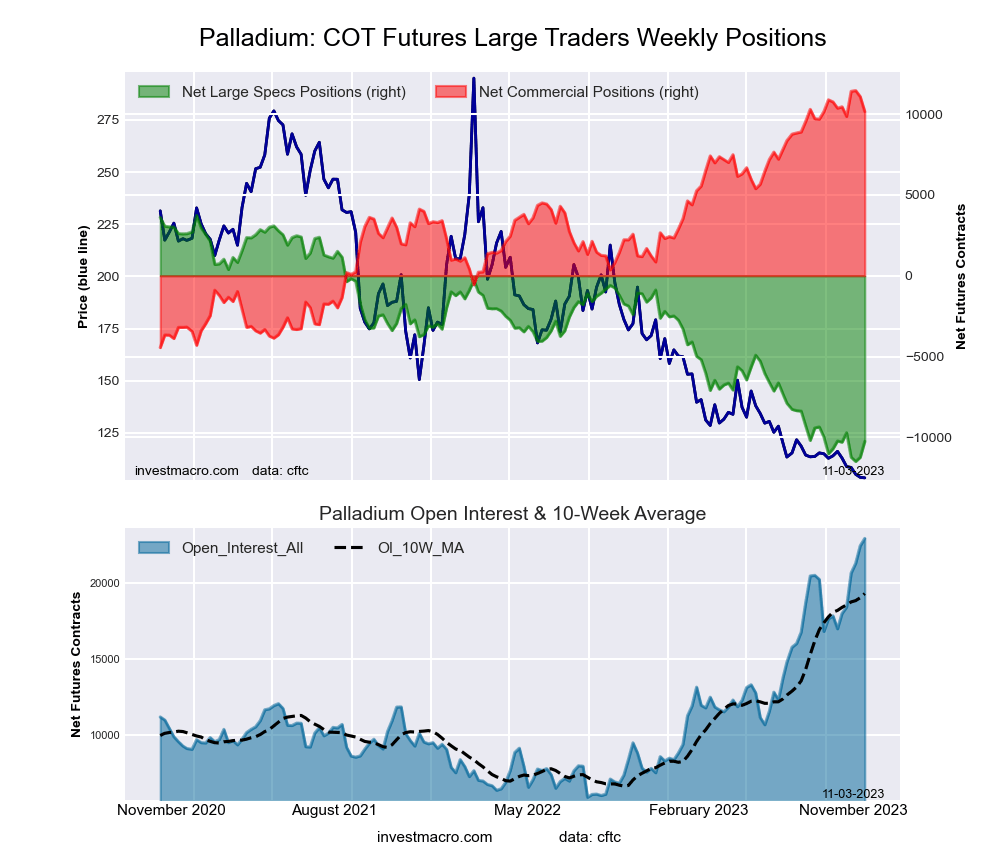 The Palladium Futures large speculator standing this week equaled a net position of -10,253 contracts in the data reported through Tuesday. This was a weekly boost of 987 contracts from the previous week which had a total of -11,240 net contracts.
This week’s current strength score (the trader positioning range over the past three years, measured from 0 to 100) shows the speculators are currently Bearish-Extreme with a score of 8.2 percent. The commercials are Bullish-Extreme with a score of 91.8 percent and the small traders (not shown in chart) are Bearish with a score of 47.1 percent.
Price Trend-Following Model: Strong Downtrend
Our weekly trend-following model classifies the current market price position as: Strong Downtrend. The current action for the model is considered to be: Hold – Maintain Short Position.
| Palladium Futures Statistics | SPECULATORS | COMMERCIALS | SMALL TRADERS |
| – Percent of Open Interest Longs: | 22.2 | 51.9 | 7.9 |
| – Percent of Open Interest Shorts: | 66.9 | 7.6 | 7.5 |
| – Net Position: | -10,253 | 10,163 | 90 |
| – Gross Longs: | 5,096 | 11,915 | 1,807 |
| – Gross Shorts: | 15,349 | 1,752 | 1,717 |
| – Long to Short Ratio: | 0.3 to 1 | 6.8 to 1 | 1.1 to 1 |
| NET POSITION TREND: | |||
| – Strength Index Score (3 Year Range Pct): | 8.2 | 91.8 | 47.1 |
| – Strength Index Reading (3 Year Range): | Bearish-Extreme | Bullish-Extreme | Bearish |
| NET POSITION MOVEMENT INDEX: | |||
| – 6-Week Change in Strength Index: | -0.2 | -1.3 | 13.9 |
Steel Futures Futures:
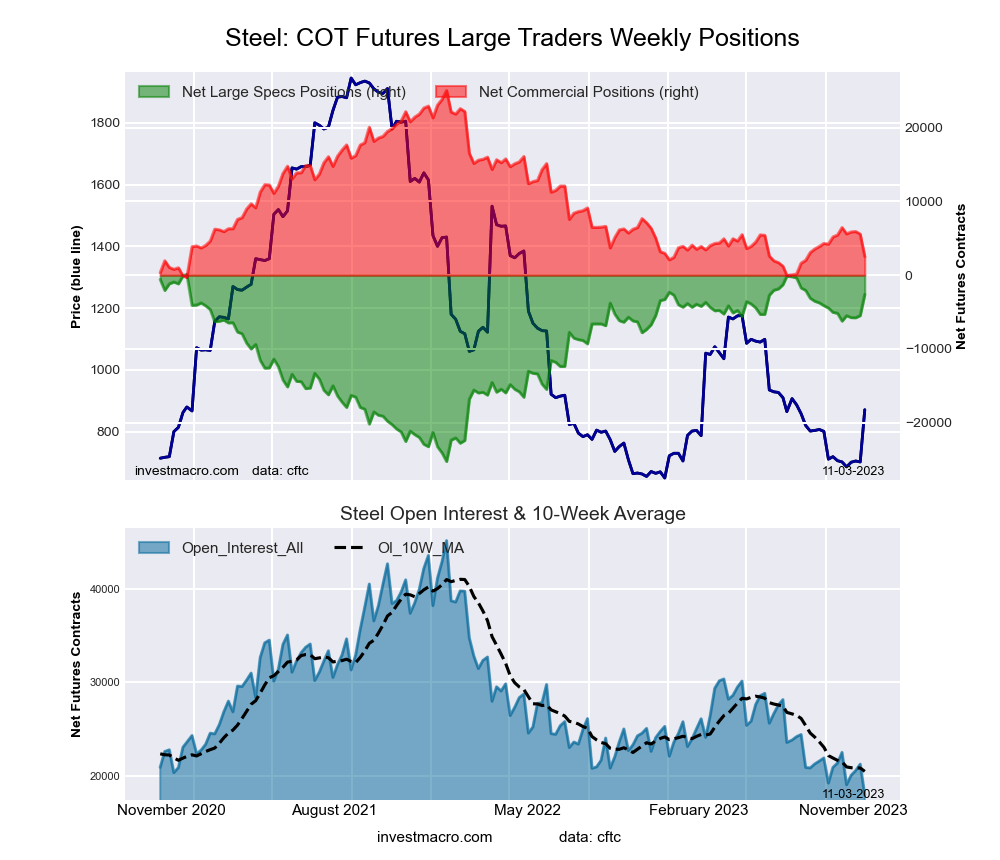 The Steel Futures large speculator standing this week equaled a net position of -2,600 contracts in the data reported through Tuesday. This was a weekly gain of 2,869 contracts from the previous week which had a total of -5,469 net contracts.
This week’s current strength score (the trader positioning range over the past three years, measured from 0 to 100) shows the speculators are currently Bullish-Extreme with a score of 89.3 percent. The commercials are Bearish-Extreme with a score of 11.2 percent and the small traders (not shown in chart) are Bearish with a score of 39.9 percent.
Price Trend-Following Model: Weak Downtrend (Possible Trend Change)
Our weekly trend-following model classifies the current market price position as: Weak Downtrend. The current action for the model is considered to be: Hold – Maintain Short Position.
| Steel Futures Statistics | SPECULATORS | COMMERCIALS | SMALL TRADERS |
| – Percent of Open Interest Longs: | 17.3 | 76.7 | 2.1 |
| – Percent of Open Interest Shorts: | 31.7 | 62.6 | 1.7 |
| – Net Position: | -2,600 | 2,531 | 69 |
| – Gross Longs: | 3,103 | 13,774 | 380 |
| – Gross Shorts: | 5,703 | 11,243 | 311 |
| – Long to Short Ratio: | 0.5 to 1 | 1.2 to 1 | 1.2 to 1 |
| NET POSITION TREND: | |||
| – Strength Index Score (3 Year Range Pct): | 89.3 | 11.2 | 39.9 |
| – Strength Index Reading (3 Year Range): | Bullish-Extreme | Bearish-Extreme | Bearish |
| NET POSITION MOVEMENT INDEX: | |||
| – 6-Week Change in Strength Index: | 10.1 | -11.5 | 39.9 |
Article By InvestMacro – Receive our weekly COT Newsletter
*COT Report: The COT data, released weekly to the public each Friday, is updated through the most recent Tuesday (data is 3 days old) and shows a quick view of how large speculators or non-commercials (for-profit traders) were positioned in the futures markets.
The CFTC categorizes trader positions according to commercial hedgers (traders who use futures contracts for hedging as part of the business), non-commercials (large traders who speculate to realize trading profits) and nonreportable traders (usually small traders/speculators) as well as their open interest (contracts open in the market at time of reporting). See CFTC criteria here.


