
GBPUSD, “Great Britain Pound vs US Dollar”
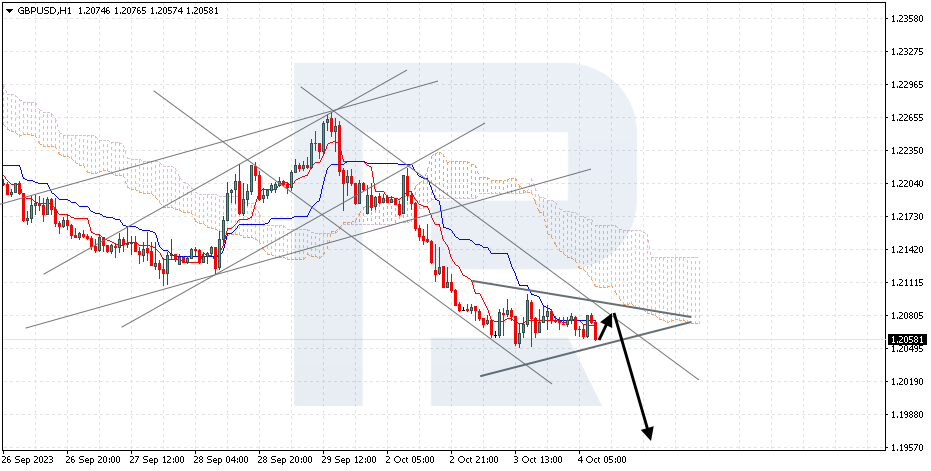
GBPUSD is correcting within a Triangle pattern. The instrument is going below the Ichimoku Cloud, which suggests a downtrend. A test of the Kijun-Sen line at 1.2080 is expected, followed by a decline to 1.1965. An additional signal confirming the decline will be a rebound from the upper boundary of the descending channel. The scenario can be cancelled by a breakout of the upper boundary of the Cloud with the price securing above 1.2175, which will mean further growth to 1.2265. Meanwhile, the decline could be confirmed by a breakout of the lower boundary of the Triangle pattern with the price securing under 1.2040.

USDCHF, “US Dollar vs Swiss Franc”
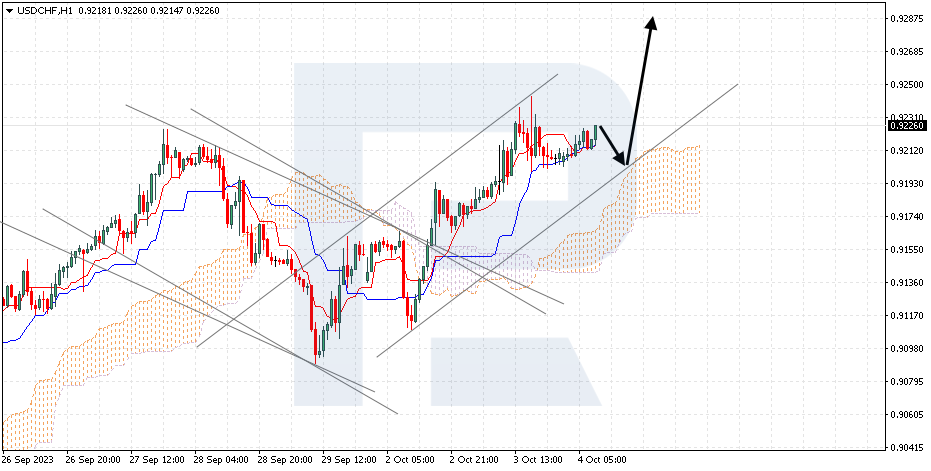
USDCHF is testing the resistance level. The instrument is going above the Ichimoku Cloud, which suggests an uptrend. A test of the upper boundary of the bullish channel at 0.9195 is expected, followed by a rise to 0.9285. An additional signal confirming the rise will be a rebound from the lower boundary of the bullish channel. The scenario can be cancelled by a breakout of the lower boundary of the Cloud with the price securing under 0.9125, which will mean a further decline to 0.9035.
Free Reports:
 Get our Weekly Commitment of Traders Reports - See where the biggest traders (Hedge Funds and Commercial Hedgers) are positioned in the futures markets on a weekly basis.
 Download Our Metatrader 4 Indicators – Put Our Free MetaTrader 4 Custom Indicators on your charts when you join our Weekly Newsletter
BRENT
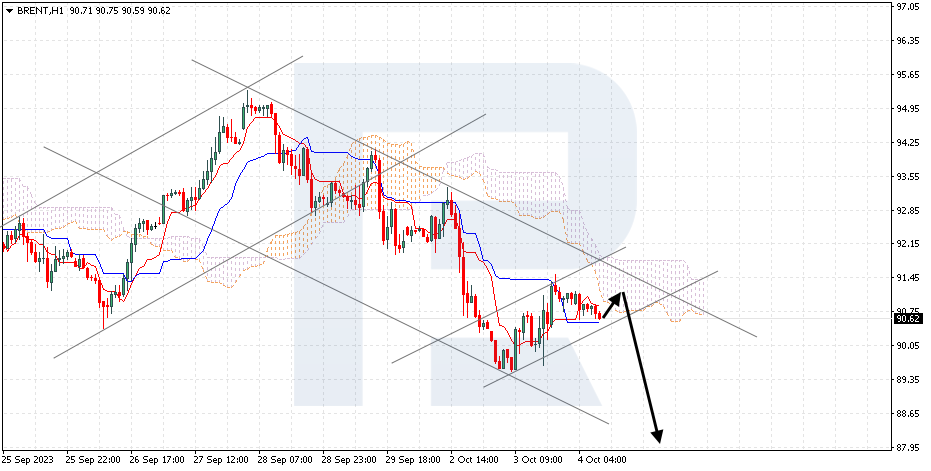
Brent is declining within a bearish channel. The instrument is going below the Ichimoku Cloud, which suggests a downtrend. A test of the lower boundary of the Cloud at 90.95 is expected, followed by a decline to 87.95. An additional signal confirming the decline will be a rebound from the upper boundary of the bearish channel. The scenario can be cancelled by a breakout of the upper boundary of the Cloud with the price securing above 92.25, which will mean further growth to 94.65. Meanwhile, the decline could be confirmed by a breakout of the lower boundary of the bullish channel with the price securing under 89.65.
Article By RoboForex.com
Attention!
Forecasts presented in this section only reflect the author s private opinion and should not be considered as guidance for trading. RoboForex LP bears no responsibility for trading results based on trading recommendations described in these analytical reviews.

- EUR/USD: Busy Week Ahead Aug 3, 2026
- Positive sentiment in the AI sector supported stock indices. Oil prices remain volatile Aug 3, 2026
- The Tech‑heavy NASDAQ Index jumped by more than 3.3%. The offshore yuan is trading at its highest level since 2023 Jul 31, 2026
- USD/JPY After Volatility: Multiple Events in One Day Jul 31, 2026
- The US indices sell off amid renewed US-Iran clashes. Oil jumps by 7% Jul 30, 2026
- USD/JPY Temporary in Equilibrium: Multiple Factors in Focus Jul 30, 2026
- GBP/USD at Month’s Lows: The Outlook Remains Weak Jul 29, 2026
- Crude oil falls below $80 per barrel. Australia sees inflation slowdown Jul 29, 2026
- The US Tech sector hit by sell‑off. Oil prices decline on renewed negotiations Jul 28, 2026
- Gold Declines, Focus on Fed and Falling Oil Prices Jul 28, 2026
